

MiR-449a antagonizes EMT through IL-6-mediated trans-signaling in laryngeal squamous cancer
- PMID: 38425711
- PMCID: PMC10901858
- DOI: 10.1016/j.omtn.2024.102140
MiR-449a antagonizes EMT through IL-6-mediated trans-signaling in laryngeal squamous cancer
Abstract
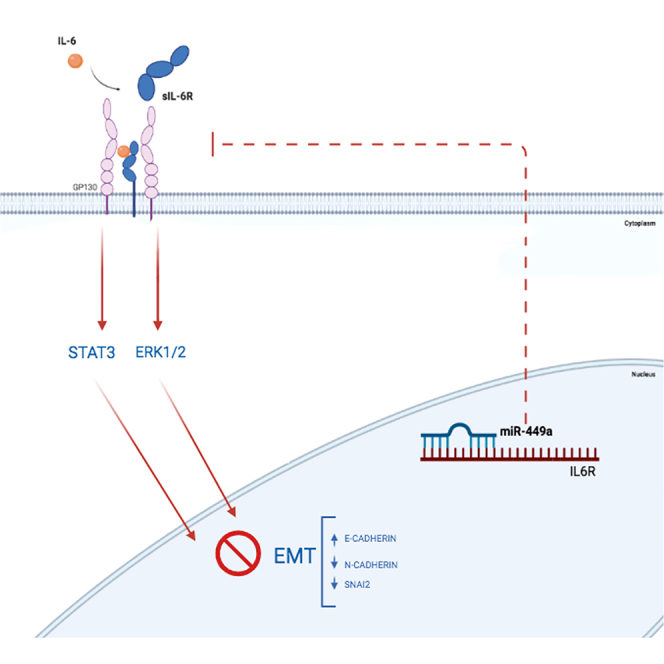
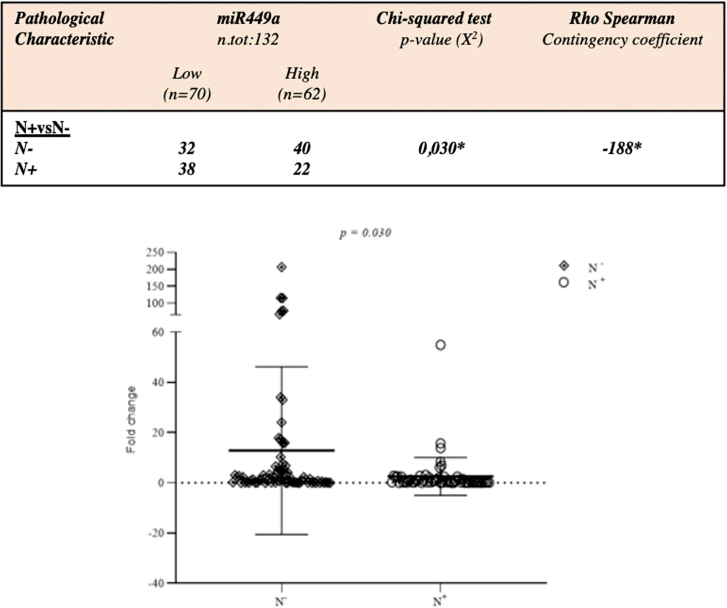
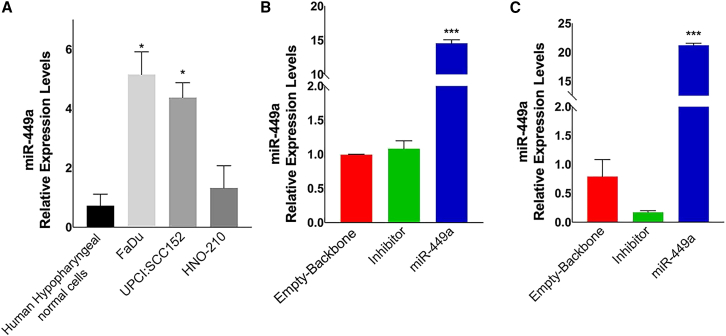
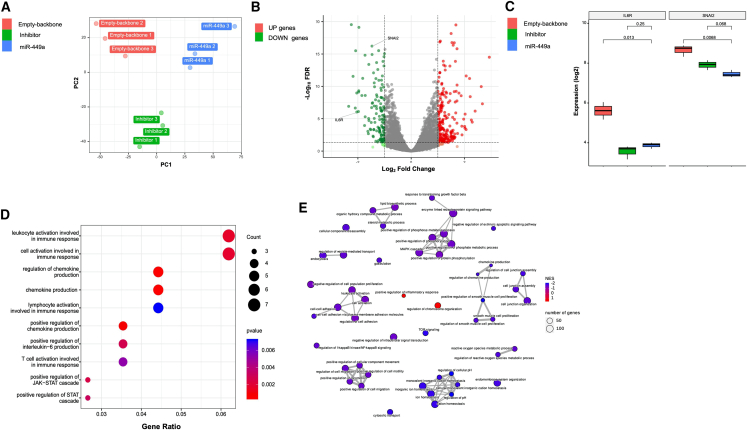
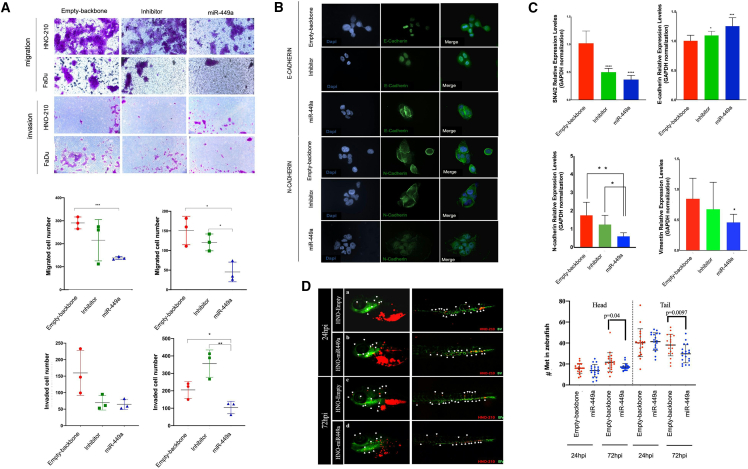
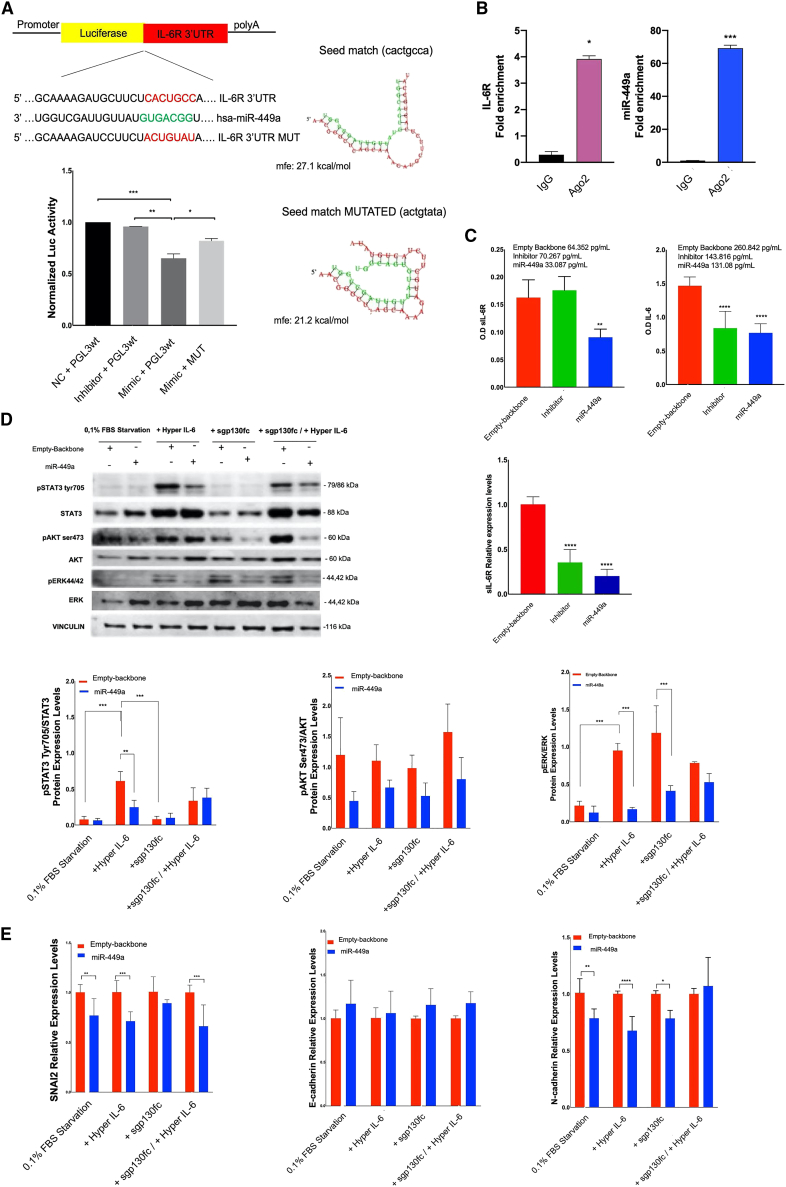
MicroRNAs (miRNAs) are involved in post-transcriptional gene expression regulation and in mechanisms of cancer growth and metastases. In this light, miRNAs could be promising therapeutic targets and biomarkers in clinical practice. Therefore, we investigated if specific miRNAs and their target genes contribute to laryngeal squamous cell carcinoma (LSCC) development. We found a significant decrease of miR-449a in LSCC patients with nodal metastases (63.3%) compared with patients without nodal involvement (44%). The AmpliSeq Transcriptome of HNO-210 miR-449a-transfected cell lines allowed the identification of IL6-R as a potential target. Moreover, the downregulation of IL6-R and the phosphorylation reduction of the downstream signaling effectors, suggested the inhibition of the IL-6 trans-signaling pathway. These biochemical effects were paralleled by a significant inhibition of invasion and migration in vitro and in vivo, supporting an involvement of epithelial-mesenchymal transition. These findings indicate that miR-449a contributes to suppress the metastasization of LSCC by the IL-6 trans-signaling block and affects sensitivity to external stimuli that mimic pro-inflammatory conditions.
Keywords: IL-6 trans-signaling; LSCC; MT: non-coding RNAs; gene expression; metastases miR-449a; microRNAs.
© 2024 The Author(s).
Conflict of interest statement
The all authors declare that they have no conflicts of interests.
Figures
Similar articles
-
Definition of miRNA Signatures of Nodal Metastasis in LCa: miR-449a Targets Notch Genes and Suppresses Cell Migration and Invasion.Mol Ther Nucleic Acids. 2020 Jun 5;20:711-724. doi: 10.1016/j.omtn.2020.04.006. Epub 2020 Apr 21. Mol Ther Nucleic Acids. 2020. PMID: 32402942 Free PMC article.
-
Long noncoding RNA SNHG7 contributes to cell proliferation, migration, invasion and epithelial to mesenchymal transition in non-small cell lung cancer by regulating miR-449a/TGIF2 axis.Thorac Cancer. 2020 Feb;11(2):264-276. doi: 10.1111/1759-7714.13245. Epub 2019 Dec 3. Thorac Cancer. 2020. PMID: 31793741 Free PMC article.
-
miR-375 and miR-205 Regulate the Invasion and Migration of Laryngeal Squamous Cell Carcinoma Synergistically via AKT-Mediated EMT.Biomed Res Int. 2016;2016:9652789. doi: 10.1155/2016/9652789. Epub 2016 Dec 19. Biomed Res Int. 2016. PMID: 28078305 Free PMC article.
-
MicroRNA-98-HMGA2-POSTN signal pathway reverses epithelial-to-mesenchymal transition in laryngeal squamous cell carcinoma.Biomed Pharmacother. 2019 Sep;117:108998. doi: 10.1016/j.biopha.2019.108998. Epub 2019 Jun 15. Biomed Pharmacother. 2019. PMID: 31207579
-
Potentials of lncRNA-miRNA-mRNA networks as biomarkers for laryngeal squamous cell carcinoma.Hum Cell. 2023 Jan;36(1):76-97. doi: 10.1007/s13577-022-00799-x. Epub 2022 Oct 1. Hum Cell. 2023. PMID: 36181662 Review.
Cited by
-
Exosomes multiplex profiling, a promising strategy for early diagnosis of laryngeal cancer.J Transl Med. 2024 Jun 20;22(1):582. doi: 10.1186/s12967-024-05396-0. J Transl Med. 2024. PMID: 38902710 Free PMC article.
-
Identification and bioinformatic characterization of a serum miRNA signature for early detection of laryngeal squamous cell carcinoma.J Transl Med. 2024 Jul 10;22(1):647. doi: 10.1186/s12967-024-05385-3. J Transl Med. 2024. PMID: 38987822 Free PMC article.
References
-
- Marziliano A., Teckie S., Diefenbach M.A. Alcohol-related head and neck cancer: Summary of the literature. Head Neck. 2020;42:732–738. - PubMed
-
- Mastronikolis N.S., Papadas T.A., Goumas P.D., Triantaphyllidou I.E., Theocharis D.A., Papageorgakopoulou N., Vynios D.H. Head and neck: Laryngeal tumors: an overview. Atlas Genet. Cytogenet. Oncol. Haematol. 2009;13:889.
-
- Gupta G.P., Massagué J. Cancer Metastasis: Building a Framework. Cell. 2006;127:679–695. - PubMed
LinkOut - more resources
Full Text Sources
Research Materials
