. 2024 Feb 16;27(3):109253.
doi: 10.1016/j.isci.2024.109253. eCollection 2024 Mar 15.

Oncolytic alphavirus replicons mediated recruitment and activation of T cells

Affiliations

Oncolytic alphavirus replicons mediated recruitment and activation of T cells

Darshak K Bhatt et al. iScience. .

Abstract

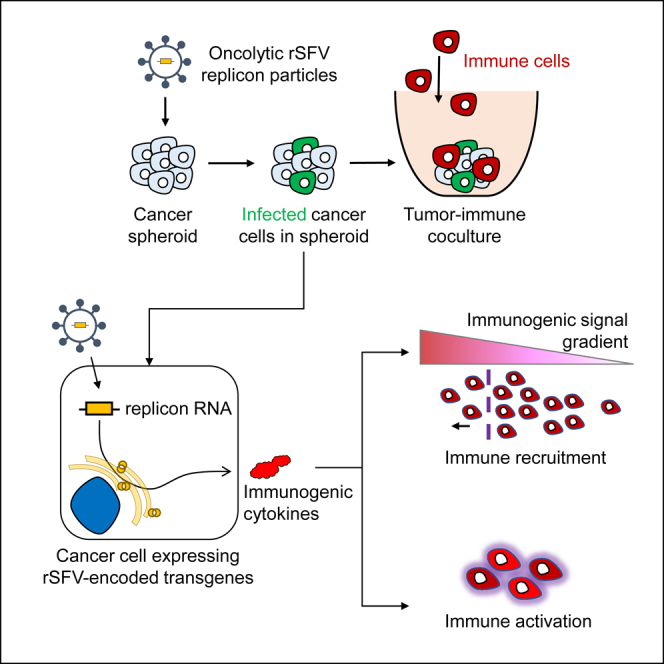
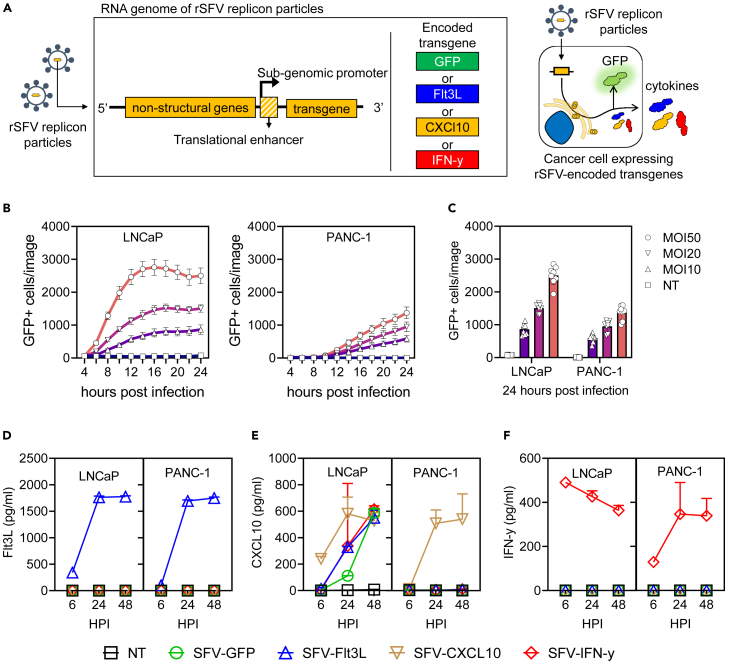
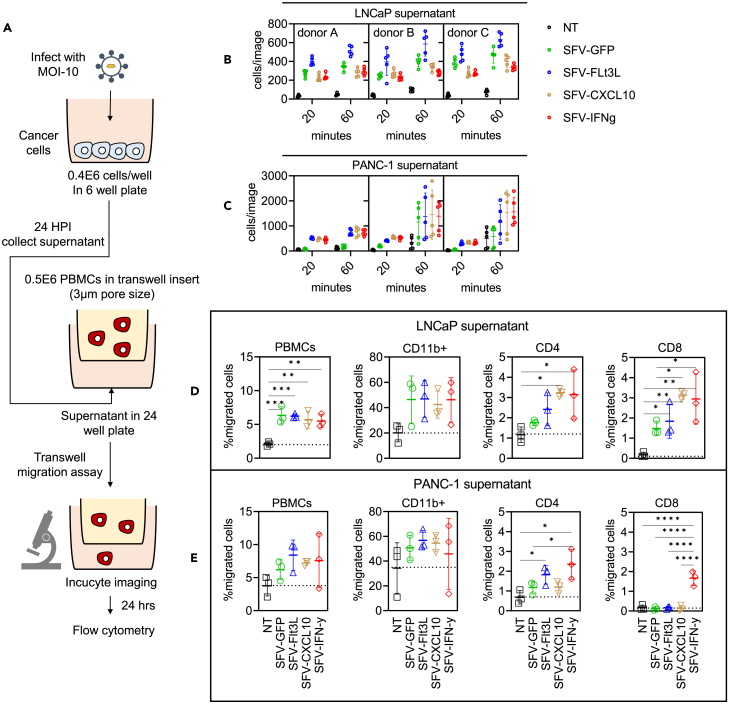
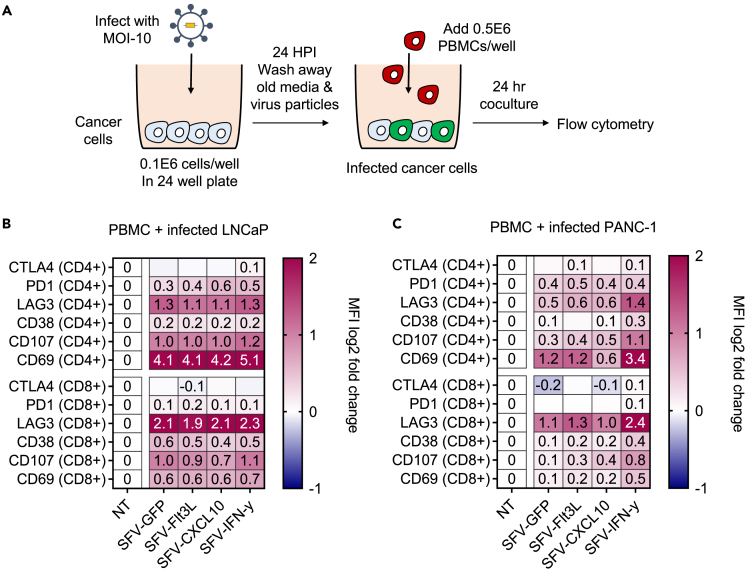
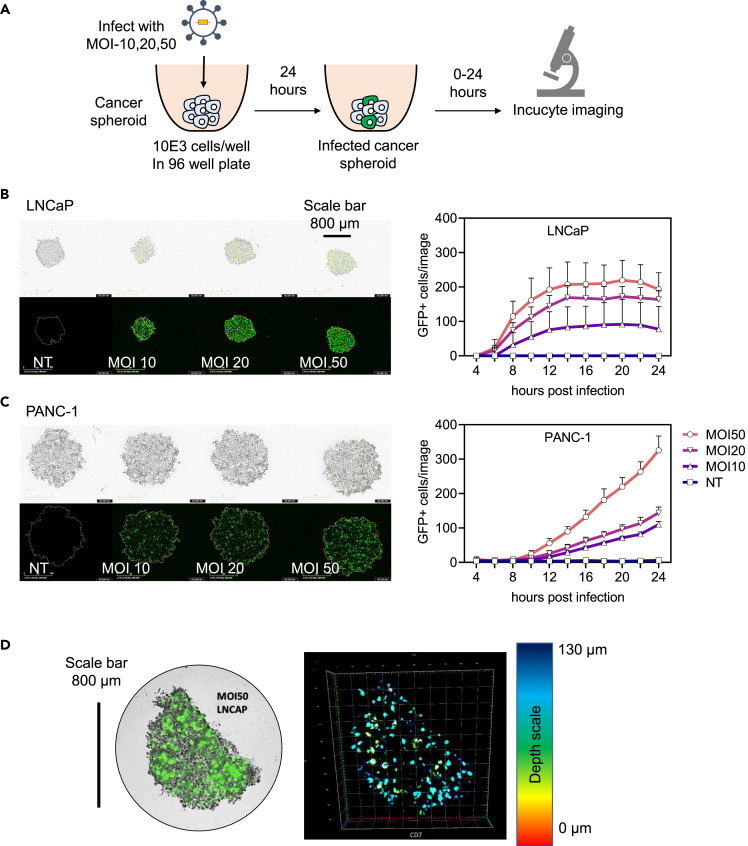
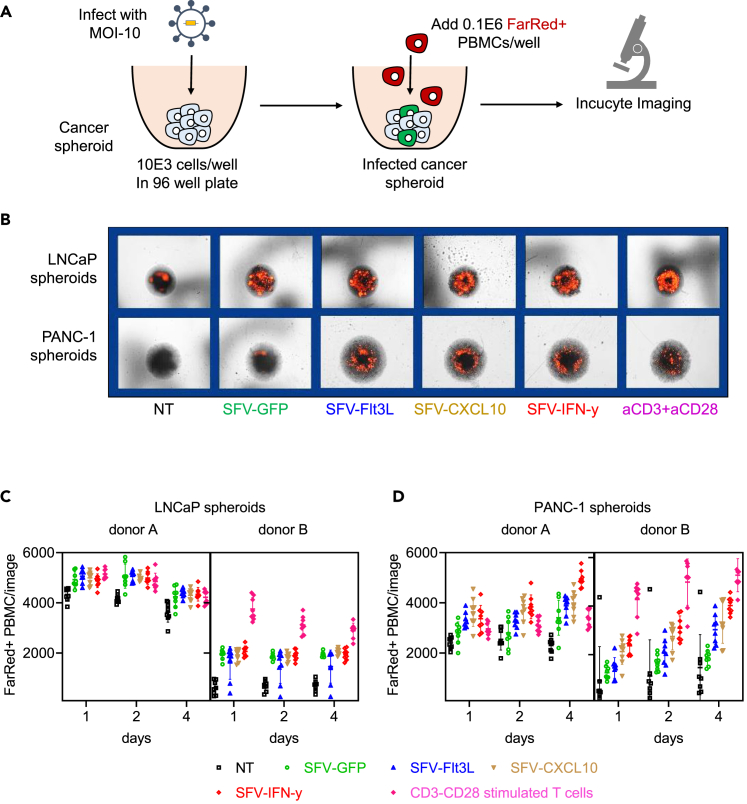
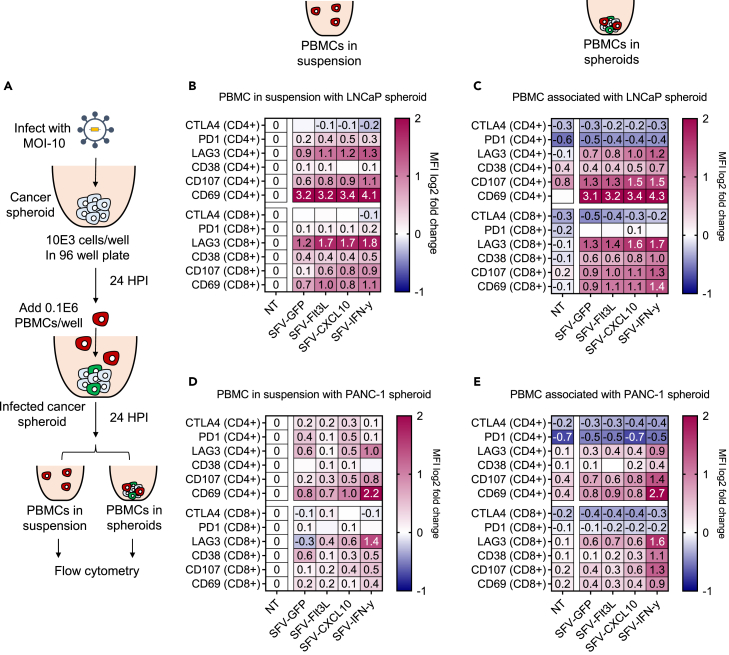
Oncolytic viruses show promise in enhancing tumor immunogenicity by releasing immunogenic signals during tumor cell infection and lysis. In this study, we improved the virus-induced tumor immunogenicity of recombinant Semliki Forest virus (rSFV)-based replicon particles by encoding immunogenic cytokines such as C-X-C motif chemokine ligand 10 (CXCL10), FMS-like tyrosine kinase 3 ligand (Flt3L), or interferon-gamma (IFN-ƴ). Real-time imaging and flow cytometry of human cancer cell-based monolayer and spheroid cultures, using LNCaP or PANC-1 cells, revealed effective infection and transgene expression in both models. LNCaP cells exhibited higher and earlier rSFV infection compared to PANC-1 cells. While infected LNCaP cells effectively triggered immune recruitment and T cell activation even without encoding cytokines, PANC-1 cells demonstrated improved immune responses only when infected with replicons encoding cytokines, particularly IFN-ƴ, which enhanced tumor immunogenicity irrespective of cancer cell susceptibility to infection. Our study demonstrates that despite innate phenotypic disparities in cancer cells, rSFV-based replicons encoding cytokines can potentially generate effective immune responses in the tumor.

Keywords: Immunology; Virology.


Conflict of interest statement

T.D. is co-founder of ViciniVax, a spin-off from the University of Groningen, developing therapeutic cancer vaccines.

Figures

None
Graphical abstract
Figure 1
Figure 1
Kinetics of cytokine expression by rSFV-particles infected cancer cells in monolayer (A) Genetic design of rSFV-particles (left) capable of a single round of infection and enhanced cytokine expression (right). (B) Temporal kinetics of GFP expression by LNCaP and PANC-1 cell lines infected with SFV-GFP replicon particles at different multiplicity of infection (MOI). (C) Re-visualization of the data of GFP+ cells at 24 h post-infection. Production of extracellular Flt3L (D), CXCl10 (E), and IFN-ƴ (F) by LNCaP and PANC-1 cell lines, measured by ELISA after 6, 24, and 48 h of infection with SFV-replicon particles encoding different cytokines. See Figure S1 for microscopy images corresponding to the data depicted in (B and C). In (B and C) each plot represents data from 8 replicate-images. In (D, E, and F) the plots represent data from 2 experiments. Legend: NT, non-infected cancer cells; SFV-GFP, cancer cells infected with rSFV encoding GFP; SFV-Flt3L, cancer cells infected with rSFV encoding Flt3L; SFV-CXCL10, cancer cells infected with rSFV encoding CXCL10; SFV-IFN-ƴ, cancer cells infected with rSFV encoding IFN-ƴ. Data are presented as mean ± SEM.
Figure 2
Figure 2
Kinetics of PBMC migration toward secreted signals from rSFV-infected cancer cells (A) The setup of a Transwell assay to assess the recruitment of immune cells toward the supernatants of SFV-infected cancer cells using microscopy. Temporal kinetics of PBMC migration (B and C) and flow cytometry-based endpoint comparison (D and E) between supernatants derived from infected or non-infected LNCaP cells or PANC-1 cells. See Figure S2 for the microscopy images corresponding to the data depicted in (B–E). PBMC from healthy donors were used for the experiment. Each condition had 15 replicates derived from 5 images of 3 independent donors. Data are presented as mean ± SEM. A p value of 0.05 was considered a statistically significant difference between compared groups (∗ = p < 0.05, ∗∗ = p < 0.01 and, ∗∗∗ = p < 0.001).
Figure 3
Figure 3
Immune activation by rSFV-infected cancer cells (A) The setup of a monolayer-based co-culture assay of infected cancer cells and PBMC to assess the immunogenic potential of rSFV-particles. Protein level expression of exhaustion and activation markers in CD4+ or CD8+ T cells upon co-culture with infected or non-infected (B) LNCaP or (C) PANC-1 cells. The median fluorescence intensity (MFI) for each marker quantified through flow cytometry was normalized to the non-infected (NT) condition. The values in (B) and (C) show the mean expression values of different donors represented on a log2 scale. See Figure S3 for the gating strategy and visualization of expression levels of individual markers and data of different donors for respective conditions. In (B and C) the plots represent data from duplicate conditions of 3 independent healthy donors.
Figure 4
Figure 4
Kinetics of transgene expression by rSFV-infected cells in cancer-spheroids (A) The setup of the cancer-spheroid generation and infection assay to measure transgene (GFP) expression using microscopy. Representative images of cancer-spheroids generated from LNCaP (B) and PANC-1 cells (C), and microscopy-based temporal quantification of GFP+ cells in cancer-spheroids from LNCaP and PANC-1 cells (on the right). (D) Confocal microscopy-based characterization of spatial information of GFP+ cells present in an LNCaP spheroid (on the left). The depth at which a GFP-expressing cell is present in the spheroid is depicted by the color-coded legend (on the right). In (B and C) the top row depicts brightfield images, the bottom row depicts fluorescence images for GFP visualization, and the plots represent data from 8 replicate-spheroids. See Figure S4 for microscopy images corresponding to (B and C). Data are presented as mean ± SEM.
Figure 5
Figure 5
Infiltration-kinetics of PBMC toward rSFV-infected cancer-spheroids (A) The setup of a cancer-spheroid and PBMC co-culture experiment to quantify immune infiltration in a 3D model using microscopy. (B) Representative microscopy images of far-red stained PBMC (in red) associated with LNCaP (top row) or PANC-1 (bottom row) spheroids at day 4 post co-culture. Kinetics of PBMC infiltration in (C) LNCaP or (D) PANC-1 spheroids infected with rSFV-particles up to 4 days post co-culture. See Figure S5 to visualize the microscopy images of different replicates for respective conditions. As a positive control, T cells stimulated overnight with antibodies against CD3 and CD28 were used. In (B and C) the plots represent data from 8 replicate-spheroids and 2 independent donors. The number of far-red positive PBMC is quantified as the number of red events per image, where each image consists of an individual spheroid per well. Data are presented as mean ± SEM.
Figure 6
Figure 6
Immune activation by rSFV-infected cancer-spheroids (A) The setup of cancer-spheroid and PBMC co-culture to assess the immunogenic potential of rSFV-particles in a 3D model. Protein level expression of exhaustion and activation markers assessed by flow cytometry in CD4+ or CD8+ T cells upon co-culture with infected or non-infected (B and C) LNCaP or (D and E) PANC-1-spheroids. (B) and (D) represent the expression profile of CD4+ or CD8+ T cells present outside the spheroid in suspension media, while (C) and (E) represent the expression profile of T cells associated with or present in the spheroids. The median fluorescence intensity (MFI) for each marker quantified through flow cytometry is normalized to the non-infected (NT) condition from the T cells present in suspension. The values in (B–E) are the mean expression values of different donors represented on a log2 scale. In (B–E) the plots represent data from duplicate conditions of 3 independent healthy donors. See Figure S6 for the visualization of expression levels of individual markers and data of different donors for respective conditions. The gating strategy is the same as in Figure S3A.

Similar articles

Cited by

References

    1. Russell S.J., Peng K.-W., Bell J.C. Oncolytic virotherapy. Nat. Biotechnol. 2012;30:658–670. doi: 10.1038/nbt.2287. - DOI - PMC - PubMed
    1. Bhatt D.K., Wekema L., Carvalho Barros L.R., Chammas R., Daemen T. A systematic analysis on the clinical safety and efficacy of Onco-Virotherapy. Mol. Ther. Oncolytics. 2021;23:239–253. doi: 10.1016/j.omto.2021.09.008. S2372770521001364. - DOI - PMC - PubMed
    1. Twumasi-Boateng K., Pettigrew J.L., Kwok Y.Y.E., Bell J.C., Nelson B.H. Oncolytic viruses as engineering platforms for combination immunotherapy. Nat. Rev. Cancer. 2018;18:419–432. doi: 10.1038/s41568-018-0009-4. - DOI - PubMed
    1. Martin N.T., Bell J.C. Oncolytic Virus Combination Therapy: Killing One Bird with Two Stones. Mol. Ther. 2018;26:1414–1422. doi: 10.1016/j.ymthe.2018.04.001. - DOI - PMC - PubMed
    1. de Gruijl T.D., Janssen A.B., van Beusechem V.W. Arming oncolytic viruses to leverage antitumor immunity. Expert Opin. Biol. Ther. 2015;15:959–971. doi: 10.1517/14712598.2015.1044433. - DOI - PubMed

LinkOut - more resources