. 2024 Feb 13;4(2):760-770.
doi: 10.1021/jacsau.3c00781. eCollection 2024 Feb 26.

Exploring the Landscape of Aptamers: From Cross-Reactive to Selective to Specific, High-Affinity Receptors for Cocaine

Affiliations

Exploring the Landscape of Aptamers: From Cross-Reactive to Selective to Specific, High-Affinity Receptors for Cocaine

Kyungae Yang et al. JACS Au. .

Abstract

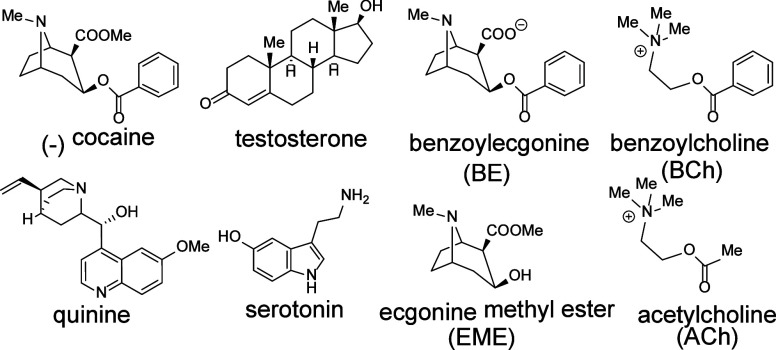
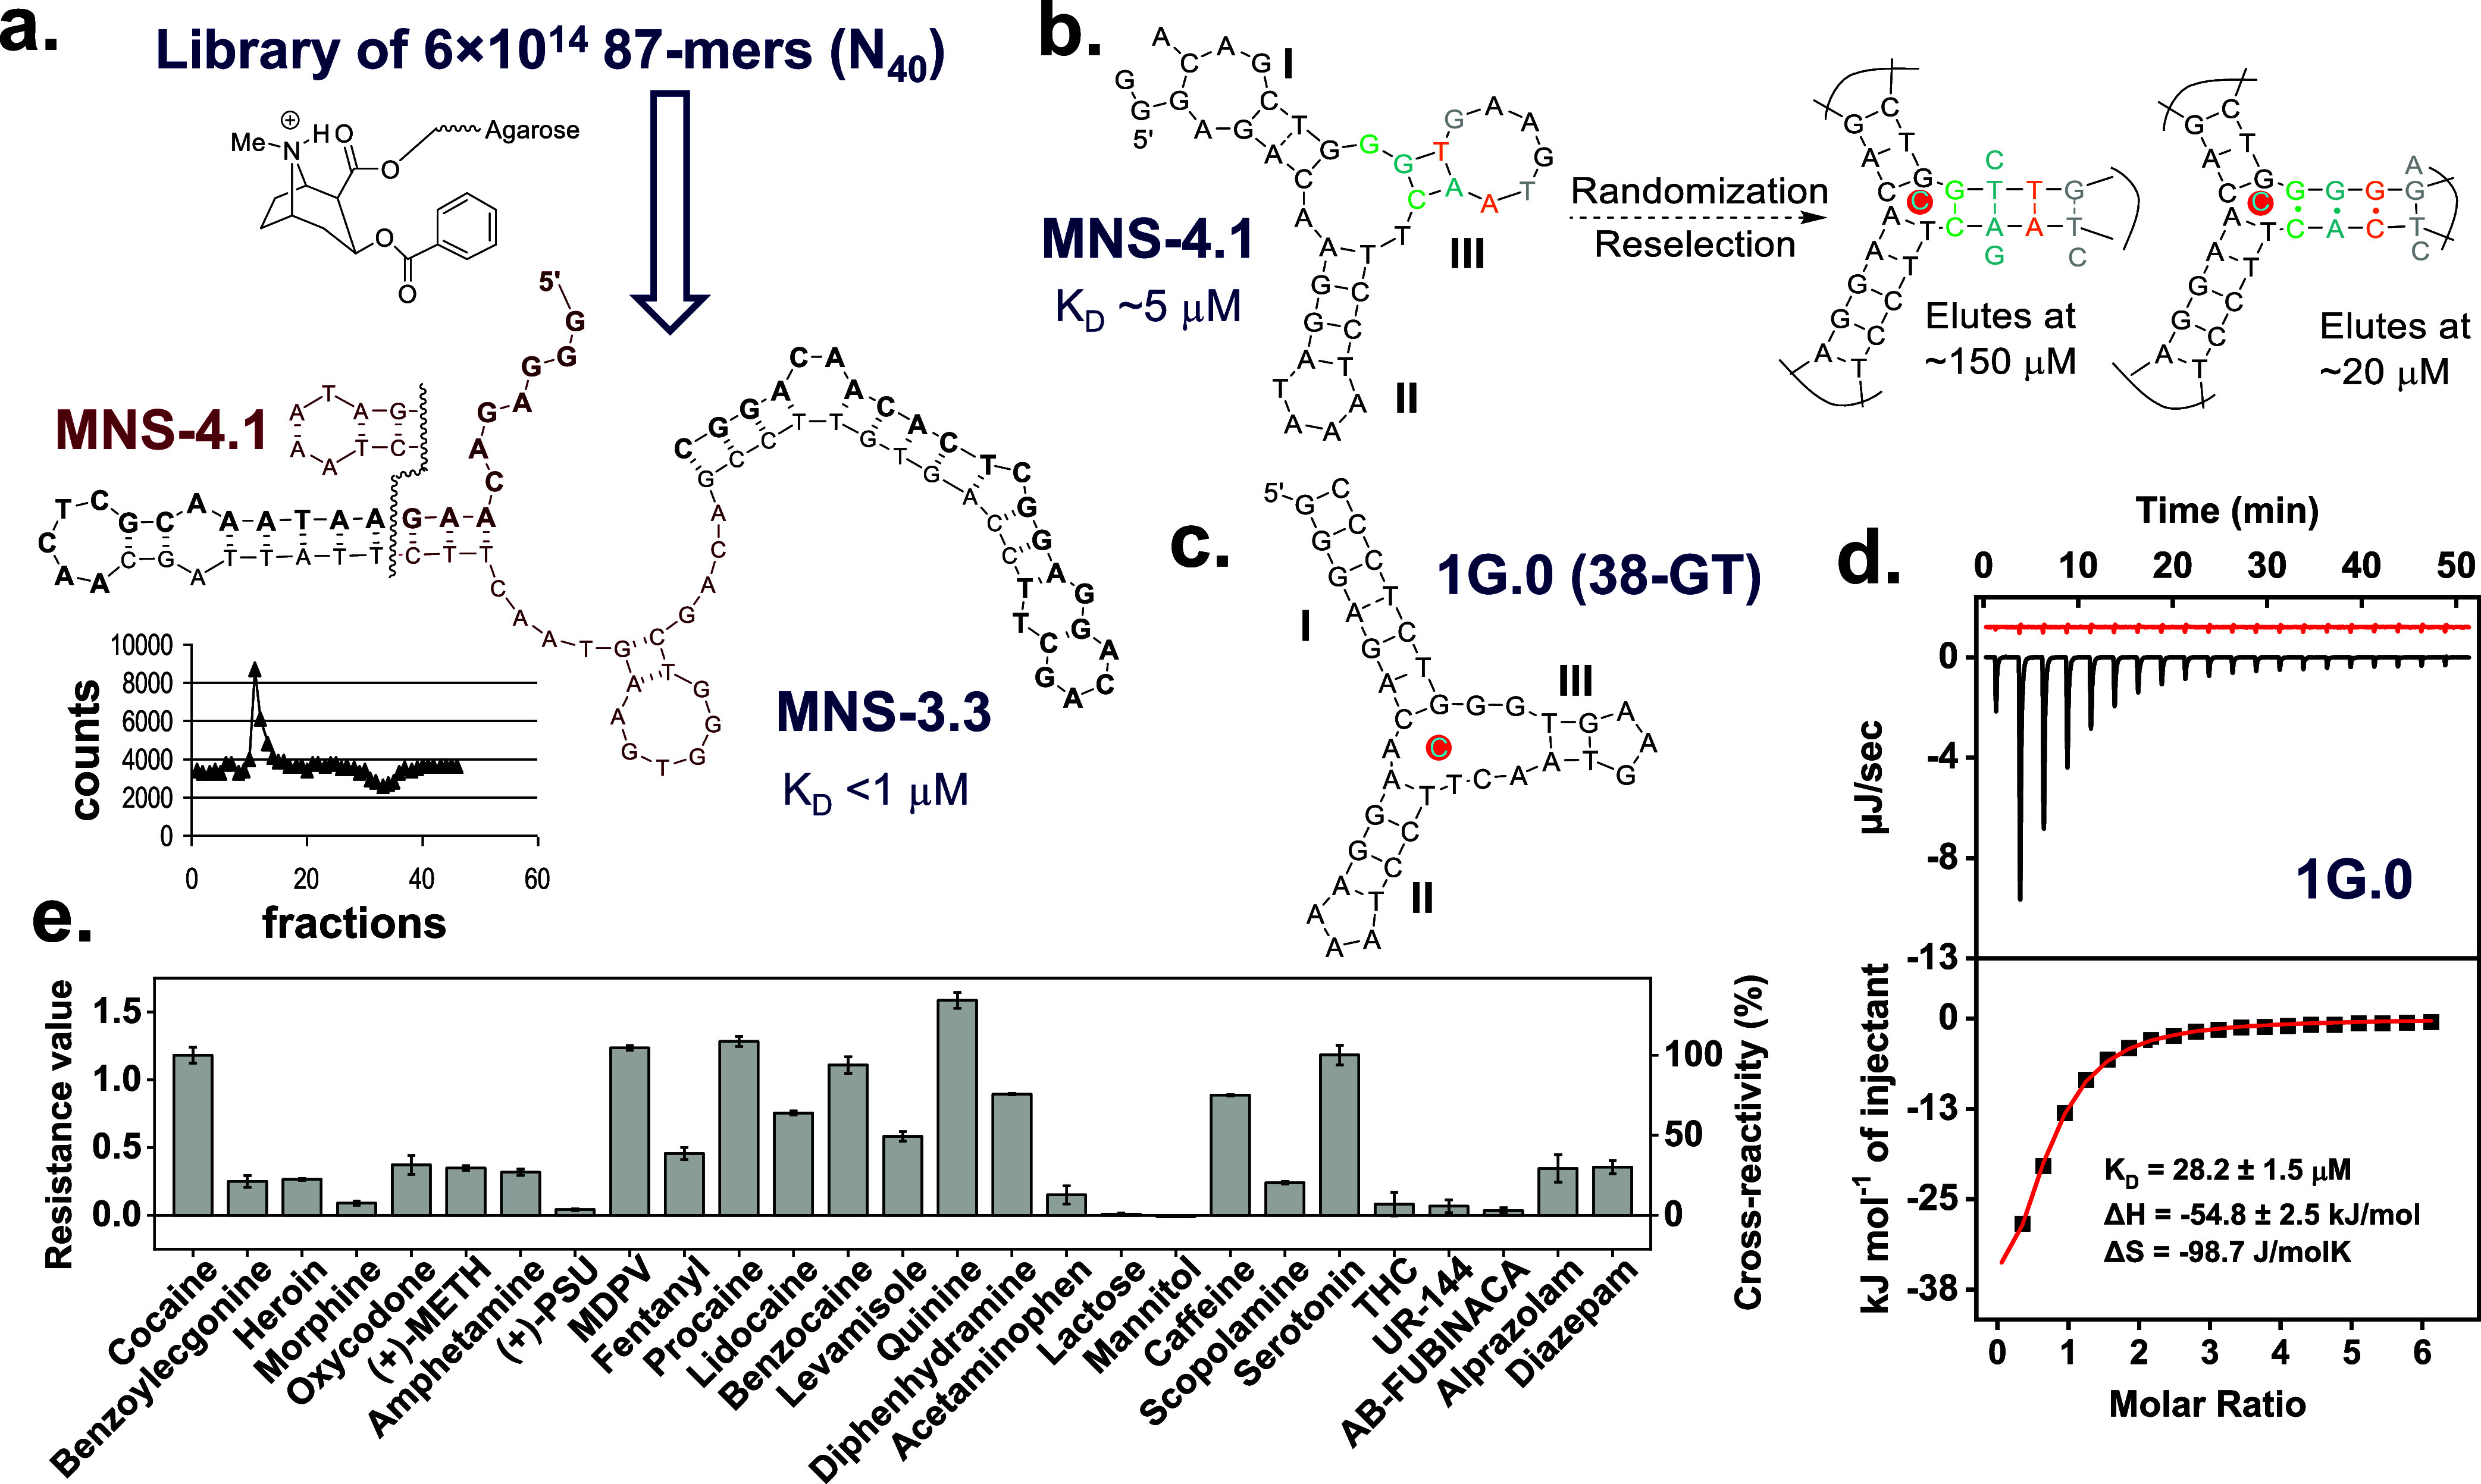
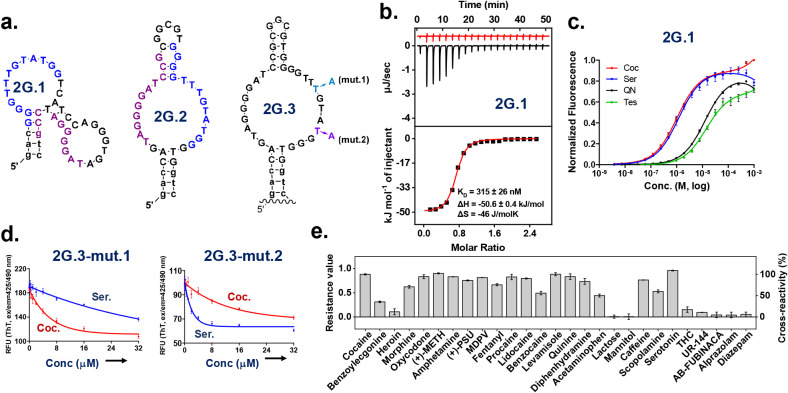
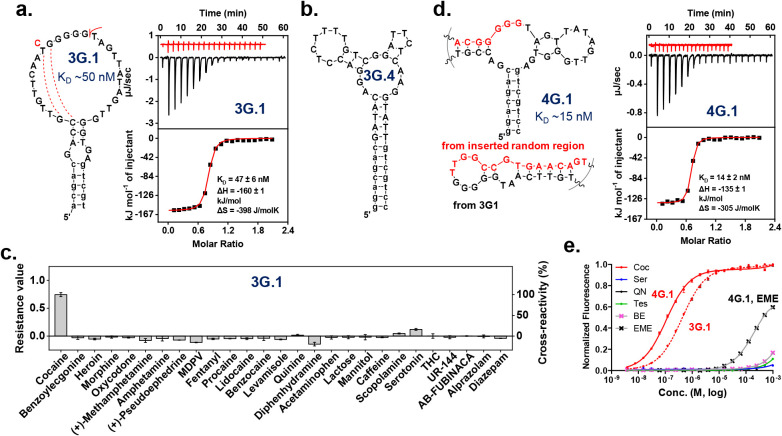
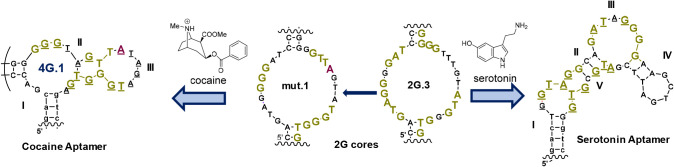
We reported over 20 years ago MNS-4.1, the first DNA aptamer with a micromolar affinity for cocaine. MNS-4.1 is based on a structural motif that is very common in any random pool of oligonucleotides, and it is actually a nonspecific hydrophobic receptor with wide cross-reactivity with alkaloids and steroids. Despite such weaknesses preventing broad applications, this aptamer became widely used in proof-of-concept demonstrations of new formats of biosensors. We now report a series of progressively improved DNA aptamers recognizing cocaine, with the final optimized receptors having low nanomolar affinity and over a thousand-fold selectivity over the initial cross-reactants. In the process of optimization, we tested different methods to eliminate cross-reactivities and improve affinity, eventually achieving properties that are comparable to those of the reported monoclonal antibody candidates for the therapy of overdose. Multiple aptamers that we now report share structural motifs with the previously reported receptor for serotonin. Further mutagenesis studies revealed a palindromic, highly adaptable, broadly cross-reactive hydrophobic motif that could be rebuilt through mutagenesis, expansion of linker regions, and selections into receptors with exceptional affinities and varying specificities.


Conflict of interest statement

The authors declare no competing financial interest.

Figures

Scheme 1
Scheme 1. Key Small Molecules Discussed in the Text
Figure 1
Figure 1
Isolation and characterization of the first-generation cocaine aptamers: (a) starting from a library of DNA 87-mers, comprising two primers (bold) and a randomized 40-mer region, we performed the affinity separation of cocaine binders on an agarose column displaying a cocaine analog. This protocol resulted in MNS-3.3 (the inset shows equilibrium gel filtration results using 10 μM radiolabeled cocaine (3H at Me-N), showing full saturation of 1 nmol of receptor). Subsequent minimization identified the maroon sequence as sufficient for high affinity binding (below 10 μM), leading to the aptamer MNS-4.110. (b) MNS-4.1 (secondary structure generated at the time) was rerandomized and subjected to reselection. The final pool (after four cycles) was subjected to affinity separation on a cocaine-displaying agarose column, with two peaks identified, one with a fully matched junction eluting at a calculated 150 μM affinity, and the other with a single point G*A mismatch in the junction, eluting at under 20 μM (the secondary structure shown is in an analogy to the fully matched junctions). (c) An example of a cocaine-binding sequence used in the literature, herein labeled as 1G.0 aptamer (alt. 38-GT), with three stems (IIII). (d) Determination of the affinity of 1G.0 with isothermal calorimetric titration (ITC), injection of 2400 μM cocaine to 80 μM 1G.0. (e) The cross-reactivity profile of 1G.0, showing interactions with different drugs, additives and metabolites (experimental section in Supporting Information).
Figure 2
Figure 2
Characterization of the second-generation cocaine aptamers (lower font sequences are derived from the constant flanking region of library used in the initial selection): (a) the protocol with cocaine in solution-phase and N36 library displayed on a column with complementary oligonucleotide resulted predominantly in the aptamers 2G.1 and 2G.2. Two sequences were related through a circular permutation, despite substantially different predicted secondary structures. 2G.3 is an example of a consensus receptor engineered to represent their common binding pocket core. (b) Determination of KD using ITC, 250 μM cocaine was injected to 20 μM 2G.1). (c) The 2G aptamers were highly selective over quinine and testosterone (Scheme 1), which were used in the counterselection, but bound equally well serotonin and cocaine. We show here the displacements by ligands of a quencher-labeled competitor oligonucleotide from fluorescently labeled 2G.1. (d) Single point mutations of 2G.3 yield aptamers selective for cocaine (2G.3-mut.1, cf. (a)) or serotonin (2G.3-mut.2, cf. (a)). The comparison of single point mutants was made using a ligand-induced displacement assay of Thioflavin T (ThT) dye. (e) Cross-reactivity of 2G.1 was assessed with the standard panel of cross-reactants using an exonuclease protection assay.
Figure 3
Figure 3
Third and fourth generations of cocaine aptamers (lower font sequences are derived from the flanking, constant regions used in the initial selection): (a) the highest affinity third-generation aptamer, 3G.1, obtained through a procedure that included counterselection with serotonin; C in the red font next to T shows the substitution that connects the mfold-predicted secondary structures of the 3G.1 and 4G aptamers (the red, dashed lines). We show the ITC data (injection of 100 μM cocaine to 10 μM aptamer). (b) 3G.4 was the most abundant aptamer isolated while using the counterselection with a complement; it was the only sequence that lacked more than three guanosines in a row. (c) The cross-reactivity of 3G.1 with a standard panel using an exonuclease protection assay. (d) Further attempts to improve the affinity led to the related 4G.1 aptamer (red font is used to stress the inserted random sequence, the insertion position is shown in (a) by a red mark); with its affinity characterized by ITC (injection of 50 μM cocaine to 5 μM 4G.1). (e) The 3G.1 and 4G.1 receptors both show over a 10,000-fold preference over the initial cross-reactants, quinine, testosterone, and serotonin (Scheme 1) in the fluorescence displacement assays, and a >2000-fold preference over ecgonine methyl ester (EME).
Figure 4
Figure 4
Two different types of fluorescent sensors derived from the 4G.1 receptors, labeled with the donor (FAM) and acceptor (TAMRA) fluorescent dyes: (a) this classical fluorescence energy resonance transfer (FRET) aptameric sensor, F4G.1flT, is based on the full length 4G.1, with a KD of 17 ± 3 nM matching, as predicted, the ITC values (14 ± 2 nM). (b) This sensor, F4G.1 cPT, is circularly permuted. It has a shortened new stem labeled to operate as the classical proximity quenching sensor (half-points were calculated using 520 nm and 580 nM emissions). Unexpectedly, it showed an improvement over the affinity measured of the original 4.1, possibly due to the overhangs of dyes.
Figure 5
Figure 5
Similarities between families of cocaine receptors and the previously reported serotonin aptamer: in the center, we show two members of the 2G family, showing overlaps with the high specificity cocaine and serotonin aptamers in golden font. The similarity between the high-specificity cocaine and serotonin aptamers is shown through underlining. The mutation in 2G core is the same as in Figure 2a.
Scheme 2
Scheme 2. Impacts of the Transformations (Stressed with Red Color) of Cocaine into Analogs on the Affinities of the 2G.1 and 4G.1 Aptamers
The superscripts 1 and 2 Refer to Values Obtained for the 2G.1 and 4G.1 Aptamers, Respectively. Under each structure, we provide ΔGD values (kJ/mol). These values are impacts of a compound on the equilibrium between a fluorescently labeled aptamer and the competitor oligonucleotide used in the selection labeled with a quencher. These values were obtained directly from the displacement half-point (X50%) in these assays (Figure S7). At the arrows connecting the individual structures, we show the impact of each modification on this equilibrium (ΔΔGD, kJ/mol). We should not compare directly the ΔGD between two aptamers without standardizing quenching levels because each aptamer has different interactions with its matching competitor oligonucleotide (Figure S3).

Similar articles

Cited by

References

    1. Ellington A. D.; Szostak J. W. In vitro selection of RNA molecules that bind specific ligands. Nature 1990, 346, 818–822. 10.1038/346818a0. - DOI - PubMed
    1. Tuerk C.; Gold L. Systematic evolution of ligands by exponential enrichment: RNA ligands to bacteriophage T4 DNA polymerase. Science 1990, 249, 505–510. 10.1126/science.2200121. - DOI - PubMed
    1. Ruscito A.; DeRosa M. C. Small-molecule binding aptamers: Selection strategies, characterization, and applications. Front. Chem. 2016, 4, 14.10.3389/fchem.2016.00014. - DOI - PMC - PubMed
    1. Yu H.; Alkhamis O.; Canoura J.; Liu Y.; Xiao Y. Advances and challenges in small-molecule DNA aptamer isolation, characterization, and sensor development. Angew. Chem. Int. Ed. 2021, 60, 16800–16823. 10.1002/anie.202008663. - DOI - PMC - PubMed
    1. Dunn M. R.; Jimenez R. M.; Chaput J. C. Analysis of aptamer discovery and technology. Nat. Rev. Chem. 2017, 1, 0076.10.1038/s41570-017-0076. - DOI

LinkOut - more resources