. 2024 Feb 6;4(2):578-591.
doi: 10.1021/jacsau.3c00687. eCollection 2024 Feb 26.

Copper(II) Can Kinetically Trap Arctic and Italian Amyloid-β40 as Toxic Oligomers, Mimicking Cu(II) Binding to Wild-Type Amyloid-β42: Implications for Familial Alzheimer's Disease

Affiliations

Copper(II) Can Kinetically Trap Arctic and Italian Amyloid-β40 as Toxic Oligomers, Mimicking Cu(II) Binding to Wild-Type Amyloid-β42: Implications for Familial Alzheimer's Disease

Yao Tian et al. JACS Au. .

Abstract

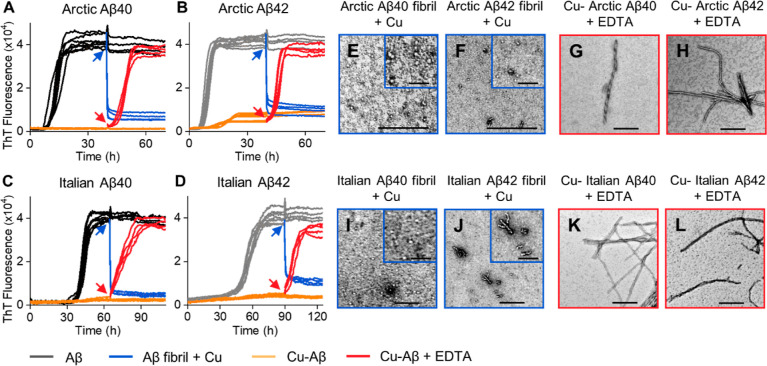
The self-association of amyloid-β (Aβ) peptide into neurotoxic oligomers is believed to be central to Alzheimer's disease (AD). Copper is known to impact Aβ assembly, while disrupted copper homeostasis impacts phenotype in Alzheimer's models. Here we show the presence of substoichiometric Cu(II) has very different impacts on the assembly of Aβ40 and Aβ42 isoforms. Globally fitting microscopic rate constants for fibril assembly indicates copper will accelerate fibril formation of Aβ40 by increasing primary nucleation, while seeding experiments confirm that elongation and secondary nucleation rates are unaffected by Cu(II). In marked contrast, Cu(II) traps Aβ42 as prefibrillar oligomers and curvilinear protofibrils. Remarkably, the Cu(II) addition to preformed Aβ42 fibrils causes the disassembly of fibrils back to protofibrils and oligomers. The very different behaviors of the two Aβ isoforms are centered around differences in their fibril structures, as highlighted by studies of C-terminally amidated Aβ42. Arctic and Italian familiar mutations also support a key role for fibril structure in the interplay of Cu(II) with Aβ40/42 isoforms. The Cu(II) dependent switch in behavior between nonpathogenic Aβ40 wild-type and Aβ40 Arctic or Italian mutants suggests heightened neurotoxicity may be linked to the impact of physiological Cu(II), which traps these familial mutants as oligomers and curvilinear protofibrils, which cause membrane permeability and Ca(II) cellular influx.


Conflict of interest statement

The authors declare no competing financial interest.

Figures

Figure 1
Figure 1
Effect of Cu2+ on Aβ40 and Aβ42 fibril kinetics profiles. Aβ40 (A) and Aβ42 (B) both 10 μM in the absence and presence of 0.1, 0.5, and 1.0 mol equiv of Cu2+, from black line to red line, respectively. (C) Change in t50 versus Cu2+, error bars are standard error of the mean (SEM) from four replicates. One-way ANOVA test, **P ≤ 0.01, ***P ≤ 0.001, and ****P ≤ 0.0001. Negatively stained TEM fibril images produced at 0, 0.5, and 1.0 mol equiv of Cu2+ for Aβ40 (D) and Aβ42 (E). Scale bars: 200 nm; inset 100 nm. (F) Node-to-node distance of Aβ40 and Aβ42 fibril twists and fibril width in the absence and presence of 0.5 mol equiv of Cu2+. N = 50 individual fibrils are measured per condition. Long and short twists are designated as types A and B, respectively. Preparations were incubated with 20 μM ThT in 30 mM HEPES and 160 mM NaCl buffer (pH 7.4) at 30 °C quiescently.
Figure 2
Figure 2
TEM images of Cu2+-trapped Aβ42 oligomers. (A) TEM images of 10 μM Aβ42 incubated with 5 μM Cu(II). (B) TEM images of oligomers from preformed fibrils with subsequent addition of Cu(II), scale bars: 200 nm. (C) 2D class averages of oligomers and curvilinear protofibrils for Aβ42 trapped by Cu(II), ca. 100 single particles are shown for each 2D class average, scale bar 5 nm.
Figure 3
Figure 3
Cu2+ effects the primary nucleation process of Aβ40 and Aβ42 aggregation. Normalized kinetic profiles of 10 μM Aβ40 (A–C) and Aβ42 (D,E) in the absence and presence of 0.1, 0.5, and 1.0 mol equiv of Cu2+, from black line to red line, respectively. The solid lines represent global fits of the kinetic traces when only primary nucleation (kn) (A,D), secondary nucleation (k2) (B,E) and fibril elongation (k+) (C,F) rate constants are altered. (G) Aβ40 with 5% fibril seeds in the absence and presence of 0.1, 0.5, and 1.0 mol equiv of Cu2+. (H) Schemes of the microscopic steps for primary nucleation, secondary nucleation, and fibril elongation.
Figure 4
Figure 4
Switching on/off the fibril growth of Aβ by EDTA and Cu2+. Kinetics profiles of 10 μM Aβ40 (A) and Aβ42 (B) in the absence (gray) and presence (orange) of 8 μM Cu2+. 8 μM Cu2+ (8 μM; blue) or 50 μM EDTA (red) was added to half of the samples at 90 h for Aβ40 and 65 h for Aβ42. N = 4 traces for each condition. TEM images of Aβ40 (C) and Aβ42 (D) produced with Cu2+ added to the preformed fibrils. Aβ40 (E) and Aβ42 (F) in the presence of Cu2+ with subsequent EDTA addition. Scale bars: 200 nm; inset 100 nm.
Figure 5
Figure 5
Scheme of Cu(II)’s impact on Aβ42 fibrilization. (A) Primary nucleation; the kinetic steps to go from monomer to fibrils, in which oligomer formation is the rate-limiting step. Addition of Cu(II) causes Aβ42 to dissociate from the fibril to form protofibrils. (B) Aβ42 fibrils are formed from the packing of two protofibrils. Key residues in the N-terminus bind Cu(II) and disrupt the electrostatic packing of protofibrils, causing the fibrils to dissociate. Fibril structure from pdb 5OQV.
Figure 6
Figure 6
Calcium influx of HEK293T cells in response to different Aβ42 preparations. (A) ThT fibril growth curves indicating the five Aβ42 preparations used. HEK293T cells are loaded with Ca(II) sensitive fluorescent dye, Fluoro3-AM. (B) Time-lapse recording of fluorescence relative to fluorescence before addition of Aβ42 monomer(Aβ42M), and subsequent addition of Aβ42 fibril (Aβ42F), Aβ42 oligomer (Aβ42O). Notably, only Aβ42 oligomers cause calcium influx. (C) Aβ42 fibril disassembled into oligomers, by Cu(II) addition, causes Ca(II) influx in HEK cells. (D) Aβ42 oligomers from the lag-phase causes Ca(II) influx. (E) Aβ42 assembly trapped as oligomers by Cu(II) and causes Ca(II) influx. Aβ42 (5 μM) is added to extracellular media, buffered at pH 7.4.
Figure 7
Figure 7
Cu(II) impact on C-amidated Aβ42 and N-acylated Aβ42 aggregation. Cu(II) has relatively little impact on C-amidated Aβ42 fibril formation, in contrast to wild-type Aβ42 and N-terminal amidated Aβ42, which are trapped as oligomers by Cu(II). Kinetics profiles of 10 μM C-amidated Aβ42 (A) and N-acylated Aβ42 (D) in the absence and presence of 0.1, 0.5, and 1.0 mol equiv of Cu2+. Inset shows normalized ThT fluorescence. Kinetics profiles of 10 μM C-amidated Aβ42 (B) and N-acylated Aβ42 (E) in the absence (black/gray) and presence (orange) of 8 μM Cu2+. 8 μM Cu2+ (8 μM; blue) or 50 μM EDTA (red) was added to half of the samples at 8 h for C-amidated Aβ42 and 90 h for N-acylated Aβ42. N = 4 traces for each condition. TEM fibril images produced at 0, 0.5, and 1.0 mol equiv of Cu2+ for C-amidated Aβ42 (C) and N-acylated Aβ42 (F). TEM images of C-amidated Aβ42 (G) and N-acylated Aβ42 (H) produced with Cu2+ added to preformed fibrils. C-amidated Aβ42 (I) and N-acylated Aβ42 (J) were analyzed in the presence of Cu2+ with subsequent EDTA addition. Scale bars: 200 nm; inset 30 nm. (K) Node-to-node distance of C-amidated Aβ42 and N-acylated Aβ42 fibril twists. (L) Fibril widths. N = 50 individual fibrils are measured per condition.
Figure 8
Figure 8
Cu2+ inhibits the formation of Arctic and Italian Aβ40 and Aβ42 fibril formation. Kinetics profiles of 10 μM Arctic Aβ40 (A), Arctic Aβ42 (B), Italian Aβ40 (C) and Italian Aβ42 (D) in the absence and presence of 0.1, 0.5, and 1.0 mol equiv of Cu2+. Negatively stained TEM fibril images produced at 0, 0.5, and 1.0 mol equiv of Cu2+ for Arctic Aβ40 (E), Arctic Aβ42 (F), Italian Aβ40 (G) and Italian Aβ42 (H). Scale bars: 200 nm; inset, 50 nm. (I) Node-to-node distance of fibril twists. (J) Fibril width. N = 50 individual fibrils are measured per condition.
Figure 9
Figure 9
Switching on/off the fibril growth of Arctic and Italian Aβ by EDTA and Cu2+. Kinetics profiles of 10 μM Arctic Aβ40 (A), Arctic Aβ42 (B), Italian Aβ40 (C), and Italian Aβ42 (D) in the absence (black/gray) and presence (orange) of 8 μM Cu2+. 8 μM Cu2+ (blue) or 50 μM EDTA (red) was added to half the samples at 40 h for Arctic Aβ40/42, 65 h for Italian Aβ40 and 90 h for Italian Aβ42. Preparations were incubated with 20 μM ThT in 30 mM HEPES and 160 mM NaCl buffer (pH 7.4) at 30 °C quiescently. N = 4 traces for each condition. TEM images of Arctic Aβ40 (E), Arctic Aβ42 (F), Italian Aβ40 (I) and Italian Aβ42 (J) produced with Cu2+ added to preformed fibrils. Arctic Aβ40 (I), Arctic Aβ42 (J), Italian Aβ40 (K) and Italian Aβ42 (L) in the presence of Cu2+ with subsequent EDTA addition. Scale bars: 200 nm; inset 50 nm.

Similar articles

Cited by

References

    1. Prince M.; Bryce R.; Albanese E.; Wimo A.; Ribeiro W.; Ferri C. P. The global prevalence of dementia: a systematic review and metaanalysis. Alzheimers Dement 2013, 9 (1), 63–75. 10.1016/j.jalz.2012.11.007. - DOI - PubMed
    1. Hardy J. A.; Higgins G. A. Alzheimer’s disease: the amyloid cascade hypothesis. Science 1992, 256 (5054), 184–185. 10.1126/science.1566067. - DOI - PubMed
    1. Selkoe D. J. The molecular pathology of Alzheimer’s disease. Neuron 1991, 6 (4), 487–498. 10.1016/0896-6273(91)90052-2. - DOI - PubMed
    1. Selkoe D. J.; Hardy J. The amyloid hypothesis of Alzheimer’s disease at 25 years. EMBO Mol. Med. 2016, 8 (6), 595–608. 10.15252/emmm.201606210. - DOI - PMC - PubMed
    1. Naslund J.; Schierhorn A.; Hellman U.; Lannfelt L.; Roses A. D.; Tjernberg L. O.; Silberring J.; Gandy S. E.; Winblad B.; Greengard P.; et al. Relative abundance of Alzheimer A beta amyloid peptide variants in Alzheimer disease and normal aging. Proc. Natl. Acad. Sci. U.S.A. 1994, 91 (18), 8378–8382. 10.1073/pnas.91.18.8378. - DOI - PMC - PubMed

LinkOut - more resources