

Explainable artificial intelligence for microbiome data analysis in colorectal cancer biomarker identification
- PMID: 38426064
- PMCID: PMC10901987
- DOI: 10.3389/fmicb.2024.1348974
Explainable artificial intelligence for microbiome data analysis in colorectal cancer biomarker identification
Abstract
Background: Colorectal cancer (CRC) is a type of tumor caused by the uncontrolled growth of cells in the mucosa lining the last part of the intestine. Emerging evidence underscores an association between CRC and gut microbiome dysbiosis. The high mortality rate of this cancer has made it necessary to develop new early diagnostic methods. Machine learning (ML) techniques can represent a solution to evaluate the interaction between intestinal microbiota and host physiology. Through explained artificial intelligence (XAI) it is possible to evaluate the individual contributions of microbial taxonomic markers for each subject. Our work also implements the Shapley Method Additive Explanations (SHAP) algorithm to identify for each subject which parameters are important in the context of CRC.
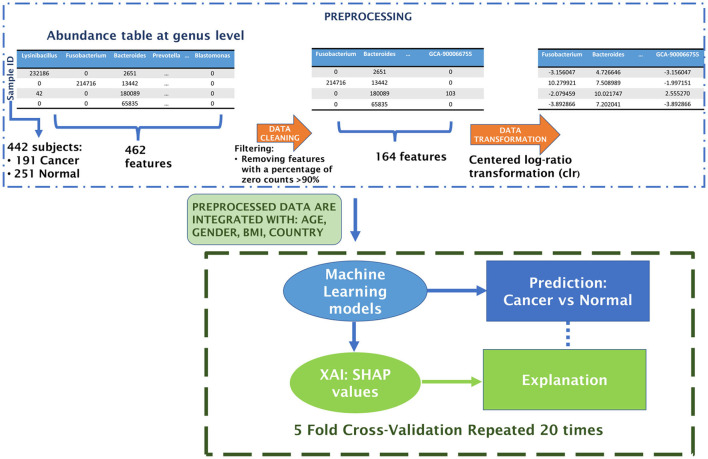
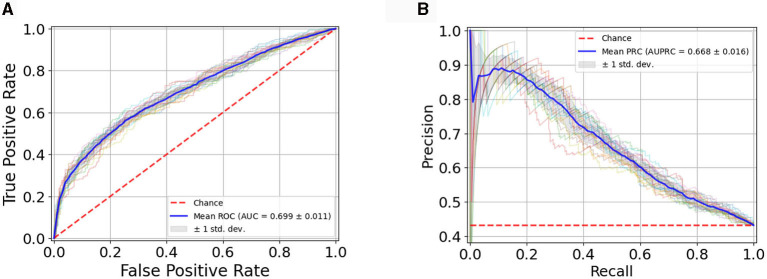
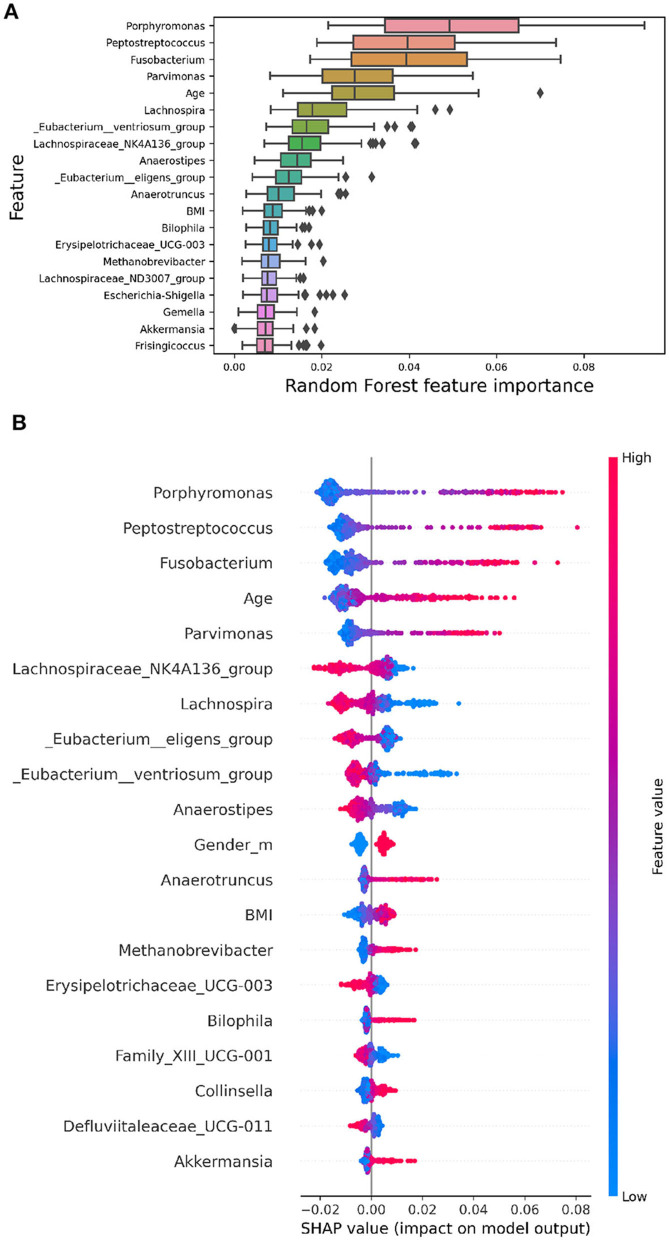
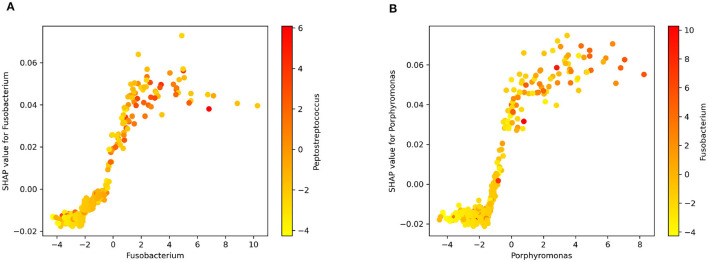
Results: The proposed study aimed to implement an explainable artificial intelligence framework using both gut microbiota data and demographic information from subjects to classify a cohort of control subjects from those with CRC. Our analysis revealed an association between gut microbiota and this disease. We compared three machine learning algorithms, and the Random Forest (RF) algorithm emerged as the best classifier, with a precision of 0.729 ± 0.038 and an area under the Precision-Recall curve of 0.668 ± 0.016. Additionally, SHAP analysis highlighted the most crucial variables in the model's decision-making, facilitating the identification of specific bacteria linked to CRC. Our results confirmed the role of certain bacteria, such as Fusobacterium, Peptostreptococcus, and Parvimonas, whose abundance appears notably associated with the disease, as well as bacteria whose presence is linked to a non-diseased state.
Discussion: These findings emphasizes the potential of leveraging gut microbiota data within an explainable AI framework for CRC classification. The significant association observed aligns with existing knowledge. The precision exhibited by the RF algorithm reinforces its suitability for such classification tasks. The SHAP analysis not only enhanced interpretability but identified specific bacteria crucial in CRC determination. This approach opens avenues for targeted interventions based on microbial signatures. Further exploration is warranted to deepen our understanding of the intricate interplay between microbiota and health, providing insights for refined diagnostic and therapeutic strategies.
Keywords: biomarker identification; colorectal cancer; explainable artificial intelligence; machine learning; microbiome; microbiota; precision medicine.
Copyright © 2024 Novielli, Romano, Magarelli, Bitonto, Diacono, Chiatante, Lopalco, Sabella, Venerito, Filannino, Bellotti, De Angelis, Iannone and Tangaro.
Conflict of interest statement
The authors declare that the research was conducted in the absence of any commercial or financial relationships that could be construed as a potential conflict of interest. The author(s) declared that they were an editorial board member of Frontiers, at the time of submission. This had no impact on the peer review process and the final decision.
Figures
References
-
- Aitchison J. (1982). The statistical analysis of compositional data. J. Royal Stat. Soc. Series B 44, 139–160. 10.1111/j.2517-6161.1982.tb01195.x - DOI
-
- Amodeo I., De Nunzio L., Raffaeli G., Borzani G., Griggio I., Conte A., et al. . (2021). A machine and deep learning approach to predict pulmonary hypertension in newborns with congenital diaphragmatic hernia (clannish): protocol for a retrospective study. Plos ONE 16, 724. 10.1371/journal.pone.0259724 - DOI - PMC - PubMed
-
- Bellando-Randone S., Russo E., Venerito V., Matucci-Cerinic M., Iannone F., Tangaro S., et al. . (2021). Exploring the oral microbiome in rheumatic diseases, state of art and future prospective in personalized medicine with an ai approach. J. Pers. Med. 11, 625. 10.3390/jpm11070625 - DOI - PMC - PubMed
LinkOut - more resources
Full Text Sources