

Immunometabolic features of natural killer cells are associated with infection outcomes in critical illness
- PMID: 38426112
- PMCID: PMC10902670
- DOI: 10.3389/fimmu.2024.1334882
Immunometabolic features of natural killer cells are associated with infection outcomes in critical illness
Abstract
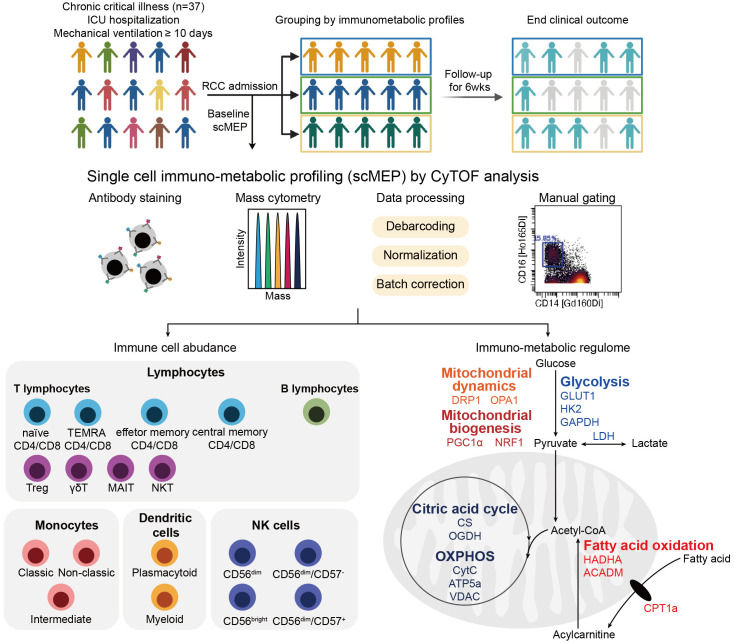
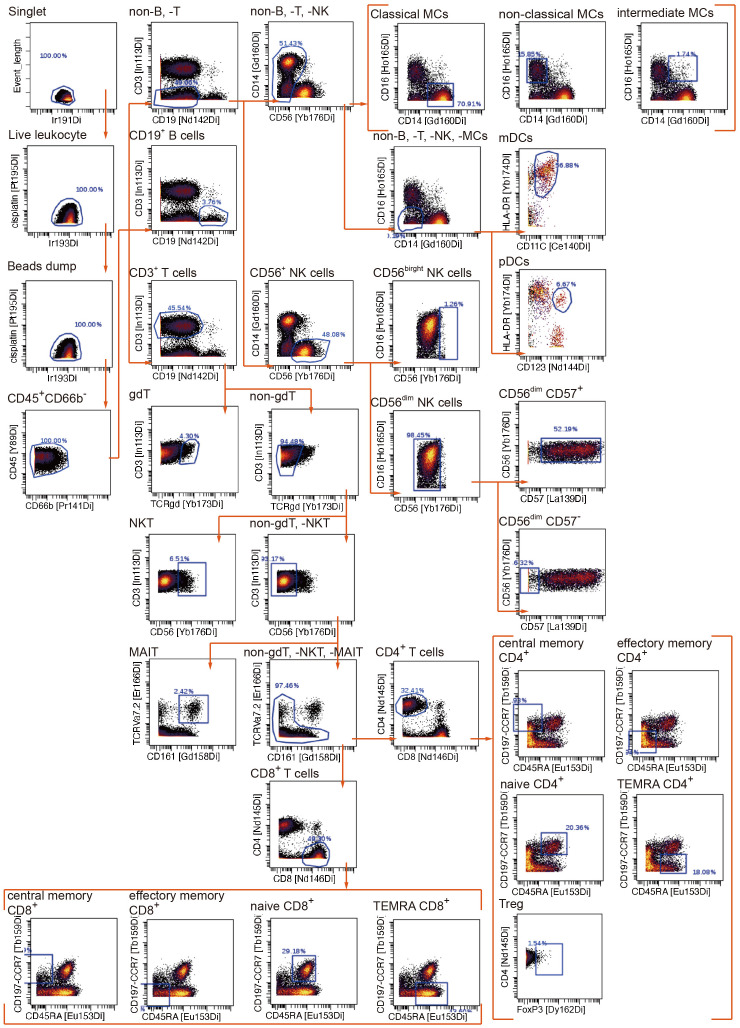
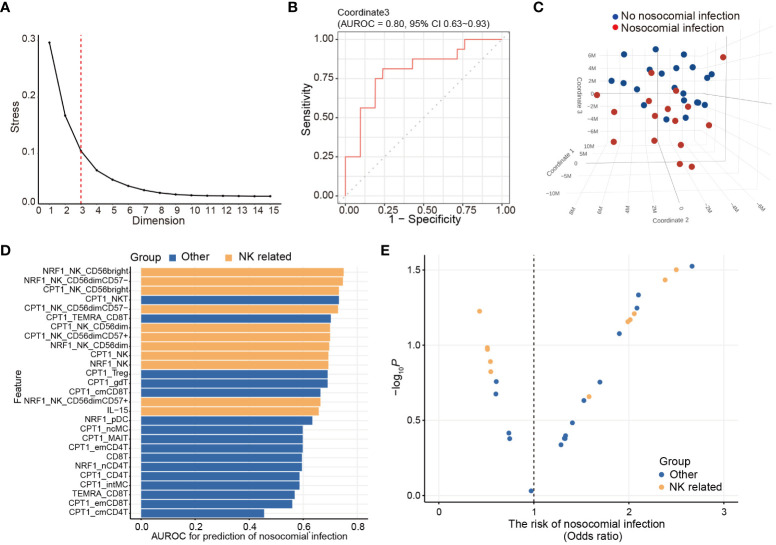
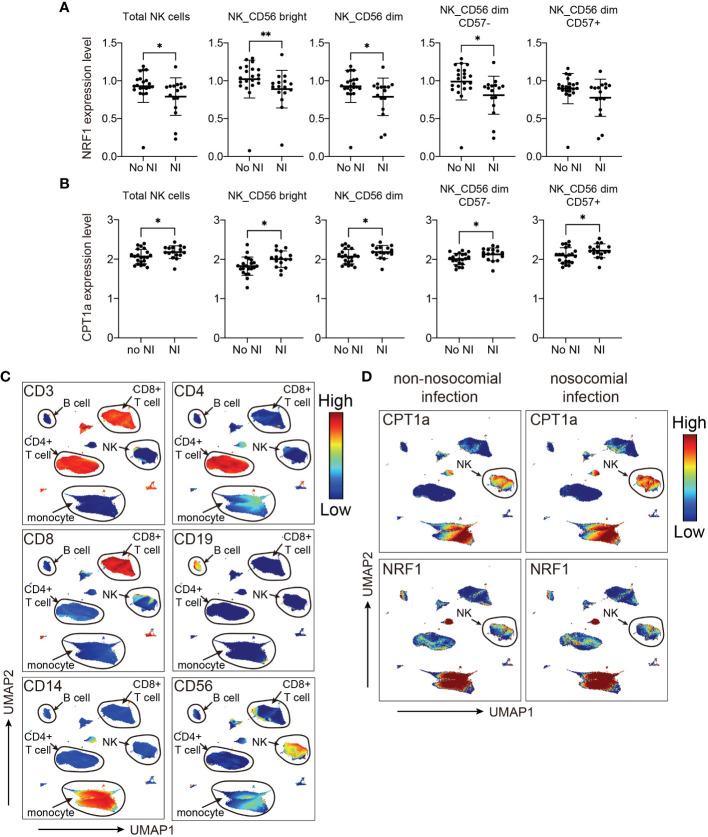
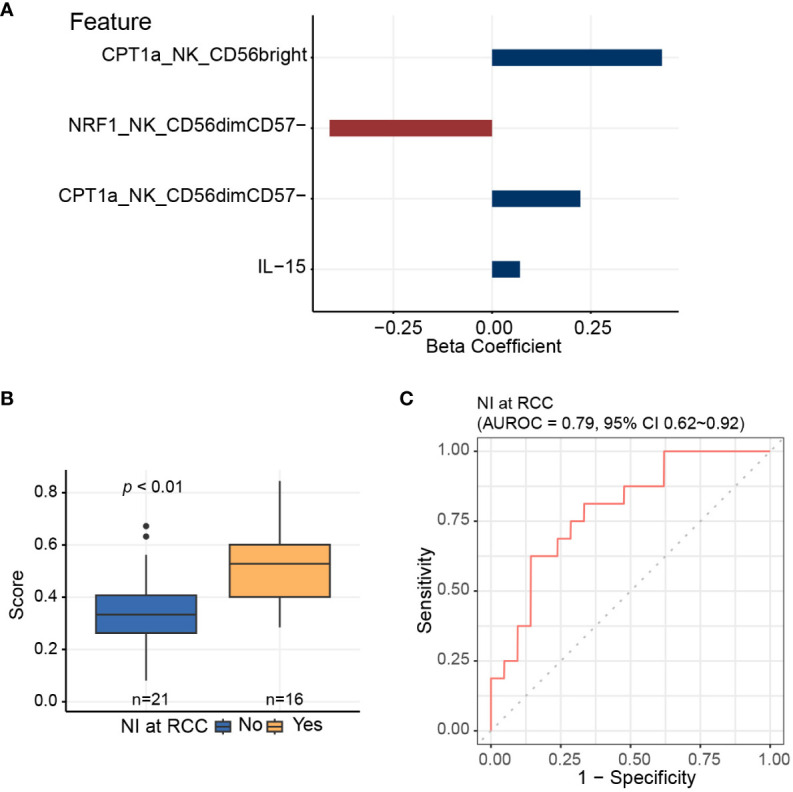
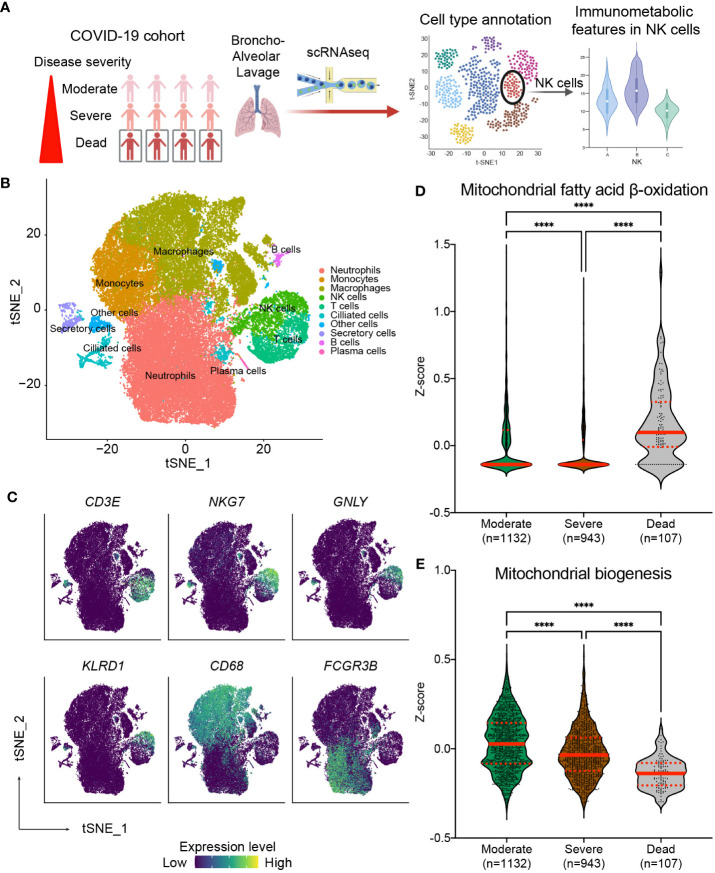
Immunosuppression increases the risk of nosocomial infection in patients with chronic critical illness. This exploratory study aimed to determine the immunometabolic signature associated with nosocomial infection during chronic critical illness. We prospectively recruited patients who were admitted to the respiratory care center and who had received mechanical ventilator support for more than 10 days in the intensive care unit. The study subjects were followed for the occurrence of nosocomial infection until 6 weeks after admission, hospital discharge, or death. The cytokine levels in the plasma samples were measured. Single-cell immunometabolic regulome profiling by mass cytometry, which analyzed 16 metabolic regulators in 21 immune subsets, was performed to identify immunometabolic features associated with the risk of nosocomial infection. During the study period, 37 patients were enrolled, and 16 patients (43.2%) developed nosocomial infection. Unsupervised immunologic clustering using multidimensional scaling and logistic regression analyses revealed that expression of nuclear respiratory factor 1 (NRF1) and carnitine palmitoyltransferase 1a (CPT1a), key regulators of mitochondrial biogenesis and fatty acid transport, respectively, in natural killer (NK) cells was significantly associated with nosocomial infection. Downregulated NRF1 and upregulated CPT1a were found in all subsets of NK cells from patients who developed a nosocomial infection. The risk of nosocomial infection is significantly correlated with the predictive score developed by selecting NK cell-specific features using an elastic net algorithm. Findings were further examined in an independent cohort of COVID-19-infected patients, and the results confirm that COVID-19-related mortality is significantly associated with mitochondria biogenesis and fatty acid oxidation pathways in NK cells. In conclusion, this study uncovers that NK cell-specific immunometabolic features are significantly associated with the occurrence and fatal outcomes of infection in critically ill population, and provides mechanistic insights into NK cell-specific immunity against microbial invasion in critical illness.
Keywords: CPT1a; NRF1; chronic critical illness; metabolism; natural killer cells; nosocomial infection.
Copyright © 2024 Chung, Su, Wang, Budiarto, Yeh, Cheng, Keng, Chen, Lu, Juan, Nakahira, Ruan, Chien, Chang, Jerng, Huang, Chen and Yu.
Conflict of interest statement
The authors declare that the research was conducted in the absence of any commercial or financial relationships that could be construed as a potential conflict of interest.
Figures
Similar articles
-
Natural killer cell deficiency experiences higher risk of sepsis after critical intracerebral hemorrhage.Int J Immunopathol Pharmacol. 2021 Jan-Dec;35:20587384211056495. doi: 10.1177/20587384211056495. Int J Immunopathol Pharmacol. 2021. PMID: 34931551 Free PMC article.
-
Fatty acid oxidation fuels natural killer cell responses against infection and cancer.Proc Natl Acad Sci U S A. 2024 Mar 12;121(11):e2319254121. doi: 10.1073/pnas.2319254121. Epub 2024 Mar 5. Proc Natl Acad Sci U S A. 2024. PMID: 38442180 Free PMC article.
-
Comparison of clinical outcomes in critically ill COVID-19 patients on mechanical ventilation with nosocomial pneumonia between Alpha and Omicron variants.Ther Adv Respir Dis. 2023 Jan-Dec;17:17534666231213642. doi: 10.1177/17534666231213642. Ther Adv Respir Dis. 2023. PMID: 38018405 Free PMC article.
-
A nearly fatal primary Epstein-Barr virus infection associated with low NK-cell counts in a patient receiving azathioprine: a case report and review of literature.BMC Infect Dis. 2019 May 10;19(1):404. doi: 10.1186/s12879-019-4022-3. BMC Infect Dis. 2019. PMID: 31077135 Free PMC article. Review.
-
Convalescent plasma or hyperimmune immunoglobulin for people with COVID-19: a rapid review.Cochrane Database Syst Rev. 2020 May 14;5(5):CD013600. doi: 10.1002/14651858.CD013600. Cochrane Database Syst Rev. 2020. Update in: Cochrane Database Syst Rev. 2020 Jul 10;7:CD013600. doi: 10.1002/14651858.CD013600.pub2. PMID: 32406927 Free PMC article. Updated.
Cited by
-
Definitions, epidemiology, and outcomes of persistent/chronic critical illness: a scoping review for translation to clinical practice.Crit Care. 2024 Dec 28;28(1):435. doi: 10.1186/s13054-024-05215-4. Crit Care. 2024. PMID: 39731183 Free PMC article.
-
Unique lymphocyte transcriptomic profiles in septic patients with chronic critical illness.Front Immunol. 2024 Dec 3;15:1478471. doi: 10.3389/fimmu.2024.1478471. eCollection 2024. Front Immunol. 2024. PMID: 39691721 Free PMC article.
-
Single-cell signaling network profiling during redox stress reveals dynamic redox regulation in immune cells.Nat Commun. 2025 Jul 1;16(1):5600. doi: 10.1038/s41467-025-60727-z. Nat Commun. 2025. PMID: 40593569 Free PMC article.
References
-
- Iwashyna TJ, Hodgson CL, Pilcher D, Bailey M, van Lint A, Chavan S, et al. . Timing of onset and burden of persistent critical illness in Australia and New Zealand: a retrospective, population-based, observational study. Lancet Respir Med (2016) 4(7):566–73. doi: 10.1016/S2213-2600(16)30098-4 - DOI - PubMed
Publication types
MeSH terms
Substances
LinkOut - more resources
Full Text Sources
Medical