

Multiscale transport and 4D time-lapse imaging in precision-cut liver slices (PCLS)
- PMID: 38426134
- PMCID: PMC10903333
- DOI: 10.7717/peerj.16994
Multiscale transport and 4D time-lapse imaging in precision-cut liver slices (PCLS)
Abstract
Background: Monitoring cellular processes across different levels of complexity, from the cellular to the tissue scale, is important for understanding tissue structure and function. However, it is challenging to monitor and estimate these structural and dynamic interactions within three-dimensional (3D) tissue models.
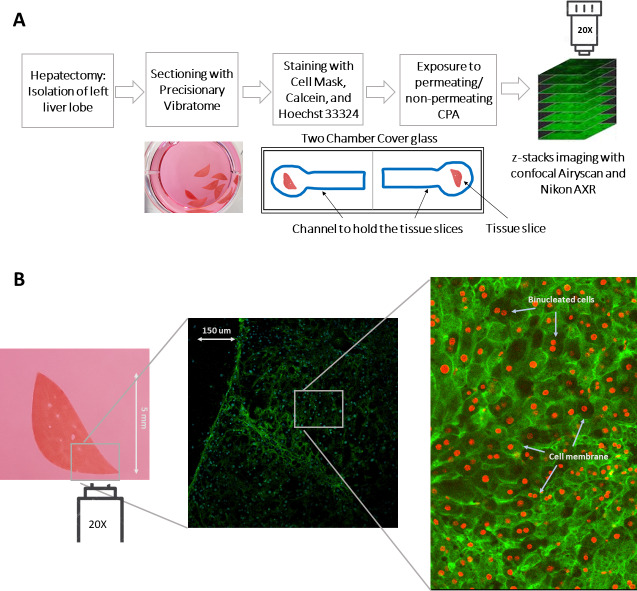
Objective: The aim of this study was to design a method for imaging, tracking, and quantifying 3D changes in cell morphology (shape and size) within liver tissue, specifically a precision-cut liver slice (PCLS). A PCLS is a 3D model of the liver that allows the study of the structure and function of liver cells in their native microenvironment.
Methods: Here, we present a method for imaging liver tissue during anisosmotic exposure in a multispectral four-dimensional manner. Three metrics of tissue morphology were measured to quantify the effects of osmotic stress on liver tissue. We estimated the changes in the volume of whole precision cut liver slices, quantified the changes in nuclei position, and calculated the changes in volumetric responses of tissue-embedded cells.
Results: During equilibration with cell-membrane-permeating and non-permeating solutes, the whole tissue experiences shrinkage and expansion. As nuclei showed a change in position and directional displacement under osmotic stress, we demonstrate that nuclei could be used as a probe to measure local osmotic and mechanical stress. Moreover, we demonstrate that cells change their volume within tissue slices as a result of osmotic perturbation and that this change in volume is dependent on the position of the cell within the tissue and the duration of the exposure.
Conclusion: The results of this study have implications for a better understanding of multiscale transport, mechanobiology, and triggered biological responses within complex biological structures.
Keywords: Cryopreservation; Hepatocyte; Image analysis; Mechanobiology; Multiscale modeling; Nuclear displacement; Osmotic stress; Permeating solute; Precision cut liver slices (PCLS); Three-dimensional imaging.
©2024 Azam and Benson.
Conflict of interest statement
The authors declare there are no competing interests.
Figures


Similar articles
-
Effects of cryoprotectant addition and washout methods on the viability of precision-cut liver slices.Cryobiology. 2012 Dec;65(3):179-87. doi: 10.1016/j.cryobiol.2012.05.011. Epub 2012 Jun 18. Cryobiology. 2012. PMID: 22722061
-
High precision-cut liver slice model to study cell-autonomous antiviral defense of hepatocytes within their microenvironment.JHEP Rep. 2022 Mar 6;4(5):100465. doi: 10.1016/j.jhepr.2022.100465. eCollection 2022 May. JHEP Rep. 2022. PMID: 35462860 Free PMC article.
-
Role of apoptotic signaling pathway in metabolic disturbances occurring in liver tissue after cryopreservation: Study on rat precision-cut liver slices.Life Sci. 2006 Feb 28;78(14):1570-7. doi: 10.1016/j.lfs.2005.07.036. Epub 2005 Oct 19. Life Sci. 2006. PMID: 16236333
-
Applications and Approaches for Three-Dimensional Precision-Cut Lung Slices. Disease Modeling and Drug Discovery.Am J Respir Cell Mol Biol. 2020 Jun;62(6):681-691. doi: 10.1165/rcmb.2019-0276TR. Am J Respir Cell Mol Biol. 2020. PMID: 31991090 Free PMC article. Review.
-
Best Practices and Progress in Precision-Cut Liver Slice Cultures.Int J Mol Sci. 2021 Jul 1;22(13):7137. doi: 10.3390/ijms22137137. Int J Mol Sci. 2021. PMID: 34281187 Free PMC article. Review.
Cited by
-
Cold storage of human precision-cut lung slices in TiProtec preserves cellular composition and transcriptional responses and enables on-demand mechanistic studies.Respir Res. 2025 Feb 17;26(1):57. doi: 10.1186/s12931-025-03132-w. Respir Res. 2025. PMID: 39962456 Free PMC article.
References
-
- An P, Wei LL, Zhao S, Sverdlov DY, Vaid KA, Miyamoto M, Kuramitsu K, Lai M, Popov YV. Hepatocyte mitochondria-derived danger signals directly activate hepatic stellate cells and drive progression of liver fibrosis. Nature Communications. 2020;11(1):1–15. doi: 10.1038/s41467-020-16092-0. - DOI - PMC - PubMed
-
- Benson J, Macklin P. 43, Cell-based modeling of mechanical and chemical stress in tissues during cryoprotocols. Cryobiology. 2015;71(1):176. doi: 10.1016/J.CRYOBIOL.2015.05.049. - DOI
MeSH terms
LinkOut - more resources
Full Text Sources
Research Materials
