

TICI: a taxon-independent community index for eDNA-based ecological health assessment
- PMID: 38426140
- PMCID: PMC10903356
- DOI: 10.7717/peerj.16963
TICI: a taxon-independent community index for eDNA-based ecological health assessment
Abstract
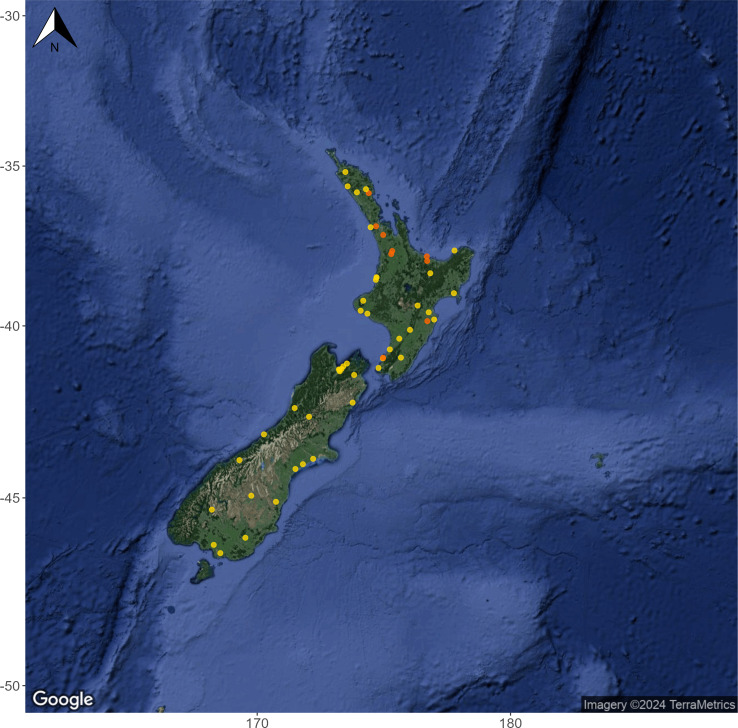
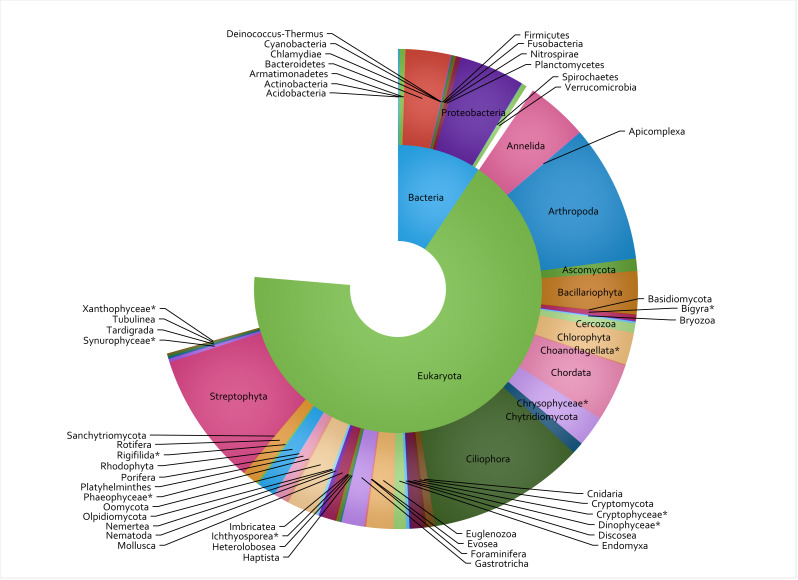
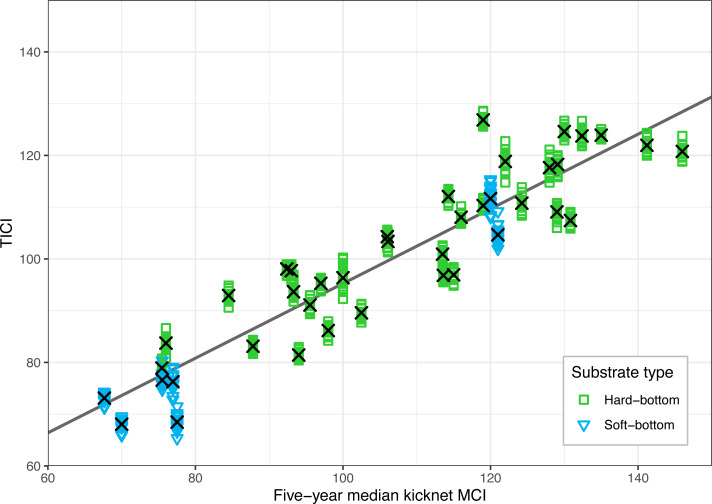
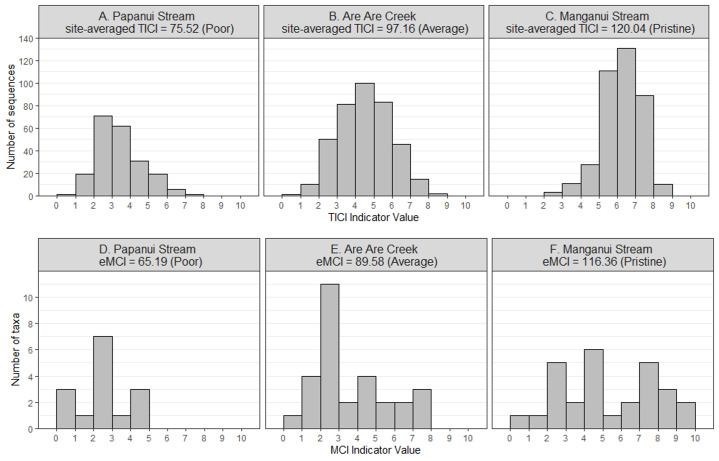
Global biodiversity is declining at an ever-increasing rate. Yet effective policies to mitigate or reverse these declines require ecosystem condition data that are rarely available. Morphology-based bioassessment methods are difficult to scale, limited in scope, suffer prohibitive costs, require skilled taxonomists, and can be applied inconsistently between practitioners. Environmental DNA (eDNA) metabarcoding offers a powerful, reproducible and scalable solution that can survey across the tree-of-life with relatively low cost and minimal expertise for sample collection. However, there remains a need to condense the complex, multidimensional community information into simple, interpretable metrics of ecological health for environmental management purposes. We developed a riverine taxon-independent community index (TICI) that objectively assigns indicator values to amplicon sequence variants (ASVs), and significantly improves the statistical power and utility of eDNA-based bioassessments. The TICI model training step uses the Chessman iterative learning algorithm to assign health indicator scores to a large number of ASVs that are commonly encountered across a wide geographic range. New sites can then be evaluated for ecological health by averaging the indicator value of the ASVs present at the site. We trained a TICI model on an eDNA dataset from 53 well-studied riverine monitoring sites across New Zealand, each sampled with a high level of biological replication (n = 16). Eight short-amplicon metabarcoding assays were used to generate data from a broad taxonomic range, including bacteria, microeukaryotes, fungi, plants, and animals. Site-specific TICI scores were strongly correlated with historical stream condition scores from macroinvertebrate assessments (macroinvertebrate community index or MCI; R2 = 0.82), and TICI variation between sample replicates was minimal (CV = 0.013). Taken together, this demonstrates the potential for taxon-independent eDNA analysis to provide a reliable, robust and low-cost assessment of ecological health that is accessible to environmental managers, decision makers, and the wider community.
Keywords: Biodiversity; Biotic index; Ecological health; Ecology; Taxon-independent analysis; eDNA.
©2024 Wilkinson et al.
Conflict of interest statement
Shaun P. Wilkinson, Amy A. Gault and Susan A. Welsh are current employees of Wilderlab NZ Ltd., a commercial eDNA processing laboratory. Megan Shaffer was employed by Wilderlab NZ Ltd. during the course of this study. Joshua P. Smith is an employee of Waikato Regional Council, Hamilton, New Zealand. Bruno O. David was employed by Waikato Regional Council, Hamilton, New Zealand, during the course of this study. Andy S. Hicks is currently employed by the Ministry for the Environment, Wellington, New Zealand, and was employed by Hawke’s Bay Regional Council, Napier, New Zealand, during the course of this study. Daniel R. Fake was employed by Hawke’s Bay Regional Council, Napier, New Zealand, during the course of this study. Alastair M Suren is employed by Bay of Plenty Regional Council, Whakatāne, New Zealand.
Figures
Similar articles
-
An integrated spatio-temporal view of riverine biodiversity using environmental DNA metabarcoding.Nat Commun. 2024 May 23;15(1):4372. doi: 10.1038/s41467-024-48640-3. Nat Commun. 2024. PMID: 38782932 Free PMC article.
-
Cost-effort analysis of Baited Remote Underwater Video (BRUV) and environmental DNA (eDNA) in monitoring marine ecological communities.PeerJ. 2024 Apr 30;12:e17091. doi: 10.7717/peerj.17091. eCollection 2024. PeerJ. 2024. PMID: 38708339 Free PMC article.
-
Quantitative environmental DNA metabarcoding shows high potential as a novel approach to quantitatively assess fish community.Sci Rep. 2022 Dec 13;12(1):21524. doi: 10.1038/s41598-022-25274-3. Sci Rep. 2022. PMID: 36513686 Free PMC article.
-
Fishing for fish environmental DNA: Ecological applications, methodological considerations, surveying designs, and ways forward.Mol Ecol. 2022 Oct;31(20):5132-5164. doi: 10.1111/mec.16659. Epub 2022 Sep 1. Mol Ecol. 2022. PMID: 35972241 Review.
-
Exploitation of environmental DNA (eDNA) for ecotoxicological research: A critical review on eDNA metabarcoding in assessing marine pollution.Chemosphere. 2024 Mar;351:141238. doi: 10.1016/j.chemosphere.2024.141238. Epub 2024 Jan 17. Chemosphere. 2024. PMID: 38242519 Review.
Cited by
-
Targeted eDNA Metabarcoding Reveals New Populations of a Range-Limited Stonefly.Ecol Evol. 2025 Apr 3;15(4):e71244. doi: 10.1002/ece3.71244. eCollection 2025 Apr. Ecol Evol. 2025. PMID: 40190802 Free PMC article.
-
Advancing the environmental DNA and RNA toolkit for aquatic ecosystem monitoring and management.PeerJ. 2025 Mar 18;13:e19119. doi: 10.7717/peerj.19119. eCollection 2025. PeerJ. 2025. PMID: 40124618 Free PMC article.
-
Observation Bias in Metabarcoding.Mol Ecol Resour. 2025 Oct;25(7):e14119. doi: 10.1111/1755-0998.14119. Epub 2025 May 15. Mol Ecol Resour. 2025. PMID: 40375355 Free PMC article.
References
-
- Berry O, Jarman S, Bissett A, Hope M, Paeper C, Bessey C, Schwartz MK, Hale J, Bunce M. Making environmental DNA (eDNA) biodiversity records globally accessible. Environmental DNA. 2021;3:699–705. doi: 10.1002/edn3.173. - DOI
MeSH terms
Substances
LinkOut - more resources
Full Text Sources
