

Mathematical modelling of antibiotic interaction on evolution of antibiotic resistance: an analytical approach
- PMID: 38426146
- PMCID: PMC10903357
- DOI: 10.7717/peerj.16917
Mathematical modelling of antibiotic interaction on evolution of antibiotic resistance: an analytical approach
Abstract
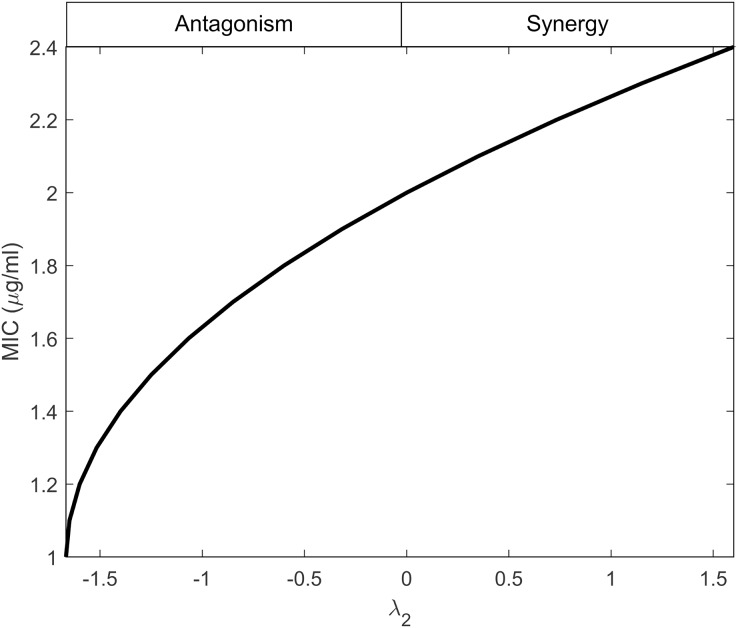
Background: The emergence and spread of antibiotic-resistant pathogens have led to the exploration of antibiotic combinations to enhance clinical effectiveness and counter resistance development. Synergistic and antagonistic interactions between antibiotics can intensify or diminish the combined therapy's impact. Moreover, these interactions can evolve as bacteria transition from wildtype to mutant (resistant) strains. Experimental studies have shown that the antagonistically interacting antibiotics against wildtype bacteria slow down the evolution of resistance. Interestingly, other studies have shown that antibiotics that interact antagonistically against mutants accelerate resistance. However, it is unclear if the beneficial effect of antagonism in the wildtype bacteria is more critical than the detrimental effect of antagonism in the mutants. This study aims to illuminate the importance of antibiotic interactions against wildtype bacteria and mutants on the deacceleration of antimicrobial resistance.
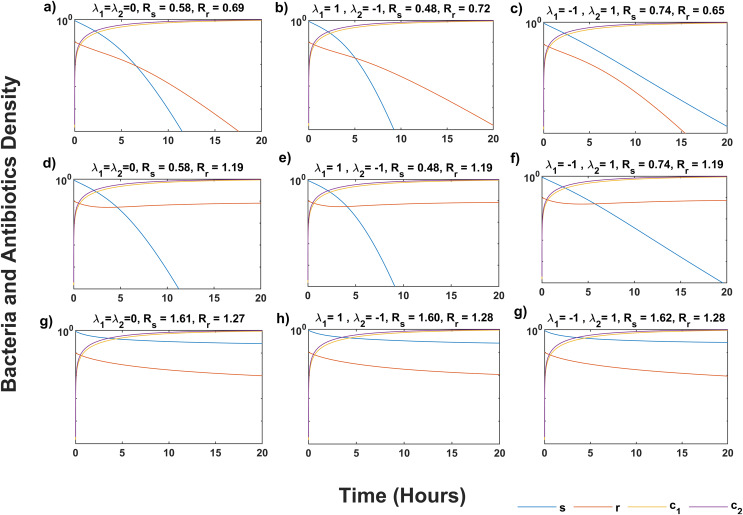
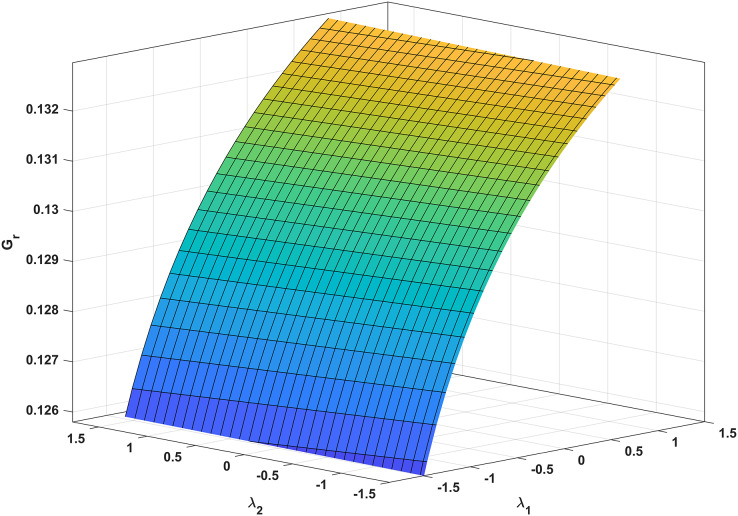
Methods: To address this, we developed and analyzed a mathematical model that explores the population dynamics of wildtype and mutant bacteria under the influence of interacting antibiotics. The model investigates the relationship between synergistic and antagonistic antibiotic interactions with respect to the growth rate of mutant bacteria acquiring resistance. Stability analysis was conducted for equilibrium points representing bacteria-free conditions, all-mutant scenarios, and coexistence of both types. Numerical simulations corroborated the analytical findings, illustrating the temporal dynamics of wildtype and mutant bacteria under different combination therapies.
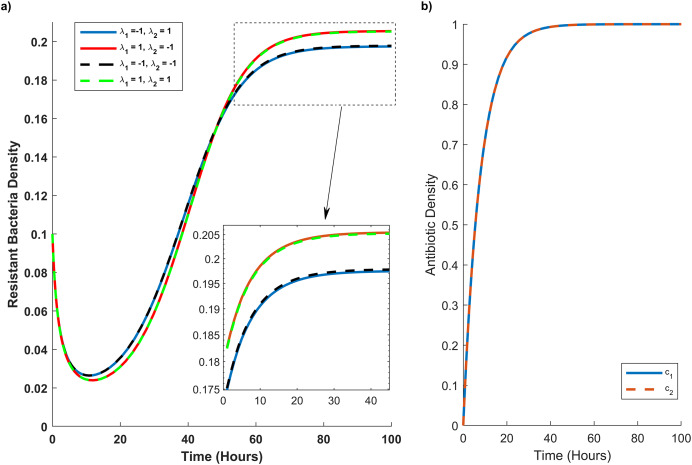
Results: Our analysis provides analytical clarification and numerical validation that antibiotic interactions against wildtype bacteria exert a more significant effect on reducing the rate of resistance development than interactions against mutants. Specifically, our findings highlight the crucial role of antagonistic antibiotic interactions against wildtype bacteria in slowing the growth rate of resistant mutants. In contrast, antagonistic interactions against mutants only marginally affect resistance evolution and may even accelerate it.
Conclusion: Our results emphasize the importance of considering the nature of antibiotic interactions against wildtype bacteria rather than mutants when aiming to slow down the acquisition of antibiotic resistance.
Keywords: Antibiotic; Antibiotic interaction; Differential equation; Equilibrium solutions.
© 2024 Nashebi et al.
Conflict of interest statement
The authors declare that they have no competing interests.
Figures
Similar articles
-
Within-species variability of antibiotic interactions in Gram-negative bacteria.mBio. 2024 Mar 13;15(3):e0019624. doi: 10.1128/mbio.00196-24. Epub 2024 Feb 23. mBio. 2024. PMID: 38391196 Free PMC article.
-
Exploring synergistic and antagonistic interactions in phage-antibiotic combinations against ESKAPE pathogens.Microbiol Spectr. 2024 Oct 3;12(10):e0042724. doi: 10.1128/spectrum.00427-24. Epub 2024 Jul 31. Microbiol Spectr. 2024. PMID: 39082827 Free PMC article.
-
Multi-step vs. single-step resistance evolution under different drugs, pharmacokinetics, and treatment regimens.Elife. 2021 May 18;10:e64116. doi: 10.7554/eLife.64116. Elife. 2021. PMID: 34001313 Free PMC article.
-
Antibiotic resistant bacteria: current situation and treatment options to accelerate the development of a new antimicrobial arsenal.Expert Rev Anti Infect Ther. 2022 Aug;20(8):1095-1108. doi: 10.1080/14787210.2022.2078308. Epub 2022 May 31. Expert Rev Anti Infect Ther. 2022. PMID: 35576494 Review.
-
Phage-antibiotic combinations: a promising approach to constrain resistance evolution in bacteria.Ann N Y Acad Sci. 2021 Jul;1496(1):23-34. doi: 10.1111/nyas.14533. Epub 2020 Nov 11. Ann N Y Acad Sci. 2021. PMID: 33175408 Review.
References
MeSH terms
Substances
LinkOut - more resources
Full Text Sources
Medical
