

Optimizing the measurement of sample entropy in resting-state fMRI data
- PMID: 38426165
- PMCID: PMC10902163
- DOI: 10.3389/fneur.2024.1331365
Optimizing the measurement of sample entropy in resting-state fMRI data
Abstract
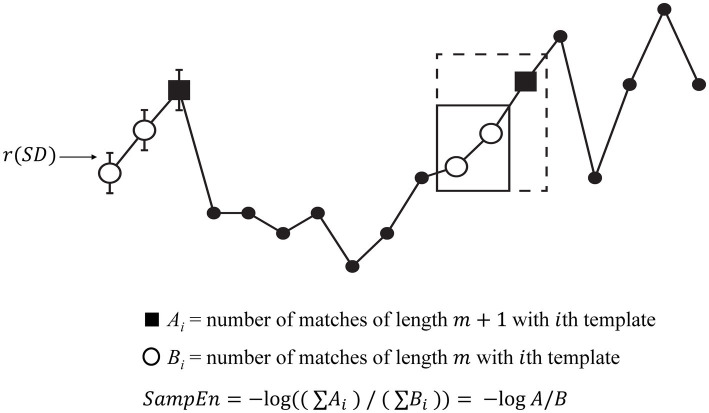
Introduction: The complexity of brain signals may hold clues to understand brain-based disorders. Sample entropy, an index that captures the predictability of a signal, is a promising tool to measure signal complexity. However, measurement of sample entropy from fMRI signals has its challenges, and numerous questions regarding preprocessing and parameter selection require research to advance the potential impact of this method. For one example, entropy may be highly sensitive to the effects of motion, yet standard approaches to addressing motion (e.g., scrubbing) may be unsuitable for entropy measurement. For another, the parameters used to calculate entropy need to be defined by the properties of data being analyzed, an issue that has frequently been ignored in fMRI research. The current work sought to rigorously address these issues and to create methods that could be used to advance this field.
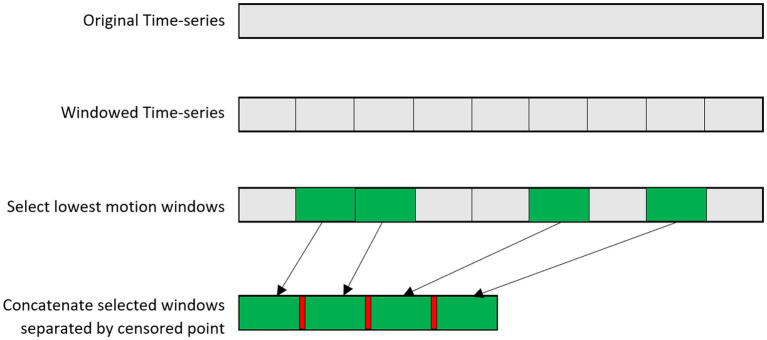
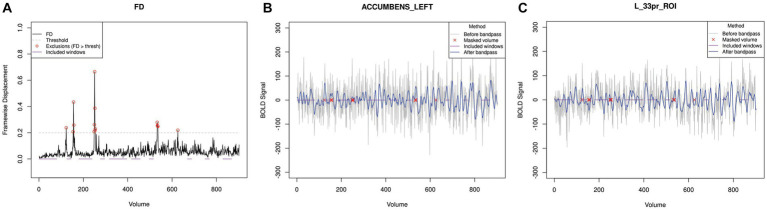
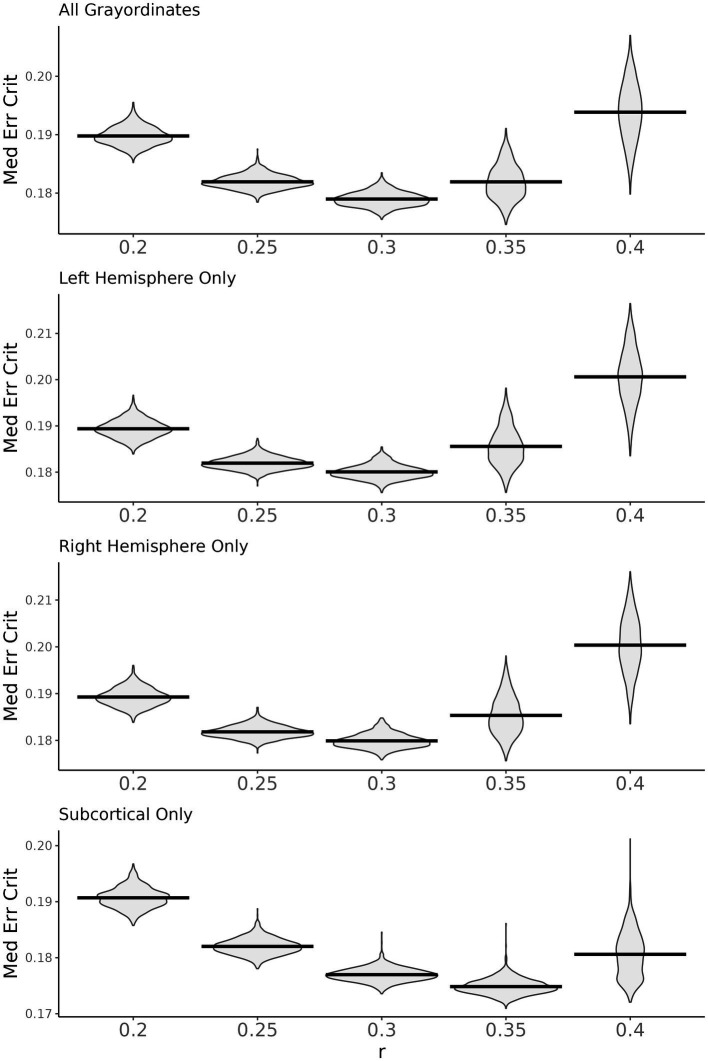
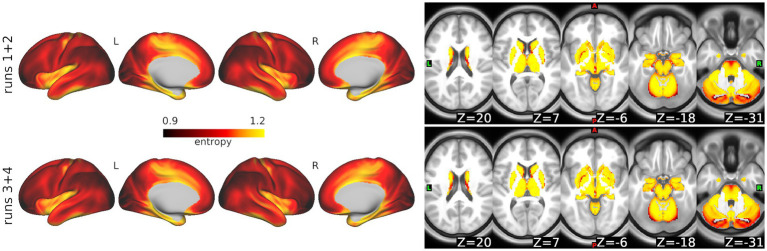
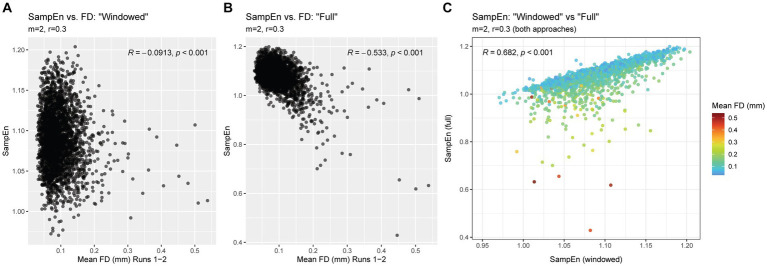
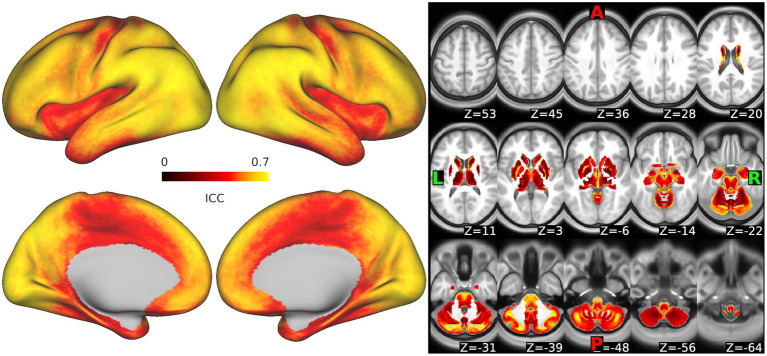
Methods: We developed and tested a novel windowing approach to select and concatenate (ignoring connecting volumes) low-motion windows in fMRI data to reduce the impact of motion on sample entropy estimates. We created utilities (implementing autoregressive models and a grid search function) to facilitate selection of the matching length m parameter and the error tolerance r parameter. We developed an approach to apply these methods at every grayordinate of the brain, creating a whole-brain dense entropy map. These methods and tools have been integrated into a publicly available R package ("powseR"). We demonstrate these methods using data from the ABCD study. After applying the windowing procedure to allow sample entropy calculation on the lowest-motion windows from runs 1 and 2 (combined) and those from runs 3 and 4 (combined), we identified the optimal m and r parameters for these data. To confirm the impact of the windowing procedure, we compared entropy values and their relationship with motion when entropy was calculated using the full set of data vs. those calculated using the windowing procedure. We then assessed reproducibility of sample entropy calculations using the windowed procedure by calculating the intraclass correlation between the earlier and later entropy measurements at every grayordinate.
Results: When applying these optimized methods to the ABCD data (from the subset of individuals who had enough windows of continuous "usable" volumes), we found that the novel windowing procedure successfully mitigated the large inverse correlation between entropy values and head motion seen when using a standard approach. Furthermore, using the windowed approach, entropy values calculated early in the scan (runs 1 and 2) are largely reproducible when measured later in the scan (runs 3 and 4), although there is some regional variability in reproducibility.
Discussion: We developed an optimized approach to measuring sample entropy that addresses concerns about motion and that can be applied across datasets through user-identified adaptations that allow the method to be tailored to the dataset at hand. We offer preliminary results regarding reproducibility. We also include recommendations for fMRI data acquisition to optimize sample entropy measurement and considerations for the field.
Keywords: R software; brain dynamics; complexity; fMRI; sample entropy (SampEn).
Copyright © 2024 Roediger, Butts, Falke, Fiecas, Klimes-Dougan, Mueller and Cullen.
Conflict of interest statement
The authors declare that the research was conducted in the absence of any commercial or financial relationships that could be construed as a potential conflict of interest.
Figures
Similar articles
-
A Strategy to Reduce Bias of Entropy Estimates in Resting-State fMRI Signals.Front Neurosci. 2018 Jun 13;12:398. doi: 10.3389/fnins.2018.00398. eCollection 2018. Front Neurosci. 2018. PMID: 29950971 Free PMC article.
-
Temporal complexity of fMRI is reproducible and correlates with higher order cognition.Neuroimage. 2021 Apr 15;230:117760. doi: 10.1016/j.neuroimage.2021.117760. Epub 2021 Jan 22. Neuroimage. 2021. PMID: 33486124
-
Fuzzy approximate entropy analysis of resting state fMRI signal complexity across the adult life span.Med Eng Phys. 2015 Nov;37(11):1082-90. doi: 10.1016/j.medengphy.2015.09.001. Epub 2015 Oct 21. Med Eng Phys. 2015. PMID: 26475494
-
[Standard technical specifications for methacholine chloride (Methacholine) bronchial challenge test (2023)].Zhonghua Jie He He Hu Xi Za Zhi. 2024 Feb 12;47(2):101-119. doi: 10.3760/cma.j.cn112147-20231019-00247. Zhonghua Jie He He Hu Xi Za Zhi. 2024. PMID: 38309959 Chinese.
-
Revamping information entropy: A tailored metric for pre-evaluating quality of 2D analytical signal - A tutorial.Anal Chim Acta. 2025 Mar 22;1344:343693. doi: 10.1016/j.aca.2025.343693. Epub 2025 Jan 24. Anal Chim Acta. 2025. PMID: 39984219 Review.
Cited by
-
A longitudinal study of functional brain complexity in progressive Alzheimer's disease.Alzheimers Dement (Amst). 2025 Jan 16;17(1):e70059. doi: 10.1002/dad2.70059. eCollection 2025 Jan-Mar. Alzheimers Dement (Amst). 2025. PMID: 39822290 Free PMC article.
-
Elucidating distinct and common fMRI-complexity patterns in pre-adolescent children with Attention-Deficit/Hyperactivity Disorder, Oppositional Defiant Disorder, and Obsessive-Compulsive Disorder diagnoses.medRxiv [Preprint]. 2025 Jan 18:2025.01.17.25320748. doi: 10.1101/2025.01.17.25320748. medRxiv. 2025. PMID: 39867408 Free PMC article. Preprint.
References
LinkOut - more resources
Full Text Sources