. 2024 Aug;57(8):e13626.
doi: 10.1111/cpr.13626. Epub 2024 Mar 1.

NEK2 plays an essential role in porcine embryonic development by maintaining mitotic division and DNA damage response via the Wnt/β-catenin signalling pathway

Affiliations

NEK2 plays an essential role in porcine embryonic development by maintaining mitotic division and DNA damage response via the Wnt/β-catenin signalling pathway

Se-Been Jeon et al. Cell Prolif. 2024 Aug.

Abstract

NIMA-related kinase 2 (NEK2) is a serine/threonine protein kinase that regulates mitosis and plays pivotal roles in cell cycle regulation and DNA damage repair. However, its function in porcine embryonic development is unknown. In this study, we used an NEK2-specific inhibitor, JH295 (JH), to investigate the role of NEK2 in embryonic development and the underlying regulatory mechanisms. Inhibition of NEK2 after parthenogenesis activation or in vitro fertilization significantly reduced the rates of cleavage and blastocyst formation, the numbers of trophectoderm and total cells and the cellular survival rate compared with the control condition. NEK2 inhibition delayed cell cycle progression at all stages from interphase to cytokinesis during the first mitotic division; it caused abnormal nuclear morphology in two- and four-cell stage embryos. Additionally, NEK2 inhibition significantly increased DNA damage and apoptosis, and it altered the expression levels of DNA damage repair- and apoptosis-related genes. Intriguingly, NEK2 inhibition downregulated the expression of β-catenin and its downstream target genes. To validate the relationship between Wnt/β-catenin signalling and NEK2 during porcine embryonic development, we cultured porcine embryos in JH-treated medium with or without CHIR99021, a Wnt activator. CHIR99021 co-treatment strongly restored the developmental parameters reduced by NEK2 inhibition to control levels. Our findings suggest that NEK2 plays an essential role in porcine embryonic development by regulating DNA damage repair and normal mitotic division via the Wnt/β-catenin signalling pathway.


Conflict of interest statement

The authors declare no conflicts of interest.

Figures

FIGURE 1
FIGURE 1
Subcellular localization and expression pattern of NIMA‐related kinase 2 (NEK2) in porcine embryogenesis. (A) Subcellular localization of NEK2 in porcine embryos at various stages. Bar = 100 μm. (B) Representative images of NEK2 Western blotting results and (C) quantification of NEK2 band intensity (n = 3 per group). Data are derived from at least three independent experiments; different superscripts indicate significant differences (p < 0.05). 1C, one‐cell stage; 2C, two‐cell stage; 4C, four‐cell stage; BL, blastocyst stage; Mor, morula stage.
FIGURE 2
FIGURE 2
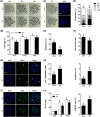
Effects of NEK2 inhibition during porcine parthenogenetic activation (PA) embryo development. (A) Representative images of cleavage and (B) cleavage rates of porcine PA embryos at 24, 30 and 48 h in the indicated groups (0; n = 200, 1; n = 200, 2; n = 200, 3; n = 199). Bar = 200 μm. (C) Representative bright‐field images of embryos (upper, Bar = 200 μm) and nuclear‐stained images (lower, Bar = 50 μm) of blastocysts in the indicated groups. (D) Blastocyst formation rates in the indicated groups (0; n = 200, 1; n = 200, 2; n = 200, 3; n = 199). (E) Proportions of various blastocyst stages in the indicated groups (0; n = 66, 1; n = 58, 2; n = 25, 3; n = 14). (F) Total cell numbers in the indicated groups (n = 24 per group). (G) Representative images of NEK2 Western blotting results and (H) quantification of NEK2 band intensity in the indicated groups (n = 3 per group). (I) qRT‐PCR results for transcript levels of NEK2 genes in the indicated groups (n = 3 per group). Data are derived from at least three independent experiments; different superscripts indicate significant differences (P < 0.05). 4C, four‐cell stage; BL, blastocyst stage.
FIGURE 3
FIGURE 3
Effects of NEK2 inhibition on porcine PA blastocyst quality. (A) Representative images of TdT‐mediated dUTP nick‐end labelling (TUNEL) of blastocysts (Bar = 50 μm). Embryos were subjected to TUNEL staining (green, white arrow) and nuclear staining (blue). (B) Quantification of the number (left) and proportion (right) of apoptotic cells in the indicated groups (n = 50 per group). (C) qRT‐PCR results for transcript levels of apoptosis‐related genes and BAX/BCL‐XL ratio in blastocysts (n = 5 per group). (D) Representative images of CDX2 staining of blastocysts (Bar = 50 μm). (E) Numbers of inner cell mass (ICM), trophectoderm (TE), and total cells (left), as well as ICM/TE ratios (right), in the indicated groups (n = 40 per group). (F) qRT‐PCR results for transcript levels of developmental potential‐related genes in blastocysts (n = 5 per group). Data are derived from at least three independent experiments; different superscripts indicate significant differences (P < 0.05).
FIGURE 4
FIGURE 4
Effects of NEK2 inhibition on blastocyst development and quality among porcine in vitro fertilization (IVF) embryos. (A) Representative images of cleavage and (B) cleavage rates of porcine IVF embryos at 24, 30 and 48 h in the indicated groups (Con; n = 141, JH; n = 142). (C) Representative bright‐field images of embryos (left, Bar = 200 μm) and nuclear‐stained images (right, Bar = 50 μm) of blastocysts in the indicated groups. (D) Blastocyst formation rates in the indicated groups (Con; n = 141, JH; n = 142). (E) Proportions of various blastocyst stages in the indicated groups (Con; n = 49, JH; n = 25). (F) Total cell numbers in the indicated groups (n = 40 per group). (G) Representative images of TUNEL of blastocysts (Bar = 50 μm). Embryos were subjected to TUNEL staining (green, white arrow) and nuclear staining (blue). (H) Quantification of the number (left) and proportion (right) of apoptotic cells in the indicated groups (n = 47 per group). (I) Representative images of CDX2 staining of blastocysts (Bar = 50 μm). (J) Numbers of ICM, TE and total cells (left), as well as ICM/TE ratios (right), in the indicated groups (n = 33 per group). Data are derived from at least three independent experiments; different superscripts indicate significant differences (P < 0.05).
FIGURE 5
FIGURE 5
Effects of NEK2 inhibition on cell cycle progression during first mitotic division of porcine PA embryos. (A) Dynamic distribution of the cytoskeleton and nuclei at various stages of the first mitotic division in porcine embryos. Bar = 50 μm. (B) Quantification of cell cycle progression analysis during the first mitotic division in porcine embryos in the indicated groups (Con; n = 416, JH; n = 437). Data are derived from at least three independent experiments; different superscripts indicate significant differences (P < 0.05).
FIGURE 6
FIGURE 6
Evaluation of mitotic nuclear abnormalities in NEK2‐suppressed porcine PA embryos. (A) Representative images of normal or abnormal nuclear status in porcine two‐cell stage embryos. Bar = 50 μm. (B) Percentages of mononucleation in the indicated groups (Con; n = 123, JH; n = 126). (C) Percentages of abnormal nucleation in the indicated groups (Con; n = 123, JH; n = 126). (D) Representative images of normal or abnormal nuclear status in porcine four‐cell stage embryos. For details, see text. Bar = 50 μm. (E) Percentages of mononucleation in the indicated groups (Con; n = 58, JH; n = 61). (F) Percentages of abnormal nucleation in the indicated groups (Con; n = 230, JH; n = 221). Data are derived from at least three independent experiments; different superscripts indicate significant differences (P < 0.05).
FIGURE 7
FIGURE 7
Effects of NEK2 inhibition on DNA damage and early apoptosis in porcine PA embryos (A) Fluorescence images of four‐cell stage embryos stained for ataxia telangiectasia mutated (ATM) (Bar = 50 μm) and (B) quantification of ATM relative fluorescence intensity in the indicated groups (n = 36 per group). (C) qRT‐PCR results for transcript levels of DNA damage‐related genes in four‐cell stage embryos (n = 3 per group). (D) Fluorescence images of 4‐cell embryos stained for H2AX phosphorylated at Ser 139 (γ‐H2AX) (Bar = 50 μm) and (E) percentages of γ‐H2AX‐positive embryos in the indicated groups (Con; n = 48, JH; n = 50). (F) qRT‐PCR results for transcript levels of DNA damage repair‐related genes in four‐cell stage embryos (n = 3 per group). (G) Fluorescence images of four‐cell stage embryos stained for annexin‐V (Bar = 100 μm) and (H) percentages of annexin‐V‐positive embryos in the indicated groups (Con; n = 51, JH; n = 53). (I) qRT‐PCR results for transcript levels of apoptosis‐related genes (left) and BAX/BCL‐XL ratio (right) in blastocysts (n = 4 per group). Data are derived from at least three independent experiments; different superscripts indicate significant differences (P < 0.05).
FIGURE 8
FIGURE 8
Effects of NEK2 inhibition on Wnt/β‐catenin signalling pathway and cell cycle in porcine PA embryos. (A) Representative images of active‐β‐catenin and β‐catenin Western blotting results and (B) quantification of active‐β‐catenin and β‐catenin band intensity in the indicated groups (n = 3 per group). (C) qRT‐PCR results for transcript levels of Wnt/β‐catenin signalling pathway‐related genes (n = 4 per group), (D) downstream target genes (n = 3 per group) and (E) cell cycle‐related genes in the indicated groups (n = 3 per group). Data are derived from at least three independent experiments; different superscripts indicate significant differences (P < 0.05).
FIGURE 9
FIGURE 9
Role of the Wnt/β‐catenin signalling pathway in the effects of NEK2 inhibition on early development and blastocyst quality in porcine PA embryos. (A) Representative images of cleavage and (B) cleavage rates of porcine PA embryos at 24, 30 and 48 h in the indicated groups (n = 120 per group). (C) Representative bright‐field images of embryos (upper, Bar = 200 μm) and nuclear‐stained images (lower, Bar = 50 μm) of blastocysts in the indicated groups. (D) Blastocyst formation rates in the indicated groups (n = 120 per group). (E) Proportions of various blastocyst stages in the indicated groups (Con; n = 66, JH; n = 24, 0.5; n = 32, 1; n = 40, 2; n = 24). (F) Total cell numbers in the indicated groups (n = 35 per group). (G) Representative images of TUNEL staining of blastocysts (Bar = 50 μm). Embryos were subjected to TUNEL staining (green, white arrow) and nuclear staining (blue). (H) Quantification of the number (left) and proportion (right) of apoptotic cells in the indicated groups (n = 30 per group). (I) Representative images of CDX2 staining of blastocysts (Bar = 50 μm). (J) Numbers of ICM, TE and total cells (left), as well as ICM/TE ratios (right), in the indicated groups (n = 35 per group). Data are derived from at least three independent experiments; different superscripts indicate significant differences (P < 0.05).
FIGURE 10
FIGURE 10
Schematic diagram for NEK2 functions during porcine embryonic development. NEK2 plays an essential roles in normal mitotic division, DNA damage repair and cell cycle progression via the Wnt/β‐catenin signalling pathway in porcine early embryogenesis. Schematic diagram for NEK2 functions during porcine embryonic development. NEK2 plays essential roles in normal mitotic division, DNA damage repair and cell cycle progression via the Wnt/β‐catenin signalling pathway in porcine early embryogenesis.

References

    1. Sfakianoudis K, Maziotis E, Karantzali E, et al. Molecular drivers of developmental arrest in the human preimplantation embryo: a systematic review and critical analysis leading to mapping future research. Int J Mol Sci. 2021;22(15):8353. - PMC - PubMed
    1. Paonessa M, Borini A, Coticchio G. Genetic causes of preimplantation embryo developmental failure. Mol Reprod Dev. 2021;88(5):338‐348. - PubMed
    1. O'Connell MJ, Walworth NC, Carr AM. The G2‐phase DNA‐damage checkpoint. Trends Cell Biol. 2000;10(7):296‐303. - PubMed
    1. Bohgaki T, Bohgaki M, Hakem R. DNA double‐strand break signaling and human disorders. Genome Integr. 2010;1(1):15. - PMC - PubMed
    1. Myung K, Smith S, Kolodner RD. Mitotic checkpoint function in the formation of gross chromosomal rearrangements in Saccharomyces cerevisiae. Proc Natl Acad Sci U S A. 2004;101(45):15980‐15985. - PMC - PubMed

MeSH terms

LinkOut - more resources