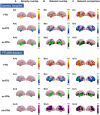
Atrophy network mapping of clinical subtypes and main symptoms in frontotemporal dementia
- PMID: 38426222
- PMCID: PMC11370799
- DOI: 10.1093/brain/awae067
Atrophy network mapping of clinical subtypes and main symptoms in frontotemporal dementia
Abstract
Frontotemporal dementia (FTD) is a disease of high heterogeneity, apathy and disinhibition present in all subtypes of FTD and imposes a significant burden on families/society. Traditional neuroimaging analysis has limitations in elucidating the network localization due to individual clinical and neuroanatomical variability. The study aims to identify the atrophy network map associated with different FTD clinical subtypes and determine the specific localization of the network for apathy and disinhibition. Eighty FTD patients [45 behavioural variant FTD (bvFTD) and 35 semantic variant progressive primary aphasia (svPPA)] and 58 healthy controls at Xuanwu Hospital were enrolled as Dataset 1; 112 FTD patients including 50 bvFTD, 32 svPPA and 30 non-fluent variant PPA (nfvPPA) cases, and 110 healthy controls from the Frontotemporal Lobar Degeneration Neuroimaging Initiative (FTLDNI) dataset were included as Dataset 2. Initially, single-subject atrophy maps were defined by comparing cortical thickness in each FTD patient versus healthy controls. Next, the network of brain regions functionally connected to each FTD patient's location of atrophy was determined using seed-based functional connectivity in a large (n = 1000) normative connectome. Finally, we used atrophy network mapping to define clinical subtype-specific network (45 bvFTD, 35 svPPA and 58 healthy controls in Dataset 1; 50 bvFTD, 32 svPPA, 30 nfvPPA and 110 healthy controls in Dataset 2) and symptom-specific networks [combined Datasets 1 and 2, apathy without depression versus non-apathy without depression (80:26), disinhibition versus non-disinhibition (88:68)]. We compare the result with matched symptom networks derived from patients with focal brain lesions or conjunction analysis. Through the analysis of two datasets, we identified heterogeneity in atrophy patterns among FTD patients. However, these atrophy patterns are connected to a common brain network. The primary regions affected by atrophy in FTD included the frontal and temporal lobes, particularly the anterior temporal lobe. bvFTD connects to frontal and temporal cortical areas, svPPA mainly impacts the anterior temporal region and nfvPPA targets the inferior frontal gyrus and precentral cortex regions. The apathy-specific network was localized in the orbital frontal cortex and ventral striatum, while the disinhibition-specific network was localized in the bilateral orbital frontal gyrus and right temporal lobe. Apathy and disinhibition atrophy networks resemble known motivational and criminal lesion networks, respectively. A significant correlation was found between the apathy/disinhibition scores and functional connectivity between atrophy maps and the peak of the networks. This study localizes the common network of clinical subtypes and main symptoms in FTD, guiding future FTD neuromodulation interventions.
Keywords: apathy; atrophy network map; disinhibition; frontotemporal dementia.
© The Author(s) 2024. Published by Oxford University Press on behalf of the Guarantors of Brain.
Conflict of interest statement
The authors report no competing interests.
Figures


Similar articles
-
Transdiagnostic Network Localization of Social, Language, and Motor Symptoms in Patients With Frontotemporal Lobar Degeneration.Neurology. 2024 Dec 24;103(12):e210108. doi: 10.1212/WNL.0000000000210108. Epub 2024 Nov 25. Neurology. 2024. PMID: 39586043
-
The neural basis of frontotemporal dementia (FTD): insights from ALE meta-analyses of four FTD subtypes encompassing 8,057 patients.medRxiv [Preprint]. 2025 Jun 2:2025.06.02.25328809. doi: 10.1101/2025.06.02.25328809. medRxiv. 2025. PMID: 40502594 Free PMC article. Preprint.
-
Criminal Behavior in Frontotemporal Dementia: A Multimodal MRI Study.Hum Brain Mapp. 2025 Aug 1;46(11):e70308. doi: 10.1002/hbm.70308. Hum Brain Mapp. 2025. PMID: 40785170 Free PMC article.
-
Regional cerebral blood flow single photon emission computed tomography for detection of Frontotemporal dementia in people with suspected dementia.Cochrane Database Syst Rev. 2015 Jun 23;2015(6):CD010896. doi: 10.1002/14651858.CD010896.pub2. Cochrane Database Syst Rev. 2015. PMID: 26102272 Free PMC article.
-
Non-pharmacological interventions for improving language and communication in people with primary progressive aphasia.Cochrane Database Syst Rev. 2024 May 29;5(5):CD015067. doi: 10.1002/14651858.CD015067.pub2. Cochrane Database Syst Rev. 2024. PMID: 38808659 Free PMC article.
Cited by
-
Transdiagnostic Network Localization of Social, Language, and Motor Symptoms in Patients With Frontotemporal Lobar Degeneration.Neurology. 2024 Dec 24;103(12):e210108. doi: 10.1212/WNL.0000000000210108. Epub 2024 Nov 25. Neurology. 2024. PMID: 39586043
-
Heterogeneous brain abnormalities in subjective cognitive decline converge on a common network and their transcriptional signature.Alzheimers Dement. 2025 Mar;21(3):e70073. doi: 10.1002/alz.70073. Alzheimers Dement. 2025. PMID: 40145464 Free PMC article.
-
Action-mode subnetworks for decision-making, action control, and feedback.Proc Natl Acad Sci U S A. 2025 Jul 8;122(27):e2502021122. doi: 10.1073/pnas.2502021122. Epub 2025 Jun 30. Proc Natl Acad Sci U S A. 2025. PMID: 40587801 Free PMC article.
-
Imaging Interstitial Fluids and Extracellular Matrix in Cerebrovascular Disorders: Current Perspectives and Clinical Applications.Neuroimaging Clin N Am. 2025 May;35(2):181-189. doi: 10.1016/j.nic.2025.01.001. Epub 2025 Feb 20. Neuroimaging Clin N Am. 2025. PMID: 40210376 Review.
-
Frontotemporal dementia subtyping using machine learning, multivariate statistics and neuroimaging.Brain Commun. 2025 Feb 11;7(1):fcaf065. doi: 10.1093/braincomms/fcaf065. eCollection 2025. Brain Commun. 2025. PMID: 39990273 Free PMC article.
References
-
- Agarwal SM, Rajur S, Bose A, et al. . Use of transcranial direct current stimulation (tDCS) in a woman with behavioral variant fronto-temporal dementia. Asian J Psychiatr. 2016;21:31–32. - PubMed
MeSH terms
Grants and funding
LinkOut - more resources
Full Text Sources
Medical

