. 2024 Jan 22;25(2):bbae063.
doi: 10.1093/bib/bbae063.

Adjustment of scRNA-seq data to improve cell-type decomposition of spatial transcriptomics

Affiliations

Adjustment of scRNA-seq data to improve cell-type decomposition of spatial transcriptomics

Lanying Wang et al. Brief Bioinform. .

Erratum in

Abstract

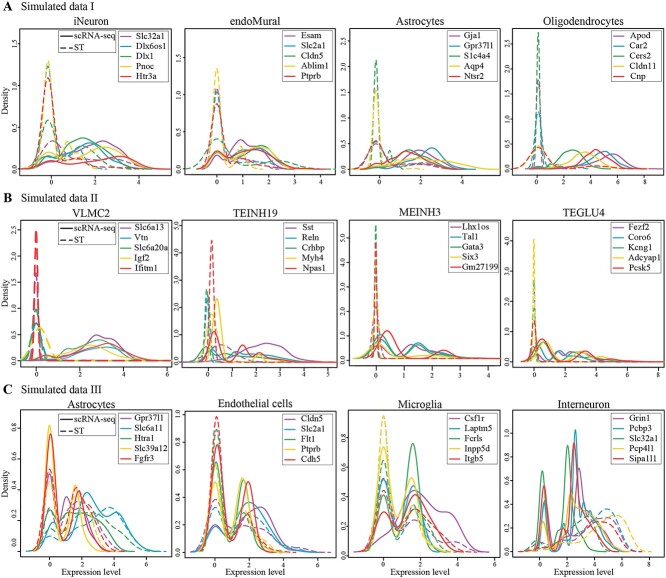
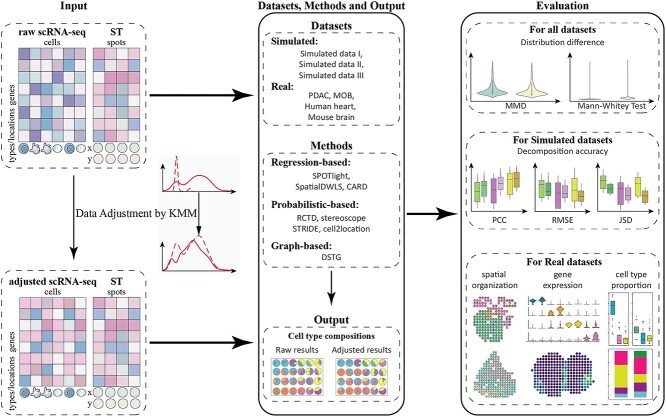
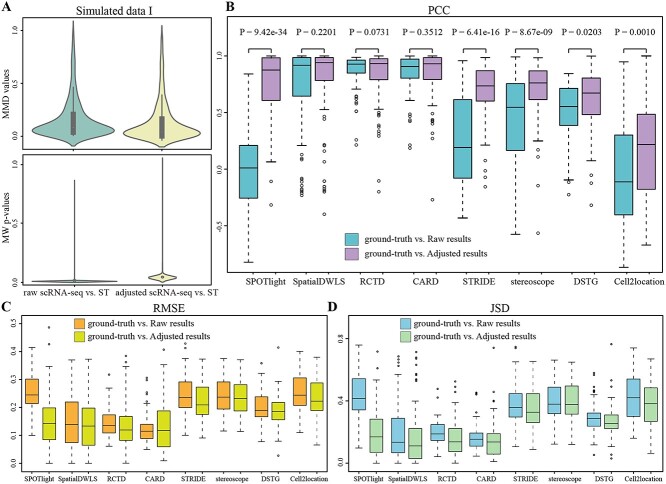
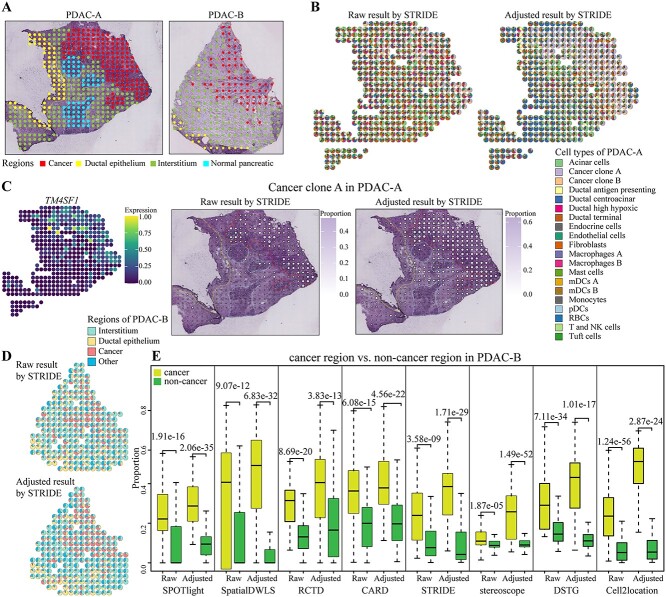
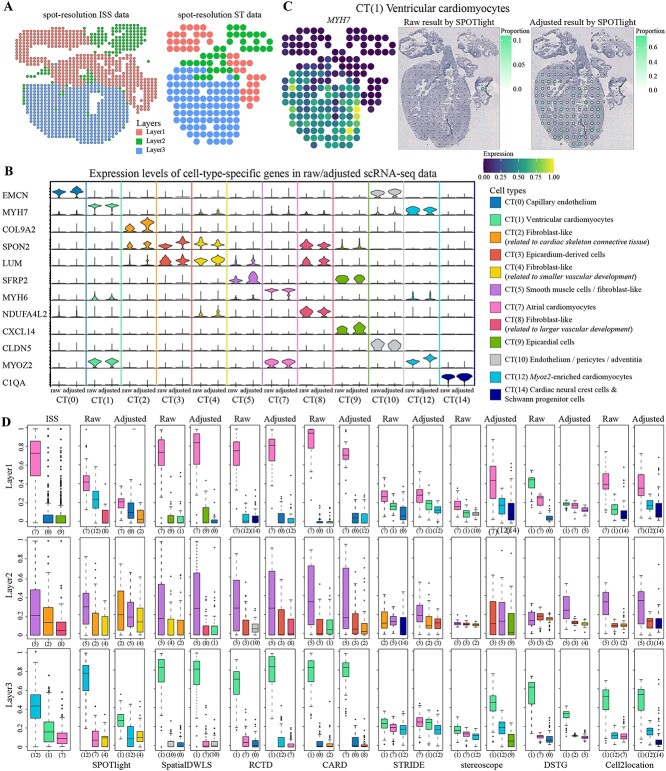
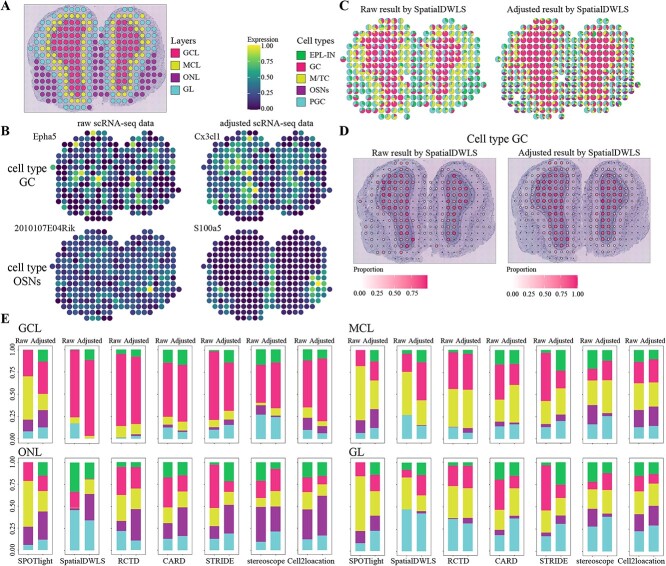
Most sequencing-based spatial transcriptomics (ST) technologies do not achieve single-cell resolution where each captured location (spot) may contain a mixture of cells from heterogeneous cell types, and several cell-type decomposition methods have been proposed to estimate cell type proportions of each spot by integrating with single-cell RNA sequencing (scRNA-seq) data. However, these existing methods did not fully consider the effect of distribution difference between scRNA-seq and ST data for decomposition, leading to biased cell-type-specific genes derived from scRNA-seq for ST data. To address this issue, we develop an instance-based transfer learning framework to adjust scRNA-seq data by ST data to correctly match cell-type-specific gene expression. We evaluate the effect of raw and adjusted scRNA-seq data on cell-type decomposition by eight leading decomposition methods using both simulated and real datasets. Experimental results show that data adjustment can effectively reduce distribution difference and improve decomposition, thus enabling for a more precise depiction on spatial organization of cell types. We highlight the importance of data adjustment in integrative analysis of scRNA-seq with ST data and provide guidance for improved cell-type decomposition.

Keywords: cell-type decomposition; cell-type-specific gene; data adjustment; spatial transcriptomics.


Figures

Figure 1
Figure 1
Distribution difference between scRNA-seq and ST data. Probability density (y-axis) of cell-type-specific gene expression (x-axis) for each cell type on scRNA-seq (solid lines) and ST (dotted lines) data. Each plot represents a cell type, each cell type displayed five genes and each color denotes a gene. Simulated data I (A), Simulated data II (B) and Simulated data III (C) show four cell types, respectively.
Figure 2
Figure 2
Framework of data adjustment on cell-type decomposition. First, the KMM method is adopted to adjust scRNA-seq data on all datasets. Then, the raw/adjusted scRNA-seq and ST data are taken as inputs for eight methods, and the Raw and Adjusted results are obtained. Finally, all datasets are evaluated on data distribution distance; three simulated datasets are compared on decomposition accuracy; and four real datasets are assessed on spatial organization of cell types, gene expression and cell type proportion.
Figure 3
Figure 3
Evaluation of data adjustment in Simulated data I by eight methods. (A) MMD values (top) and MW test P-values (bottom) between raw/adjusted scRNA-seq and ST data, the difference of raw scRNA-seq versus ST (Left) and adjusted scRNA-seq versus ST (Right). (B) PCC of ground-truth versus Raw results and ground-truth versus Adjusted results on cell type proportions. (C) RMSE of ground-truth versus Raw results and ground-truth versus Adjusted results on cell type proportions. (D) JSD of ground-truth versus Raw results and ground-truth versus Adjusted results on cell type proportions. Each boxplot is the quartiles of proportions, ranges from the third and first quartiles with median as the middle line and whiskers extending 1.5 times the interquartile range, and points outside are outliers.
Figure 4
Figure 4
Evaluation of data adjustment in PDAC dataset by eight methods. (A) Annotated H&E staining image of PDAC-A (left) and PDAC-B (right) data. (B) Pie charts of cell type proportions in Raw (left) and Adjusted (right) results by STRIDE method for PDAC-A. Each pie denotes a spot, colored by cell types and divided by proportions. (C) Left, the expression of TM4SF1 in PDAC-A. Cell type proportions in Raw (middle) and Adjusted (right) results of Cancer clone A on STRIDE. Both the size and color of each dot indicate the proportion of that cell type in that spot. (D) Pie charts of cell type proportions in Raw (top) and Adjusted (bottom) results of four regions by STRIDE method for PDAC-B. (E) Cell type proportions in Raw and Adjusted results of cancer region versus non-cancer region for PDAC-B. Each value in each boxplot is the P-value of t-test.
Figure 5
Figure 5
Evaluation of data adjustment in Human heart dataset by eight methods. (A) Biological layers of spot-resolution ISS data (left) and spot-resolution ST data (right). (B) Expression levels of cell-type-specific genes in raw scRNA-seq and adjusted scRNA-seq data. The vertical coordinates are 12 genes, the horizontal coordinates are 12 cell types and the value of each violin plot denotes the expression of that gene in the corresponding scRNA-seq data. (C) Left, the expression of MYH7 in spot-resolution ST data. Cell type proportions in Raw (middle) and Adjusted (right) results of CT (1) on SPOTlight. Both the size and color of each dot indicate the proportion of that cell type in that spot. (D) Cell type proportions of spot-resolution ISS data and estimated proportions of spot-resolution ST data for the top three cell types in three layers.
Figure 6
Figure 6
Evaluation of data adjustment in the MOB dataset by seven methods. (A) Annotated layers on H&E staining image. (B) Expression levels of cell-type-specific genes on cell types GC (top two) and OSNs (bottom two) selected by raw scRNA-seq (left) and adjusted scRNA-seq (right). (C) Pie charts of cell type proportions in Raw (left) and Adjusted (right) results by SpatialDWLS method. Each pie denotes a spot, colored by cell types and divided by proportions. (D) Cell type proportions in Raw (left) and Adjusted (right) results of GC by SpatialDWLS. Both the size and color of each dot indicate the proportion of that cell type in that spot. (E) Estimated cell type proportions of each layer. The two columns in each pair of method are the Raw (left) and Adjusted results (right).

Similar articles

Cited by

References

    1. Marx V. Method of the Year 2020: spatially resolved transcriptomics. Nat Methods 2021;18:9–14. - PubMed
    1. Zeng Z, Li Y, Li Y, Luo Y. Statistical and machine learning methods for spatially resolved transcriptomics data analysis. Genome Biol 2022;23(1):83. - PMC - PubMed
    1. Walker BL, Cang Z, Ren H, et al. Deciphering tissue structure and function using spatial transcriptomics. Commun Biol 2022;5(1):220. - PMC - PubMed
    1. Rao A, Barkley D, Franca GS, et al. Exploring tissue architecture using spatial transcriptomics. Nature 2021;596(7871):211–20. - PMC - PubMed
    1. Tian L, Chen F, Macosko EZ. The expanding vistas of spatial transcriptomics. Nat Biotechnol 2023;41(6):773–82. - PMC - PubMed

Publication types

MeSH terms