

Assessing racial, ethnic, and nativity disparities in US cancer mortality using a new integrated platform
- PMID: 38426333
- PMCID: PMC11223878
- DOI: 10.1093/jnci/djae052
Assessing racial, ethnic, and nativity disparities in US cancer mortality using a new integrated platform
Abstract
Background: Foreign-born populations in the United States have markedly increased, yet cancer trends remain unexplored. Survey-based Population-Adjusted Rate Calculator (SPARC) is a new tool for evaluating nativity differences in cancer mortality.
Methods: Using SPARC, we calculated 3-year (2016-2018) age-adjusted mortality rates and rate ratios for common cancers by sex, age group, race and ethnicity, and nativity. Trends by nativity were examined for the first time for 2006-2018. Traditional cancer statistics draw populations from decennial censuses. However, nativity-stratified populations are from the American Community Surveys, thus involve sampling errors. To rectify this, SPARC employed bias-corrected estimators. Death counts came from the National Vital Statistics System.
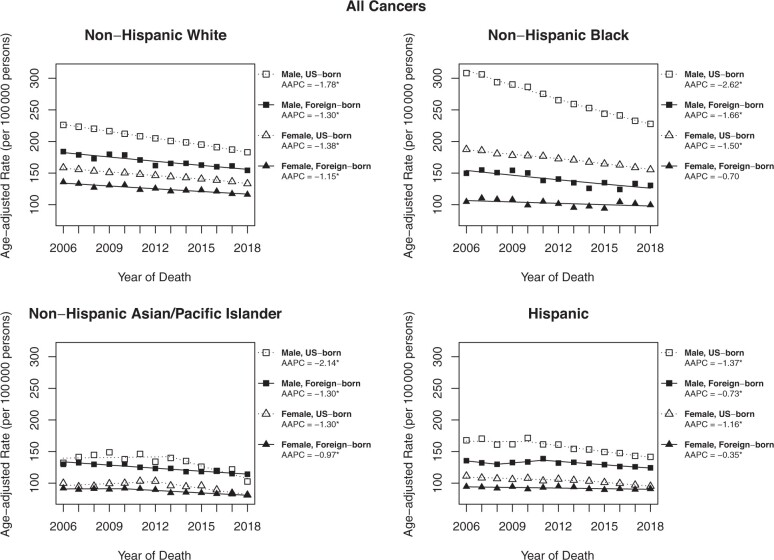
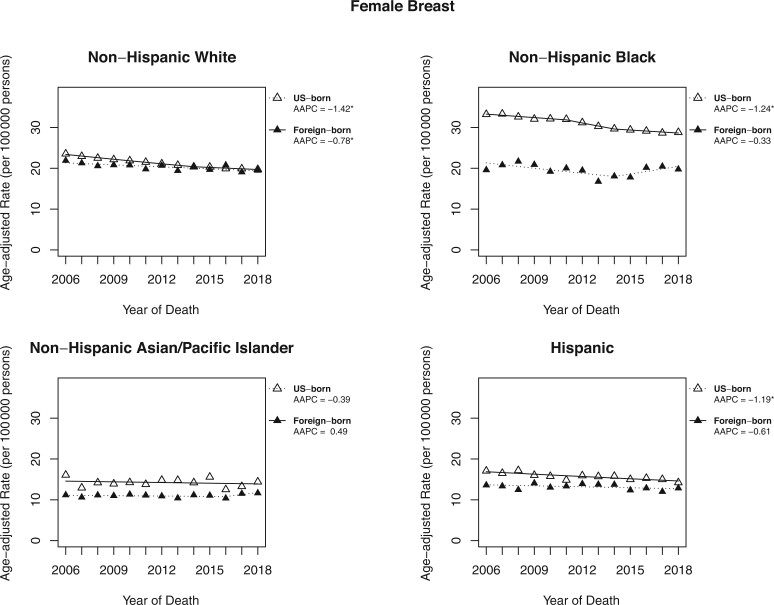
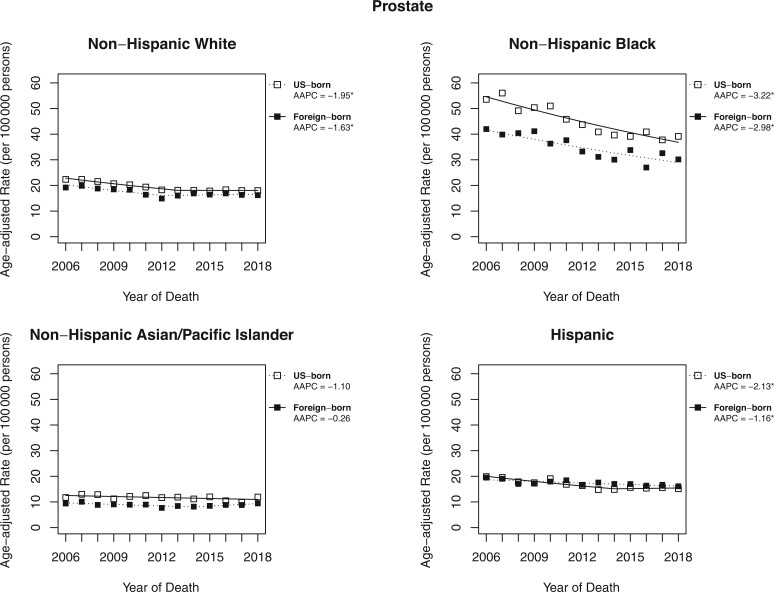
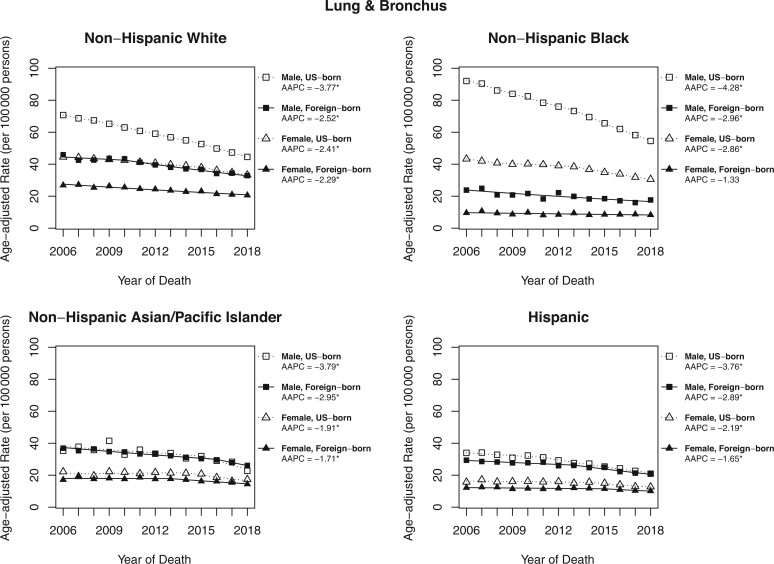
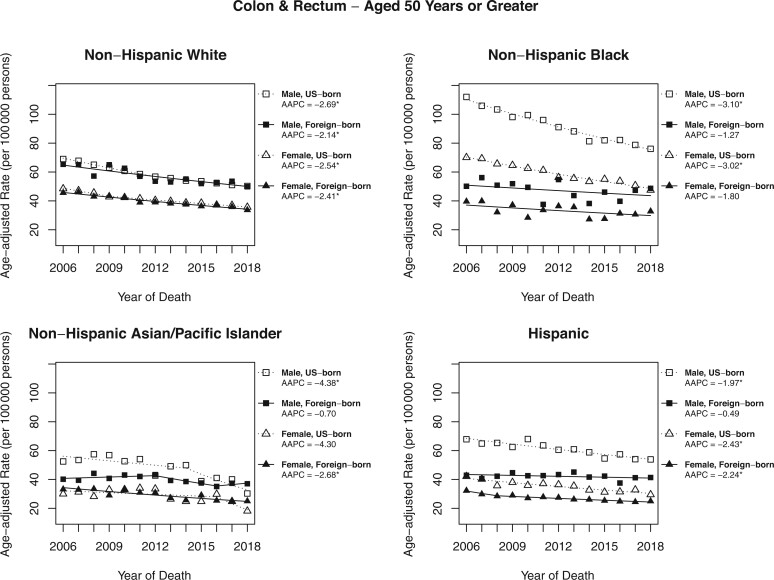
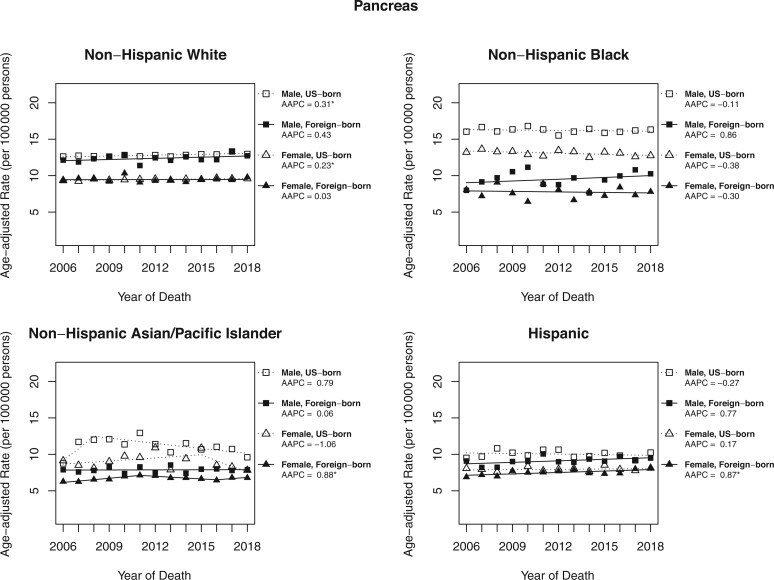
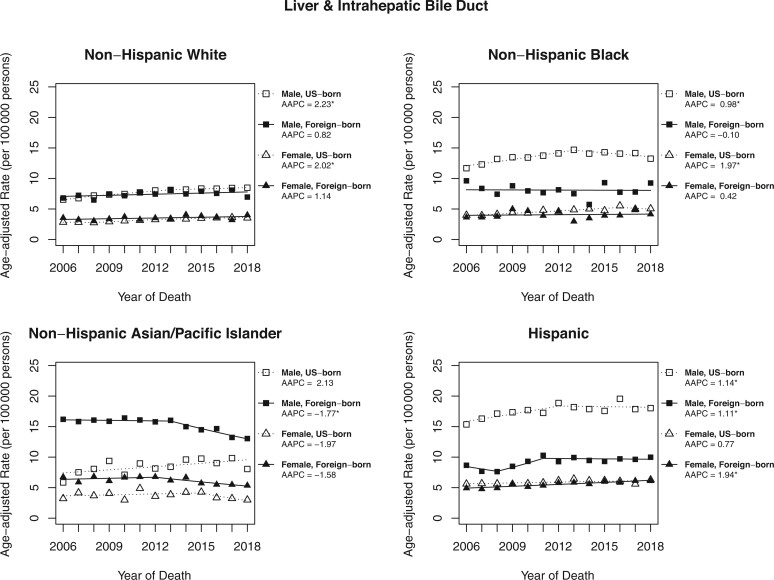
Results: Age-adjusted mortality rates were higher among US-born populations across nearly all cancer types, with the largest US-born, foreign-born difference observed in lung cancer among Black women (rate ratio = 3.67, 95% confidence interval [CI] = 3.37 to 4.00). The well-documented White-Black differences in breast cancer mortality existed mainly among US-born women. For all cancers combined, descending trends were more accelerated for US-born compared with foreign-born individuals in all race and ethnicity groups with changes ranging from -2.6% per year in US-born Black men to stable (statistically nonsignificant) among foreign-born Black women. Pancreas and liver cancers were exceptions with increasing, stable, or decreasing trends depending on nativity and race and ethnicity. Notably, foreign-born Black men and foreign-born Hispanic men did not show a favorable decline in colorectal cancer mortality.
Conclusions: Although all groups show beneficial cancer mortality trends, those with higher rates in 2006 have experienced sharper declines. Persistent disparities between US-born and foreign-born individuals, especially among Black people, necessitate further investigation.
Published by Oxford University Press 2024.
Conflict of interest statement
No conflict of interest was reported by any of the authors.
Figures
Similar articles
-
Drug overdose mortality by race/ethnicity across US-born and immigrant populations.Drug Alcohol Depend. 2022 Mar 1;232:109309. doi: 10.1016/j.drugalcdep.2022.109309. Epub 2022 Jan 19. Drug Alcohol Depend. 2022. PMID: 35077954
-
Rates of Sudden Unexpected Infant Death (SUID) and its Subcategories in the U.S.: The Effect of Maternal Race, Ethnicity and Nativity.Matern Child Health J. 2025 May;29(5):660-668. doi: 10.1007/s10995-025-04084-9. Epub 2025 Apr 19. Matern Child Health J. 2025. PMID: 40252172
-
Alzheimer's Disease and Related Dementias Diagnosis in the United States Among US-Born and Foreign-Born White, Black, Hispanic, and Asian Older Adults.J Racial Ethn Health Disparities. 2025 Jun;12(3):1847-1855. doi: 10.1007/s40615-024-02014-z. Epub 2024 Apr 26. J Racial Ethn Health Disparities. 2025. PMID: 38668780
-
Population-based evaluation of disparities in stomach cancer by nativity among Asian and Hispanic populations in California, 2011-2015.Cancer. 2024 Apr 1;130(7):1092-1100. doi: 10.1002/cncr.35141. Epub 2023 Dec 11. Cancer. 2024. PMID: 38079517 Free PMC article.
-
Disparities in Cancer Screening Among the Foreign-Born Population in the United States: A Narrative Review.Cancers (Basel). 2025 Feb 8;17(4):576. doi: 10.3390/cancers17040576. Cancers (Basel). 2025. PMID: 40002170 Free PMC article. Review.
Cited by
-
Gendered interpretations of the causes of breast cancer: a structured review of migrant studies.BMC Womens Health. 2025 Apr 10;25(1):168. doi: 10.1186/s12905-025-03677-4. BMC Womens Health. 2025. PMID: 40211237 Free PMC article.
-
Optimization of computational ancestry inference for use in cancer cell lines.Biol Methods Protoc. 2025 Jun 2;10(1):bpaf043. doi: 10.1093/biomethods/bpaf043. eCollection 2025. Biol Methods Protoc. 2025. PMID: 40585183 Free PMC article.
-
Cancer statistics for African American and Black people, 2025.CA Cancer J Clin. 2025 Mar-Apr;75(2):111-140. doi: 10.3322/caac.21874. Epub 2025 Feb 20. CA Cancer J Clin. 2025. PMID: 39976243 Free PMC article.
-
Cancer Mortality among Hispanic Groups in the United States by Birthplace (2003-2017).Cancer Epidemiol Biomarkers Prev. 2024 Dec 2;33(12):1598-1609. doi: 10.1158/1055-9965.EPI-24-0792. Cancer Epidemiol Biomarkers Prev. 2024. PMID: 39361352 Free PMC article.
References
-
- Ruggles S, Flood S, Goeken R, et al.IPUMS USA: Version 12.0 [Dataset]. Minneapolis, MN: IPUMS; 2022. 10.18128/D010.V12.0. Accessed January 18, 2023. - DOI
MeSH terms
Grants and funding
LinkOut - more resources
Full Text Sources
Medical
Miscellaneous
