. 2024 Mar 1;134(5):e173107.
doi: 10.1172/JCI173107.

A humanized IL-2 mutein expands Tregs and prolongs transplant survival in preclinical models

Affiliations

A humanized IL-2 mutein expands Tregs and prolongs transplant survival in preclinical models

Orhan Efe et al. J Clin Invest. .

Abstract

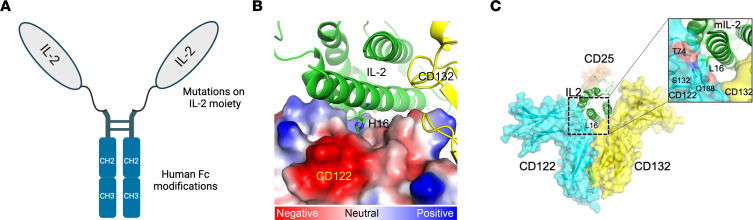
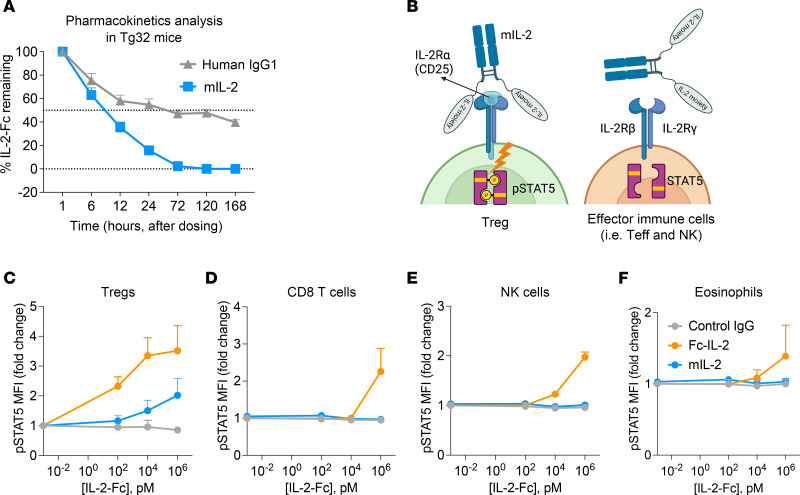
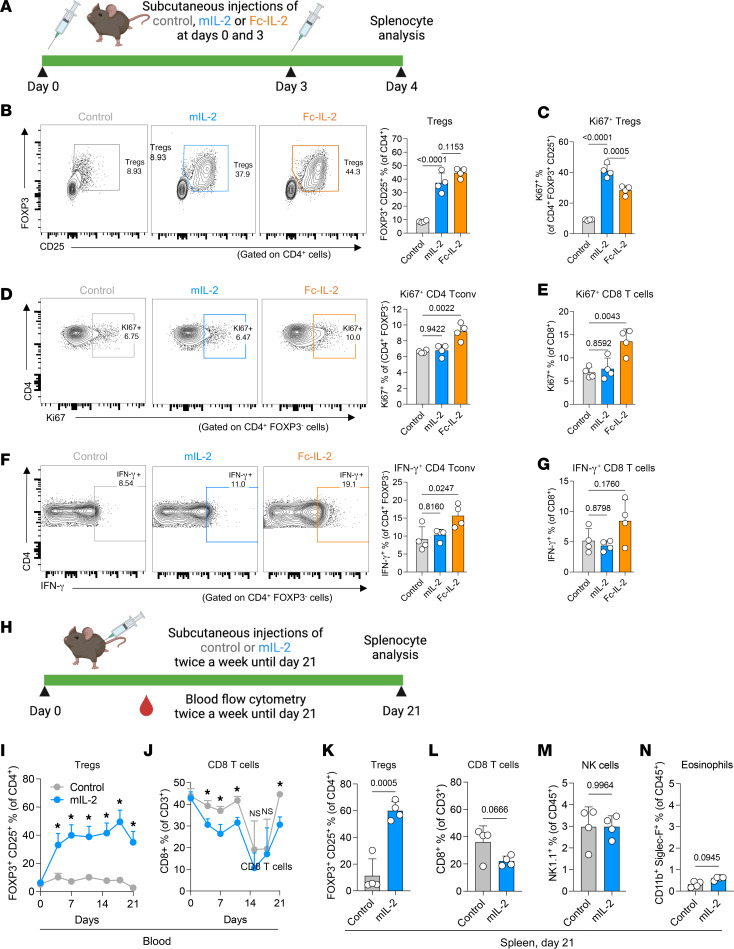
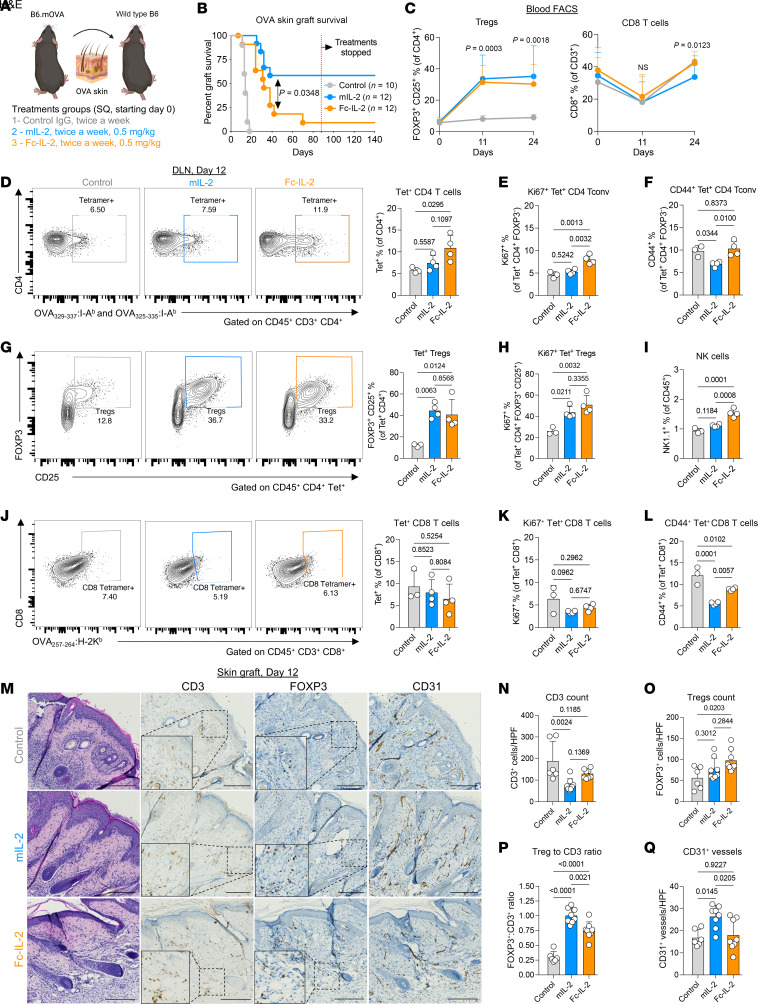
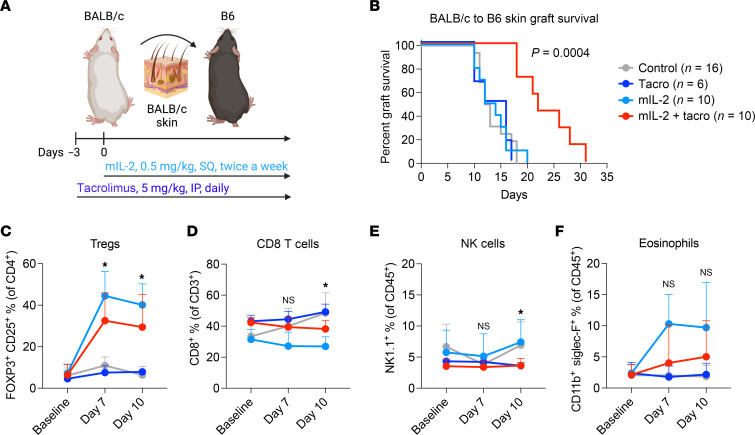
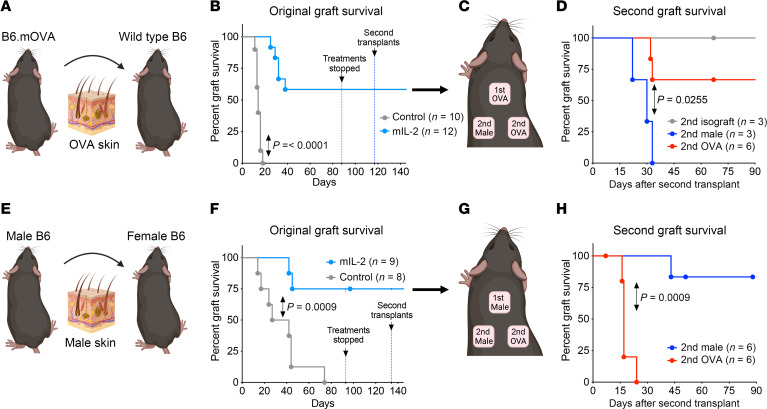
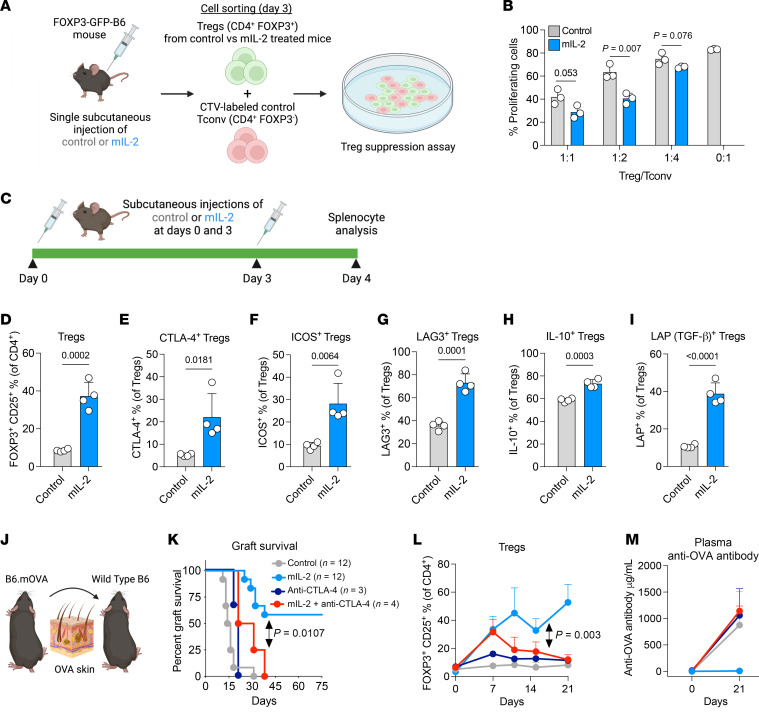
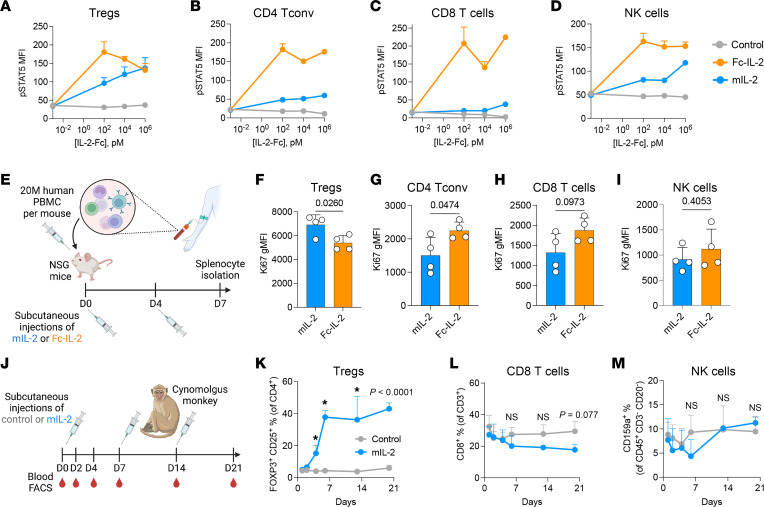
Long-term organ transplant survival remains suboptimal, and life-long immunosuppression predisposes transplant recipients to an increased risk of infection, malignancy, and kidney toxicity. Promoting the regulatory arm of the immune system by expanding Tregs may allow immunosuppression minimization and improve long-term graft outcomes. While low-dose IL-2 treatment can expand Tregs, it has a short half-life and off-target expansion of NK and effector T cells, limiting its clinical applicability. Here, we designed a humanized mutein IL-2 with high Treg selectivity and a prolonged half-life due to the fusion of an Fc domain, which we termed mIL-2. We showed selective and sustainable Treg expansion by mIL-2 in 2 murine models of skin transplantation. This expansion led to donor-specific tolerance through robust increases in polyclonal and antigen-specific Tregs, along with enhanced Treg-suppressive function. We also showed that Treg expansion by mIL-2 could overcome the failure of calcineurin inhibitors or costimulation blockade to prolong the survival of major-mismatched skin grafts. Validating its translational potential, mIL-2 induced a selective and sustainable in vivo Treg expansion in cynomolgus monkeys and showed selectivity for human Tregs in vitro and in a humanized mouse model. This work demonstrated that mIL-2 can enhance immune regulation and promote long-term allograft survival, potentially minimizing immunosuppression.

Keywords: Immunology; Organ transplantation; Tolerance; Transplantation.


Conflict of interest statement

Conflict of interest: ZS and GJB are employees of Visterra Inc.

Figures

Figure 1
Figure 1. Structure of mIL-2 including its Fc domain and interactions of IL-2 with CD122 (IL-2Rβ).
(A) Illustration of the structure of mIL-2 including the mutations to increase Treg selectivity and developability and the fusion of a modified human antibody Fc to increase its half-life. (B) Quaternary structure of WT IL-2 and its interaction with the IL-2R by depiction of the electrostatic charges on the surface of CD122 (IL-2Rβ). IL-2 and CD132 (IL-2Rγ) molecules are shown in green and yellow, respectively. The electrostatic structure on the surface of CD122 is depicted by a red-to-blue color gradient representing a negative-to-positive charge gradient, respectively, while the white color represents a neutral charge or a hydrophobic surface. The H16 side chain of IL-2 undergoes protonation in the endosome due to acidic pH, and the positively charged H16 is expected to enhance the electrostatic interactions between IL-2 and CD122. (C) Quaternary structure of mIL-2 (H16L substitution) and its interaction with the IL-2R. The IL-2 surface residue H16L substitution is expected to have minimal impact on the secondary and tertiary structures of the IL-2 molecule since leucine also has a high α helix propensity. The H16L-IL-2 molecule is shown in green, and the receptors CD25 (IL2-Ra), CD122(IL2-Rβ) and CD132(IL-2Rγ) are shown in the semitransparent surface diagram in orange, cyan and yellow, respectively. The insert shows the molecular environment of the L16 residue of mIL-2, in which the hydrophobic side chain of L16 is proximal to the polar residues of CD122 (IL-2b), and this unfavorable molecular environment is responsible for the reduced affinity of mIL-2 for CD122 at physiological conditions. The reduced affinity of mIL-2 for CD122 in physiological conditions gives a better selectivity for CD25-expressing cells, whereas in the endosome, it enables enhanced recycling.
Figure 2
Figure 2. The Treg specificity and pharmacokinetics of mIL-2.
(A) Bioavailability of intravenous mIL-2 (0.25 mg/kg) compared with equimolar human IgG1 (1.5 mg/kg) in hFcRn-transgenic Tg32 mice, indicating its prolonged half-life (n = 3/group, data are from a single experiment). (B) Illustration showing the selective binding of mIL-2 to Tregs but not to effector immune cells due to constitutive IL-2Rα (CD25) expression on Tregs. Flow cytometric analyses of p-STAT5 (pY694) levels in splenic (C) Tregs, (D) CD8+ T cells, (E) NK cells, and (F) eosinophils after a 30-minute in vitro stimulation with control IgG, mIL-2, or Fc–IL-2 at increasing concentrations (n = 5/group, data were pooled from 3 independent experiments). Graphs show the mean ± SD and 1-way ANOVA and Tukey’s multiple-comparison test were used for group comparisons (CF).
Figure 3
Figure 3. In vivo selective Treg expansion by mIL-2.
(A) Illustration of the short-term in vivo experiment in which B6 FOXP3-GFP mice received 2 doses of control IgG, mIL-2, or Fc–IL-2 on days 0 and 3, and spleens were harvested on day 4. (B) Representative flow cytometry plot and bar graph showing the frequencies of splenic total Tregs. (C) Bar graph showing the frequencies of Ki67+ Tregs. (D) Representative flow cytometry and bar graph showing the frequencies of Ki67+CD4+ Tconv cells. (E) Bar graph showing the frequencies of Ki67+CD8+ T cells. (F) Representative flow cytometry and bar graph showing the frequencies of IFN-γ+CD4+ Tconv cells. (G) Bar graph showing the frequencies of IFN-γ+CD8+ T cells following in vitro stimulation with a PMA/ionomycin/brefeldin cocktail for 6 hours (n = 4/group; data are representative of 2 independent experiments). (H) Illustration showing the sustained treatment experiment in which B6 FOXP3-GFP mice received twice-weekly subcutaneous injections of mIL-2 or control IgG for 21 days. Flow cytometric analyses of peripheral (I) Tregs and (J) CD8+ T cells over time, and splenic (K) Tregs, (L) CD8+ T cells, (M) NK cells, and (N) eosinophils on day 21 (n = 4/group, data representative of single experiment). In all experiments, mIL-2 and Fc–IL-2 were given at 0.5 mg/kg, and control IgG was given at an equimolar dose. Graphs show the mean ± SD. One-way ANOVA with Tukey’s multiple-comparison test was used for 3-group comparisons (BG) and unpaired 2-tailed t test for 2-group comparisons (IN) (*P ≤ 0.05; NS, P > 0.05).
Figure 4
Figure 4. Effect of mIL-2 in a minor-mismatch skin transplant model.
(A) Illustration of the experimental design and (B) Kaplan-Meier graph of the graft survival in B6.mOVA to WT B6 mouse skin transplantation (n = 10–12/group, data are representative of 3 independent experiments). (C) Flow cytometric analyses of peripheral Tregs and CD8+ T cells on days 0, 11, and 24. (D) Representative flow cytometric gating and analysis of OVA tetramer+CD4+ T cells using a combination of OVA329–337:I-Ab and OVA325–335:I-Ab tetramers and graph analyses showing the percentages of (E) Ki67+ and (F) CD44+tetramer+CD4+ Tconv cells in the DLNs on day 12. (G) Representative flow cytometric gating and analysis of the total tetramer+ Tregs and (H) percentages of Ki67+tetramer+ Tregs. (I) Analysis of the frequencies of NK cells. (J) Representative flow cytometry gating and percentages CD8+ T cells positive for the OVA257–264:H-2Kb tetramer and frequencies of (K) Ki67+ and (L) CD44+ cells in CD8+tetramer+ T cells (n = 4/group). (M) Representative images of H&E staining and IHC with antibodies against FOXP3 and CD3 of the skin grafts at day 12. Dashed line–outlined rectangular areas are shown at ×2 higher magnification on the left lower corners of the FOXP3 and CD3 IHC images. Graphs show the counts of (N) CD3+ and (O) FOXP3+ cells, (P) the ratios of FOXP3+ to CD3+ cell counts, and (Q) the counts of CD31+ vessels in 2 random high-powered fields per graft (n = 4/group, data are representative of a single experiment). Scale bars: 50 μm. Graphs show the mean ± SD and 1-way (DQ) or 2-way (C) ANOVA with Tukey’s multiple-comparison test was used for the group comparisons. The long-rank test was used for graft survival comparisons (B). HPF, high-powered field.
Figure 5
Figure 5. Effect of mIL-2 in combination with tacrolimus in a major-mismatch skin transplant model.
(A) Illustration of the BALB/c to B6 skin transplantation model, in which tacrolimus was given daily intraperitoneally at 5 mg/kg starting at day -3 and mIL-2 was given subcutaneously twice a week at 0.5 mg/kg starting on day 0. (B) Representative survival curve of the skin allografts in different treatment groups (n = 6–16, data were pooled from 5 independent experiments). Graphs of flow cytometric analyses of circulating (C) Tregs, (D) CD8+ T cells, (E) NK cells, and (F) eosinophils at baseline and on days 7 and 10. Graphs show the mean ± SD, and 2-way ANOVA with Tukey’s multiple-comparison test was used for group comparisons (CF). The long-rank test was used for graft survival comparisons (B). *P ≤ 0.05; NS, P > 0.05, comparing the mIL-2 plus tacrolimus group versus the control group.
Figure 6
Figure 6. Assessment of antigen-specific tolerance after mIL-2 treatment and rechallenge with a second graft in 2 minor-mismatch skin transplant models.
(A) Illustration of a female B6.mOVA to female WT B6 skin transplant model. (B) Kaplan-Meier graph showing the OVA graft survival in mIL-2 versus control groups and the days of mIL-2 treatment discontinuation (red dotted line) and the second skin transplantation (blue dotted line), respectively. (C) Illustration of the antigen-specific tolerance experiment, in which original OVA graft recipient mice were challenged with 2 additional grafts, including a similar graft and a third-party graft. (D) Kaplan-Meier graph showing the long-term survival of a second OVA graft and early rejection of a third-party (male) graft in the original OVA graft female recipients. Isograft, syngeneic graft. (E) Illustration of the experiment and (F) Kaplan-Meier graph showing the original graft survival, treatment discontinuation, and the timing of the second skin transplant in male to female B6 skin transplantation. (G) Illustration of the tolerance experiment in the original male graft recipients and (H) Kaplan-Meier graph showing the long-term survival of the second similar grafts (male graft) and early rejection of the third-party grafts (OVA graft). The long-rank test was used for graft survival comparisons (B, D, F, and H) (n = 3–12 animals/group, data were pooled from 5 independent experiments).
Figure 7
Figure 7. Effect of mIL-2 on Treg-suppressive function and its CTLA-4–dependent efficacy in skin transplantation.
(A) Illustration of the Treg suppression assay performed by coculturing naive CTV-labeled CD4+ Tconv cells with Tregs from B6 FOXP3-GFP mice treated with control IgG or mIL-2 (0.5 mg/kg). (B) Percentages of proliferating CD4+ Tconv cells after coculturing with different ratios of Tregs (n = 3/group; representative data are from 3 independent experiments). (C) Illustration of the experimental design to assess the functional surface markers and inhibitory cytokines of splenic Tregs in which B6 FOXP3-GFP mice were treated with control IgG or mIL-2 at 0.5 mg/kg subcutaneously on days 0 and 3, and splenocytes were harvested on day 4. Flow cytometric analyses of (D) total Tregs, (E) CTLA-4+, (F) ICOS+, and (G) LAG3+ Tregs. Flow cytometric analyses of (H) IL-10+ and (I) LAP+ (TGF-β+) Tregs after in vitro stimulation with a PMA/ionomycin/brefeldin cocktail for 6 hours (n = 4/group, data are representative of 2 independent experiments). (J) Illustration of B6.mOVA to WT B6 skin transplantation, in which the recipient mice were treated with subcutaneous control IgG or mIL-2 (0.5 mg/kg) with or without anti–CTLA-4 antibodies (combination of 2 antibodies from the clones of UC10-4F10-11 and 9H10; 200 μg/mouse for each clone, intraperitoneally) twice a week starting on day 0 (n = 3–12/group, data were pooled from 4 different experiments). (K) Kaplan-Meier curves of the graft survivals. (L) Flow cytometric analysis of peripheral blood Tregs from the recipient mice. (M) Plasma anti-OVA antibody levels as determined by ELISA on days 0 and 21 (n = 3–4/group). Graphs show the mean ± SD. A 2-tailed t test was used for 2-group comparisons (B and DI) and 1-way (M) and 2-way (L) ANOVA with Tukey’s multiple-comparison test for 3 or more group comparisons as appropriate. The long-rank test was used for graft survival comparisons (K). CTV, CellTrace Violet.
Figure 8
Figure 8. Effect of mIL-2 in human and nonhuman primate Tregs.
Flow cytometric analyses of p-STAT5 levels in human PBMCs including (A) Tregs, (B) CD4+ Tconv cells, (C) CD8+ T cells, and (D) NK cells after 30-minute in vitro treatments with increasing concentrations of control IgG, mIL-2, or WT Fc–IL-2 (n = 3/group). (E) Illustration of the humanized NSG mouse model, in which 20 million human PBMCs were intravenously injected into NSG mice that were treated with subcutaneous injections of mIL-2 or Fc–IL-2 (0.05 mg/kg) on days 0 and 4 followed by spleen isolation on day 7. Flow cytometric analyses of Ki67 levels in human (F) Tregs, (G) CD4+ Tconv cells, (H) CD8+ T cells, and (I) NK cells in a humanized NSG mouse model (n = 4/group, data are from 2 experiments). (J) Illustration of the experimental design of in vivo Treg expansion in cynomolgus monkeys by subcutaneous injection of vehicle versus mIL-2 at 0.5 mg/kg on days 0, 7, and 14 and flow cytometric analysis of peripheral blood (K) Tregs, (L) CD8+ T cells, and (M) NK cells over time (n = 4/group). Graphs show the mean ± SD. A 2-tailed t test was used for 2-group comparisons (FI and KM), and 1-way ANOVA with Tukey’s multiple-comparison test (AD) was used for 3-group comparisons (*P ≤ 0.05; NS, P > 0.05). gMFI, geometric MFI.

Comment in

  • Tipping the balance toward transplantation tolerance: in vivo therapy using a mutated IL-2

Similar articles

Cited by

References

    1. McDonald-Hyman C, et al. Advances and challenges in immunotherapy for solid organ and hematopoietic stem cell transplantation. Sci Transl Med. 2015;7(280):280rv2. doi: 10.1126/scitranslmed.aaa6853. - DOI - PMC - PubMed
    1. Wojciechowski D, Wiseman A. Long-term immunosuppression management: opportunities and uncertainties. Clin J Am Soc Nephrol. 2021;16(8):1264–1271. doi: 10.2215/CJN.15040920. - DOI - PMC - PubMed
    1. Lentine KL, et al. OPTN/SRTR 2020 annual data report: kidney. Am J Transplant. 2022;22(suppl 2):21–136. doi: 10.1111/ajt.16982. - DOI - PubMed
    1. Lamb KE, et al. Long-term renal allograft survival in the United States: a critical reappraisal. Am J Transplant. 2011;11(3):450–462. doi: 10.1111/j.1600-6143.2010.03283.x. - DOI - PubMed
    1. Kwong A, et al. OPTN/SRTR 2018 annual data report: liver. Am J Transplant. 2020;20(suppl s1):193–299. doi: 10.1111/ajt.15674. - DOI - PubMed