. 2024 Mar 1;134(5):e174806.
doi: 10.1172/JCI174806.

PIEZO1 is a distal nephron mechanosensor and is required for flow-induced K+ secretion

Affiliations

PIEZO1 is a distal nephron mechanosensor and is required for flow-induced K+ secretion

Rolando Carrisoza-Gaytan et al. J Clin Invest. .

Abstract

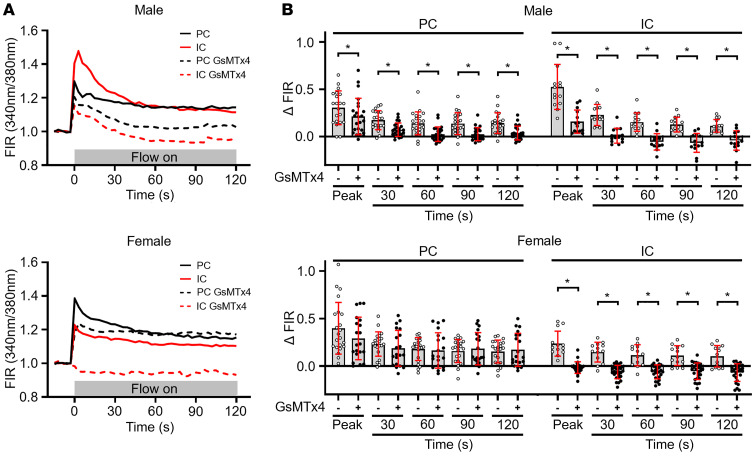
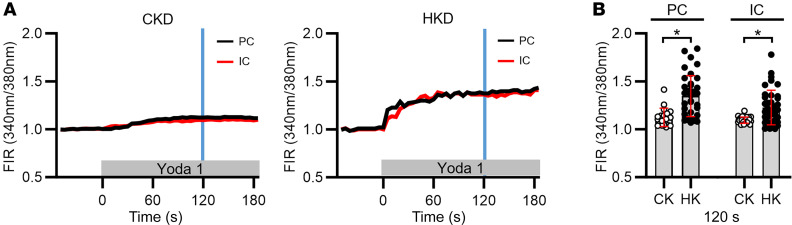
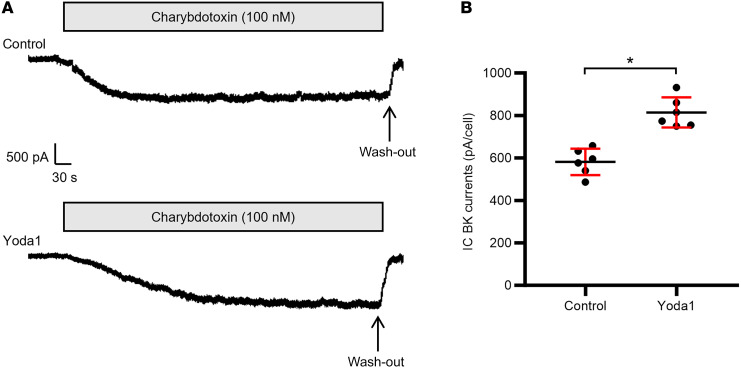
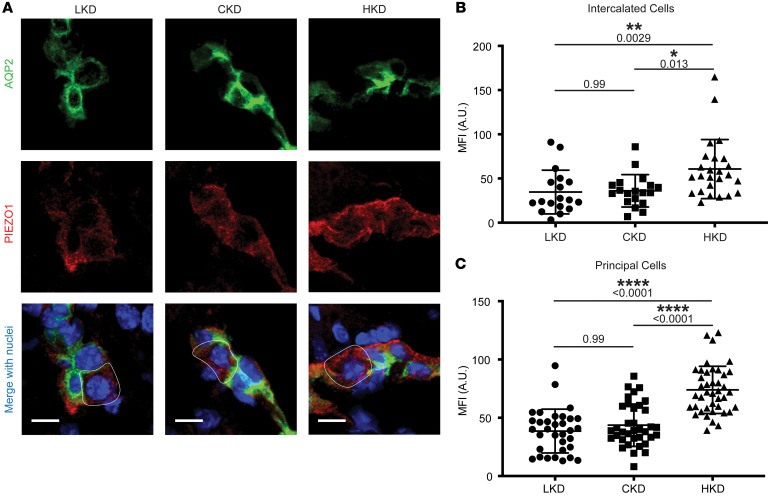
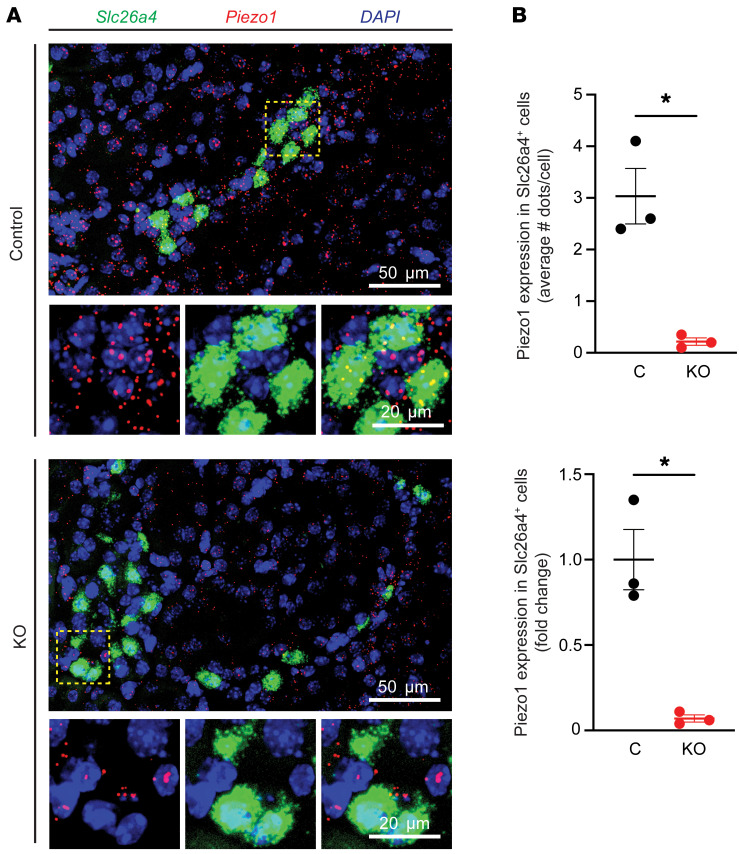
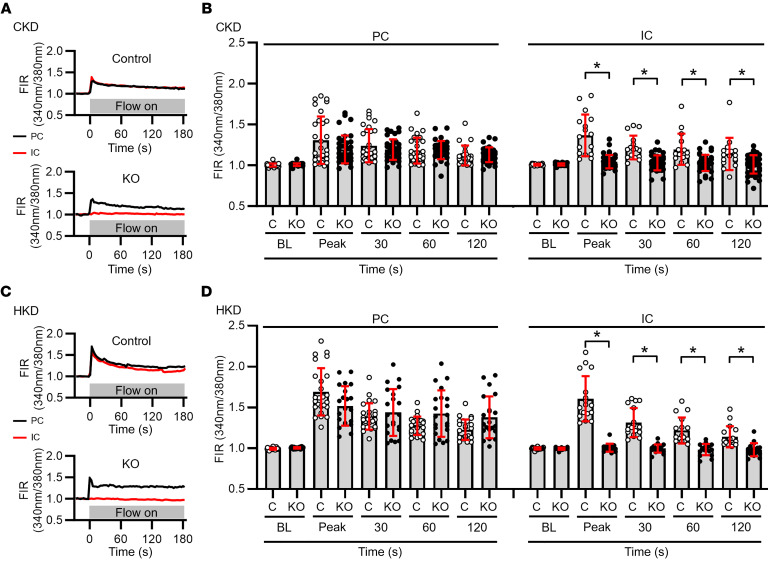
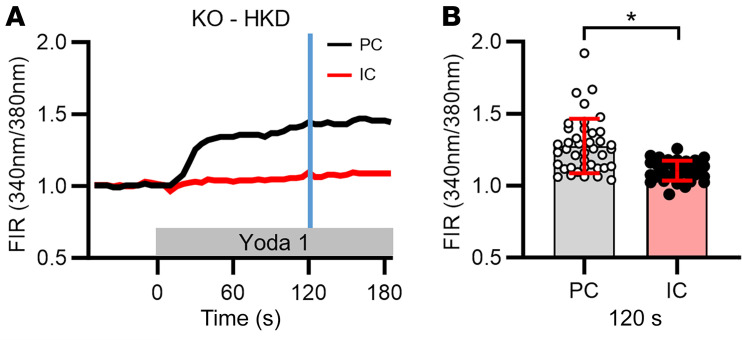
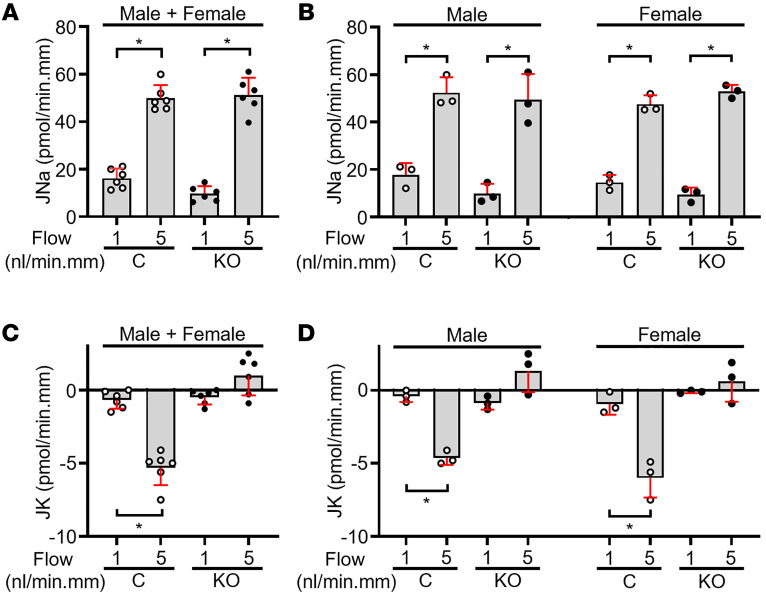
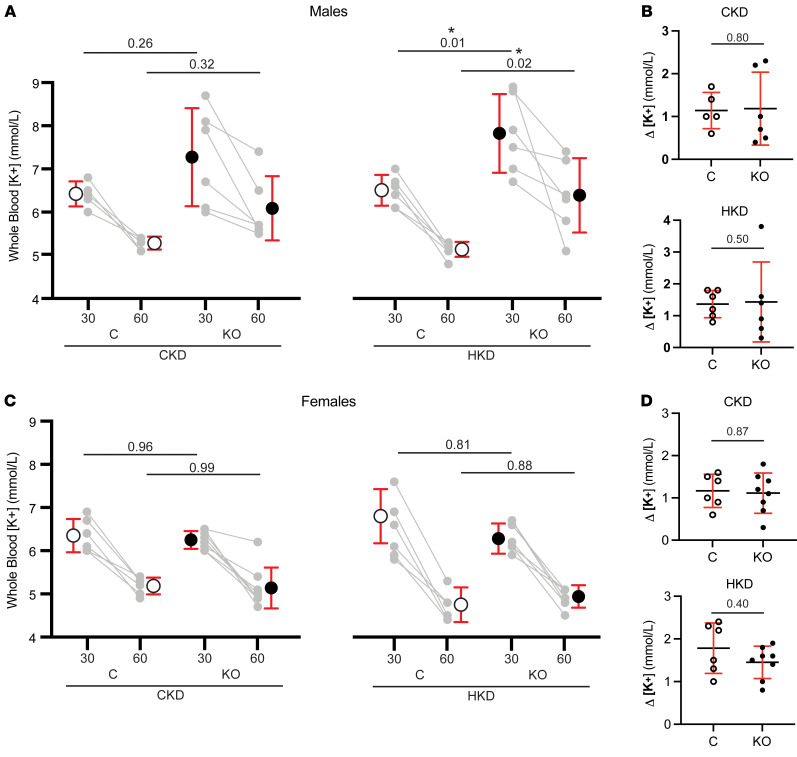
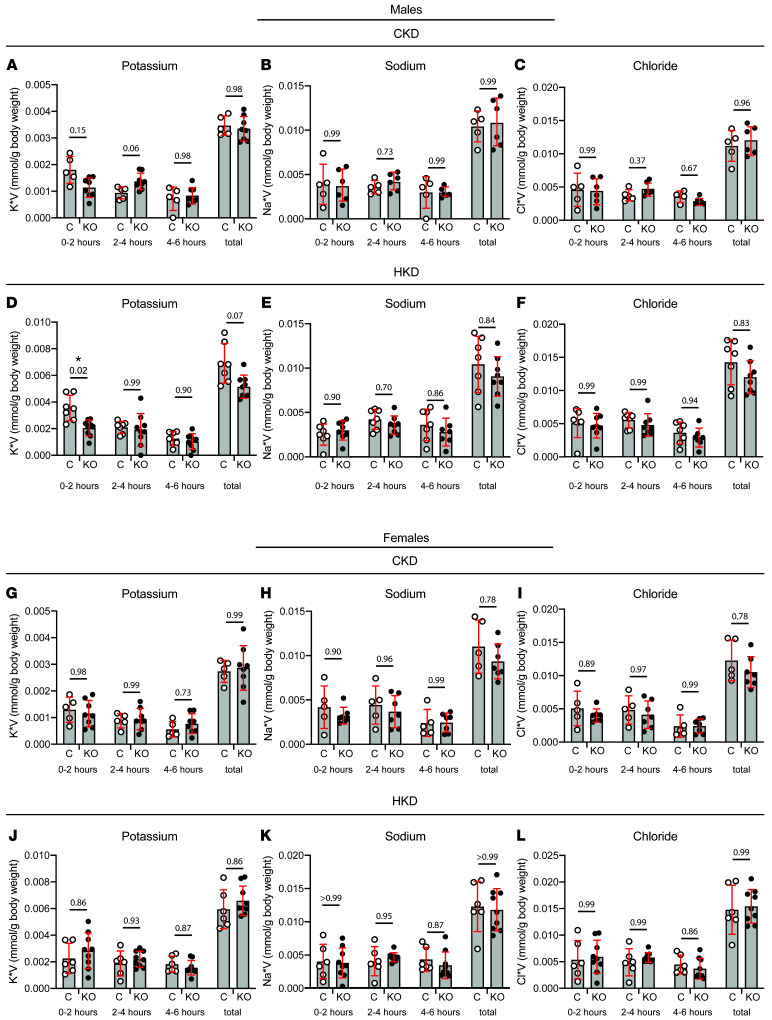
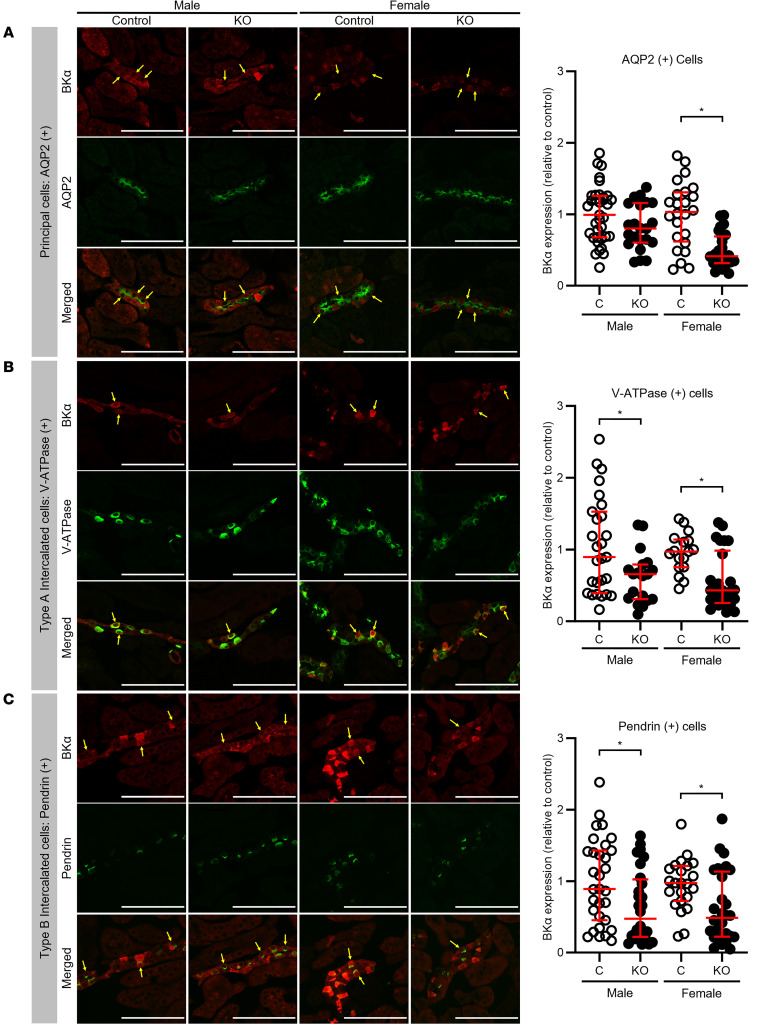
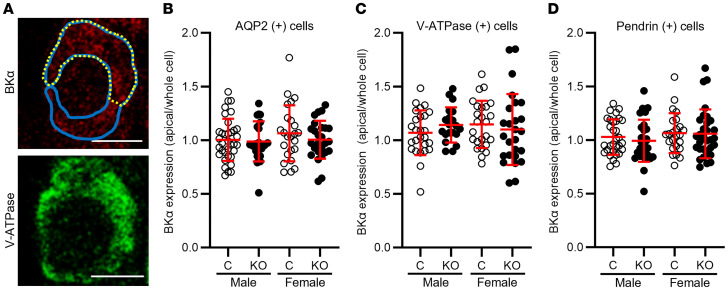
Ca2+-activated BK channels in renal intercalated cells (ICs) mediate luminal flow-induced K+ secretion (FIKS), but how ICs sense increased flow remains uncertain. We examined whether PIEZO1, a mechanosensitive Ca2+-permeable channel expressed in the basolateral membranes of ICs, is required for FIKS. In isolated cortical collecting ducts (CCDs), the mechanosensitive cation-selective channel inhibitor GsMTx4 dampened flow-induced increases in intracellular Ca2+ concentration ([Ca2+]i), whereas the PIEZO1 activator Yoda1 increased [Ca2+]i and BK channel activity. CCDs from mice fed a high-K+ (HK) diet exhibited a greater Yoda1-dependent increase in [Ca2+]i than CCDs from mice fed a control K+ diet. ICs in CCDs isolated from mice with a targeted gene deletion of Piezo1 in ICs (IC-Piezo1-KO) exhibited a blunted [Ca2+]i response to Yoda1 or increased flow, with an associated loss of FIKS in CCDs. Male IC-Piezo1-KO mice selectively exhibited an increased blood [K+] in response to an oral K+ bolus and blunted urinary K+ excretion following a volume challenge. Whole-cell expression of BKα subunit was reduced in ICs of IC-Piezo1-KO mice fed an HK diet. We conclude that PIEZO1 mediates flow-induced basolateral Ca2+ entry into ICs, is upregulated in the CCD in response to an HK diet, and is necessary for FIKS.

Keywords: Calcium channels; Cell biology; Epithelial transport of ions and water; Nephrology; Potassium channels.


Figures

Figure 1
Figure 1. Effect of the PIEZO inhibitor GsMTx4 on luminal flow–induced increases in [Ca2+]i in ICs and PCs in microperfused CCDs.
(A) Representative tracings of fura-2 fluorescence intensity ratios (FIRs), equivalent to [Ca2+]i, in individual PCs and ICs in fura-2–loaded CCDs subjected to an acute increase in tubular flow rate, isolated from male (top) and female (bottom) C57BL/6J mice. In untreated cells, the increase in luminal flow triggered a biphasic response, including an immediate rapid increase in FIR to a peak value followed by a gradual decay to a plateau elevation in FIR. GsMTx4 (5 μM) dampened the flow-induced increase in [Ca2+]i. (B) Summary graph presenting the change in FIRs from baseline for all PCs and ICs studied and mean ± SD in the absence (open circles) and presence (filled circles) of GsMTx4 added to the bath solution. FIR was determined before and at designated intervals after an acute increase in flow rate. n (mice) = 4 male control, 3 male GsMTx4, 3 female control, and 3 female GsMTx4. One CCD was studied per animal, and 8–19 cells studied per CCD. *P < 0.05 vs. presence of GsMTx4 at specific times (seconds), analyzed by 2-tailed unpaired Student’s t test.
Figure 2
Figure 2. Effect of Yoda1 on [Ca2+]i in CCDs isolated from C57BL/6J mice fed a CK or HK diet for 10 days, and microperfused at a very slow flow rate.
(A) Representative traces of the [Ca2+]i responses recorded in individual ICs (red) and PCs (black) before and after addition of Yoda1 (1 μM) to the bath solution. (B) Summary graph showing individual data points and mean ± SD for FIRs, normalized to the baseline FIR, in PCs and ICs measured at 120 seconds (identified by the blue vertical lines in A) after exposure to Yoda1, comparing data from mice fed a CK or HK diet. No significant differences in the response in FIR were detected between individual cell types for a given diet. An HK diet enhanced the Yoda1 responses in both cell types. n = 3 male mice per group; 1 CCD studied per animal and 14–28 cells studied per CCD. *P < 0.05 CK vs. HK diet for a given cell type, analyzed by 2-tailed unpaired Student’s t test.
Figure 3
Figure 3. Effect of Yoda1 on charybdotoxin-sensitive BK channel currents in ICs in C57BL/6J mice fed a CK diet.
Perforated whole-cell patch recordings were performed in cells clamped at +60 mV. The composition of the bath and pipette solutions, which both contained 130 mM K+-gluconate, is given in Supplemental Methods. (A) Representative current tracings in ICs in the absence (top) or presence (bottom) of 5 μM Yoda1. (B) Summary graph showing individual data points and mean ± SD for charybdotoxin-sensitive current density in control and Yoda1-treated ICs, normalized to the average whole-cell membrane capacitance of 13 pF/cell. Currents in ICs treated with Yoda1 (814 ± 71 pA; n = 6 cells) were greater than those in the absence (581 ± 62 pA; n = 6 cells) of the PIEZO1 activator. n = 3 male mice; 4 cells studied per mouse (2 control and 2 Yoda1-treated). *P < 0.001 by 2-tailed unpaired Student’s t test.
Figure 4
Figure 4. Effect of dietary K+ on PIEZO1 expression in Piezo1tdT/tdT mouse CDs.
(A) Representative confocal micrographs of cryosections from Piezo1tdT/tdT mice fed an LK (0.3% NaCl, <0.05% K+), CK (0.3% NaCl, 1% K+), or HK (0.3% NaCl, 5.2% K+ as KCl) diet for 10 days. Sections were colabeled with antibodies directed against AQP2 (green, top) and tdTomato (tdT) (red, middle) to localize endogenous PIEZO1-tdT (15). Merged images (bottom) also show DAPI (nuclei) localization (blue). PCs were identified as AQP2-positive cells, while ICs were identified by their lack of AQP2 expression within the AQP2-positive tubule; representative ICs are outlined by a white line. Scale bars: 10 μm. (B and C) Quantification of PIEZO1-tdT expression (fluorescent signal) in ICs (B) and PCs (C) from mice on an LK, CK, or HK diet. A significant increase in PIEZO1-tdT expression was observed in ICs from mice fed an HK diet, compared with mice on an LK or CK diet, with exact P values shown for each comparison in the figure (mean ± SD; Kruskal-Wallis test, n = 18–25 ICs represented by individual points from n = 4 male mice in each group). A significant increase in PIEZO1-tdT expression was also observed in PCs from mice fed an HK diet, compared with mice on an LK or CK diet, with P values shown for each comparison in the figure (mean ± SD; Kruskal-Wallis test, n = 33–41 PCs represented by individual points from n = 4 male mice in each group). *P < 0.05, ** P < 0.01, ****P < 0.0001.
Figure 5
Figure 5. Expression of Piezo1 mRNA in control and IC-Piezo1-KO mouse ICs.
(A) FISH analysis of Piezo1 (red) and Slc26a4 (green) expression in the indicated mouse strains. Nuclei are stained in blue. Scale bars: 50 μm. The area boxed by a yellow dashed line is magnified in the inset; scale bars: 20 μm. (B) Levels of Piezo1 expression in Slc26a4+ cells were quantified using FISH and expressed as the average number of dots per cell (top) or normalized to data obtained for control animals (bottom). Data are mean ± SD (n = 3 mice per group) and were tested for normality and analyzed by a 2-tailed unpaired t test with Welch’s correction. *P < 0.05.
Figure 6
Figure 6. Effect of targeted deletion of Piezo1 in ICs on flow-induced increases in [Ca2+]i in ICs and PCs in microperfused CCDs isolated from IC-Piezo1-KO and littermate control mice fed a CK or HK diet.
(A and C) Representative tracings of individual PCs and ICs in CCDs from control littermates and KO mice fed a CK (A) or HK (C) diet, before and after an acute increase in tubular flow rate. The FIRs in ICs (red) and PCs (black) in fura-2–loaded CCDs were normalized to the FIR measured immediately before the increase in flow rate. An acute increase in luminal flow rate led to a typical biphasic response in ICs and PCs in control CCDs and in PCs from KO CCDs, but not in ICs in KO CCDs. (B and D) Individual FIRs and means ± SD in PCs and ICs in CCDs isolated from CK-fed (B) and HK-fed (D) mice are shown at specified times after initiation of high luminal flow. The flow-induced increases in [Ca2+]i were virtually absent in ICs in CCDs from KO mice. BL, baseline. For CK diet, n (mice and CCDs) = 3 control (open circles, all male) and 5 KO (filled circles, 3 male, 2 female). For HK diet, n (mice and CCDs) = 4 control (open circles, 2 male, 2 female) and 4 KO (filled circles, 2 male, 2 female). Eight to 21 cells were studied in each CCD. *P ≤ 0.001, KO vs. control, analyzed by 2-tailed unpaired Student’s t test.
Figure 7
Figure 7. Effect of Yoda1 on [Ca2+]i in CCDs isolated from IC-Piezo1-KO mice fed an HK diet and microperfused at a very slow flow rate.
(A) Representative traces of the [Ca2+]i responses recorded in an individual IC (red) and PC (black) before and after the addition of Yoda1 (1 μM) to the bath solution. (B) Summary graph showing individual data points and mean ± SD for FIRs, normalized to the baseline FIR, in PCs and ICs measured at 120 seconds (indicated by blue vertical line in A) after exposure to Yoda1. Yoda1 led to an increase in [Ca2+]i in PCs but the IC response was absent in the KO mice. n = 3 male mice per group; 1 CCD studied per animal and 25–31 cells studied per CCD. *P < 0.05, data were analyzed by 2-tailed unpaired Student’s t test.
Figure 8
Figure 8. Basal and flow-induced JNa and JK in microperfused CCDs isolated from HK-fed IC-Piezo1-KO and control floxed mice.
(A and C) In 6 CCDs from control mice (open circles, 3 male and 3 female), a 5-fold increase in tubular fluid flow rate from 1 (slow) to 5 (fast) nL/min per mm was associated with a significant increase in JNa (A) and JK (C). (A and B) Basal JNa and flow-stimulated JNa were similar in CCDs from the controls compared with 6 KO mice (filled circles, 3 male and 3 female). (C and D) However, FIKS was absent in CCDs from KO male and female mice. Sex-specific transport data are shown in B and D. Data are represented as mean ± SD; *P < 0.05 vs. JNa or JK at 1 nL/min per mm in the same tubules, analyzed by 2-tailed paired Student’s t test. One CCD was studied per mouse.
Figure 9
Figure 9. Male IC-Piezo1-KO mice have higher blood [K+] compared with control mice when challenged with an oral K+ load.
Animals were gavage-fed with 150 μL of solution containing 5% KCl and 2% sucrose, and blood was sampled retroorbitally at 30 and 60 minutes after gavage. Males (A) and females (C) were fed a CK (left) or HK (right) diet for 10 days. For each dietary condition, control animals are shown on the left and KOs on the right. Individual points are shown in gray with a line connecting values from each individual animal. Summary data (mean ± SD) are shown on the outside of individual values for each time point. All groups displayed a decrease in blood [K+] at 60 minutes compared with the 30-minute blood draw, with calculated deltas shown for each group (B and D). Two-way ANOVA with Šidák’s multiple-comparison test (A and C) or Mann-Whitney tests (B and D) were performed to test for significance, defined as P < 0.05. All P values for comparisons between control and KO animals within each dietary condition/time point are displayed on the graphs. The n values were as follows: males: 5 CK controls, 6 CK KO, 6 HK controls, 6 HK KO; females: 6 CK controls, 8 CK KO, 4 HK controls, 5 HK KO.
Figure 10
Figure 10. Male IC-Piezo1-KO mice have decreased urinary K+ excretion compared with control animals in the first 2 hours following a bolus saline injection.
Male and female control and KO mice were weighed and given an intraperitoneal injection of normal saline equal to 10% of body weight. After injection, they were housed individually in wire-bottom metabolic cages to collect urine over 0–2, 2–4, and 4–6 hours. (AC) Control and KO males maintained on CK diet had no difference in their urinary output of K+ (A), Na+ (B), or chloride (C). (D) However, when the males were retested after being given an HK diet for 10 days, KO mice displayed a significant decrease in their urinary K+ excretion within the first 2 hours after injection. (E and F) They displayed no difference in Na+ (E) or chloride (F) excretion. (GL) Female control and KO animals had no differences in their excretion of K+ (G), Na+ (H), or chloride (I) on a CK diet or when the animals were fed an HK diet (JL). Individual data points are shown with bar plots representing mean ± SD. Data were analyzed by 2-way ANOVA with a Greenhouse-Geisser correction to account for unequal variability of differences, followed by Šidák’s multiple-comparison test with significance being set at P < 0.05. P values are shown for the comparison between control and KO animals at each time point. The n values were as follows: males: 5 CK controls, 8 CK KO, 7 HK controls, 9 HK KO; females: 5 CK controls, 8 CK KO, 6 HK controls, 9 HK KO.
Figure 11
Figure 11. Expression of immunodetectable BKα subunit in HK-fed IC-Piezo1-KO mice compared with littermate controls.
BKα subunit expression was assessed by immunofluorescence microscopy in type A and type B ICs and PCs in kidneys from KO and littermate control mice fed an HK diet (see Supplemental Methods). (A) Whole-cell expression of BKα subunit (red) was similar in PCs (identified by apical AQP2 staining; green) in KO (n = 22 cells) and control (n = 35 cells) male mice. However, whole-cell BKα expression was reduced in female KOs (n = 26 cells) versus controls (n = 24 cells). Median and interquartile values were compared using the Mann-Whitney rank sum test. *P ≤ 0.01 vs. control. (B) Whole-cell expression of BKα (red) was reduced in type A ICs (identified by apical V-ATPase staining; green) in male (n = 19 cells) and female (n = 26 cells) KO versus control mice of the same sex (n = 27 and 17 cells, respectively). Median and interquartile values were compared using the Mann-Whitney rank sum test. *P ≤ 0.05 vs. control. (C) Whole-cell expression of BKα was reduced in type B ICs (identified by apical pendrin staining; green) in male (n = 28 cells) and female (n = 28 cells) KO mice relative to control mice of the same sex (n = 31 and 23 cells, respectively). Median and interquartile values were compared using the Mann-Whitney rank sum test. *P ≤ 0.05 vs. control. Scale bars: 100 μm (AC). Sections were analyzed from 3 male and 3 female control mice and 3 male and 3 female KO mice, all fed an HK diet for 10 days.
Figure 12
Figure 12. Relative apical to whole-cell BKα expression in ICs and PCs is not altered in IC-Piezo1-KO mice.
BKα subunit expression was assessed by immunofluorescence microscopy in type A and type B ICs and PCs in kidneys from KO and littermate control mice fed an HK diet (see Supplemental Methods). (A) Example of regions quantified: whole cell (blue) and subapical plus apical (dotted yellow). Scale bars: 5 μm. (BD) The ratio of subapical plus apical to whole-cell expression of BKα was similar in PCs (B) and type A (C) and type B (D) ICs of KO and control mice of both sexes. Data are mean ± SD; comparisons were made by 2-tailed t test. The number of cells for each group is indicated in the legend to Figure 11. Sections were analyzed from 3 male and 3 female control mice and 3 male and 3 female KO mice, all fed an HK diet for 10 days.

Similar articles

Cited by

References

    1. Carrisoza-Gaytan R, et al. The mechanosensitive BKα/β1 channel localizes to cilia of principal cells in rabbit cortical collecting duct (CCD) Am J Physiol Renal Physiol. 2017;312(1):F143–F156. doi: 10.1152/ajprenal.00256.2016. - DOI - PMC - PubMed
    1. Carrisoza-Gaytan R, et al. Intercalated cell BKα subunit is required for flow-induced K+ secretion. JCI Insight. 2020;5(8):e130553. doi: 10.1172/jci.insight.130553. - DOI - PMC - PubMed
    1. Najjar F, et al. Dietary K+ regulates apical membrane expression of maxi-K channels in rabbit cortical collecting duct. Am J Physiol Renal Physiol. 2005;289(4):F922–F932. doi: 10.1152/ajprenal.00057.2005. - DOI - PubMed
    1. Li D, et al. Inhibition of MAPK stimulates the Ca2+-dependent big-conductance K channels in cortical collecting duct. Proc Natl Acad Sci U S A. 2006;103(51):19569–19574. doi: 10.1073/pnas.0609555104. - DOI - PMC - PubMed
    1. Palmer LG, Frindt G. Regulation of apical K channels in rat cortical collecting tubule during changes in dietary K intake. Am J Physiol. 1999;277(5):F805–F812. - PubMed

MeSH terms