. 2024 Apr;64(4):42.
doi: 10.3892/ijo.2024.5630. Epub 2024 Mar 1.

Targeting mitochondrial bioenergetics by combination treatment with imatinib and dichloroacetate in human erythroleukemic K‑562 and colorectal HCT‑116 cancer cells

Affiliations

Targeting mitochondrial bioenergetics by combination treatment with imatinib and dichloroacetate in human erythroleukemic K‑562 and colorectal HCT‑116 cancer cells

Maria G Kakafika et al. Int J Oncol. 2024 Apr.

Abstract

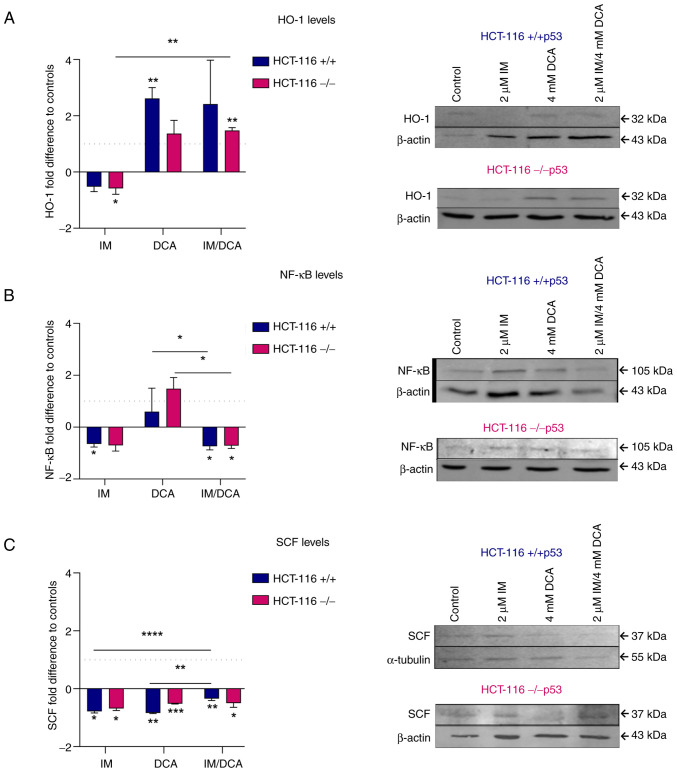
Tumor malignant cells are characterized by dysregulation of mitochondrial bioenergetics due to the 'Warburg effect'. In the present study, this metabolic imbalance was explored as a potential target for novel cancer chemotherapy. Imatinib (IM) downregulates the expression levels of SCΟ2 and FRATAXIN (FXN) genes involved in the heme‑dependent cytochrome c oxidase biosynthesis and assembly pathway in human erythroleukemic IM‑sensitive K‑562 chronic myeloid leukemia cells (K‑562). In the present study, it was investigated whether the treatment of cancer cells with IM (an inhibitor of oxidative phosphorylation) separately, or together with dichloroacetate (DCA) (an inhibitor of glycolysis), can inhibit cell proliferation or cause death. Human K‑562 and IM‑chemoresistant K‑562 chronic myeloid leukemia cells (K‑562R), as well as human colorectal carcinoma cells HCT‑116 (+/+p53) and (‑/‑p53, with double TP53 knock-in disruptions), were employed. Treatments of these cells with either IM (1 or 2 µM) and/or DCA (4 mΜ) were also assessed for the levels of several process biomarkers including SCO2, FXN, lactate dehydrogenase A, glyceraldehyde‑3‑phosphate dehydrogenase, pyruvate kinase M2, hypoxia inducing factor‑1a, heme oxygenase‑1, NF‑κB, stem cell factor and vascular endothelial growth factor via western blot analysis. Computational network biology models were also applied to reveal the connections between the ten proteins examined. Combination treatment of IM with DCA caused extensive cell death (>75%) in K‑562 and considerable (>45%) in HCT‑116 (+/+p53) cultures, but less in K‑562R and HCT‑116 (‑/‑p53), with the latter deficient in full length p53 protein. Such treatment, markedly reduced reactive oxygen species levels, as measured by flow‑cytometry, in K‑562 cells and affected the oxidative phosphorylation and glycolytic biomarkers in all lines examined. These findings indicated, that targeting of cancer mitochondrial bioenergetics with such a combination treatment was very effective, although chemoresistance to IM in leukemia and the absence of a full length p53 in colorectal cells affected its impact.

Keywords: HCT‑116; K‑562; Warburg effect; bioenergetics; cancer; dichloroacetate; imatinib; mitochondria.


Conflict of interest statement

The authors declare that they have no competing interests.

Figures

Figure 1
Figure 1
Schematic illustration of the major biochemical processes occurring in the mitochondrial OxPhos and glycolysis in cancer cells. (A) IM inhibits the expression of SCO2 and FXN involved in OxPhos, while (B) DCA inhibits the PDK that activates the PDC. PDC catalyzes the oxidative decarboxylation of pyruvate to acetyl-CoA during glycolysis. IM and DCA are shown in closed circles. OxPhos, oxidative phosporylation; IM, imatinib; SCO2, synthesis of cytochrome c oxidase 2; FXN, frataxin; DCA, dichloroacetate; PDK, pyruvate dehydrogenase kinase; PDC, pyruvate dehydrogenase complex; acetyl-CoA, acetyl coenzyme A.
Figure 2
Figure 2
Cell proliferation and death in IM-, DCA- or IM/DCA-treated K-562 and K-562R cell cultures. Cells were seeded at 1×10⁵ cells/ml and left untreated or were treated with 1 or 2 μM IM (blue bars), 4 mM DCA (gray bars), or both IM/DCA (pink bars) for 72 h. (A and B) Cell proliferation and (C and D) death were measured in each culture as described in the materials and methods section. Each bar represents the mean value of at least a triplicate of experiments. (A) K-562 proliferation: Control-1 μM IM, P=0.0006; control-2 μM, IM P=0.0043; control-DCA, P=0.0340; control-1 μM IM/DCA, P=0.0006; control-2 μM IM/DCA, P=0.0045; 1 μM IM-2 μM IM, P=0.0397; 1 μM IM/DCA-DCA, P=0.0146. (B) K-562R proliferation: Control-1 μM IM, P=0.0089; control-2 μM IM, P=0.0047; control-DCA, P=0.0160; control-1 μM IM/DCA, P=0.0071; control-2 μM IM/DCA, P=0.0032. (C) K-562 death: Control-1 μM IM, P=0.0018; control-2 μM IM, P=0.0008; control-DCA, P=0.0134; control-1 μM IM/DCA, P=0.0009; control-2 μM IM/DCA, P=0.0018; 1 μM IM-2 μM IM, P=0.0099; 1 μM IM/DCA-DCA, P= 0.0059; 2 μM IM/DCA-DCA, P= 0.0015). (D) K-562R death: Control-1 μM IM, P= 0.0315; control-2 μM IM, P= 0.0091; control-DCA, P=0.0016; control-1 μM IM/DCA, P=0.0129; control-2 μM IM/DCA, P=0.0134. *P≤0.05, **P≤0.01 and ***P≤0.001. IM, imatinib; DCA, dichloroacetate.
Figure 3
Figure 3
Exploration of the effects of IM, DCA or both on the synthesis of SCO2 and FXN in K-562 and K-562R cells by WB analysis and band densitometry. Cells in each culture were seeded at 2-4×10⁵ cells/ml and treated with IM, DCA or both agents for 72 h. Mitochondrial protein lysates from control (untreated) and drug-treated K-562 (blue bars) and K-562R (pink bars) cells were analyzed by WB analysis using 30 μg of total lysate per lane and antibodies against the human SCO2 and FXN proteins. β-actin was used as internal marker. The quantification was based on band densitometry and normalization between the proteins of interest and the house keeper marker assessed. The levels shown represent mean values from at least triplicate biological experiments. (A) SCO2: (K-562: Control-1 μM IM, P=0.0393; control-2 μM IM, P=0.0165; control-1 μM IM/DCA, P=0.0057; control-2 μM IM/DCA, P=0.0418); (K-562R: Control-2 μM IM, P=0.0017; control-DCA, P=0.0306; control-1 μM IM/DCA, P=0.0400; control-2 μM IM/DCA, P=0.0094). (B) FXN: (K-562: Control-1 μM IM, P=0.0280; control-2 μM IM, P=0.0201; control-1 μM IM/DCA, P=0.0055; control-2 μM IM/DCA, P=0.0210); (K-562R: Control-DCA, P=0.0060; control-1 μM IM/DCA, P=0.0136; control-2 μM IM/DCA, P=0.0055). *P≤0.05 and **P≤0.01. IM, imatinib; DCA, dichloroacetate; SCO2, synthesis of cytochrome c oxidase 2; FXN, frataxin; WB, western blot.
Figure 4
Figure 4
Assessment of the effects of IM, DCA or both on the synthesis of LDHA, GAPDH and PKM2 in K-562 and K-562R cells by WB analysis and band densitometry. Cells in each culture were seeded at 2-4×10⁵ cells/ml and treated with IM, DCA or both agents for 72 h. Control (untreated) and drug-treated K-562 (blue bars) and K-562R (pink bars) cells were assessed by WB analysis using 30 μg of total lysate per lane and antibodies against the human LDHA, GAPDH and PKM2 proteins. β-actin and α-tubulin were used as internal markers. The quantification was based on band densitometry and normalization between the proteins of interest and the house keeper marker assessed. The levels shown represent mean values from at least triplicate biological experiments. (A) LDHA: (K-562: Control-1 μM IM, P=0.0195; control-2 μM IM, P=0.0074; control-1 μM IM/DCA, P=0.0121; control-2 μM IM/DCA, P=0.0027); (K-562R: Control-1 μM IM, P=0.0195; control-2 μM IM, P=0.0361; control-DCA, P=0.0102; control-1 μM IM/DCA, P=0.0171; control-2 μM IM/DCA, P=0.0186). (B) GAPDH: (K-562: Control-1 μM IM, P=0.0170; control-2 μM IM/DCA, P=0.0049); (K-562R: Control-1 μM IM, P=0.0170; control-2 μM IM, P=0.0218; control-DCA, P=0.0095). (C) PKM2: (K-562: Control-1 μM IM, P=0.0282; control-2 μM IM, P=0.0092; control-2 μM IM/DCA, P=0.0433); (K-562R: Control-1 μM IM, P=0.0134; control-2 μM IM, P=0.0199; control-DCA, P=0.0186; control-2 μM IM/DCA, P=0.0197)]. *P≤0.05 and **P≤0.01. IM, imatinib; DCA, dichloroacetate; LDHA, lactate dehydrogenase A; GAPDH, glyceraldehyde-3-phosphate dehydrogenase; PKM2, pyruvate kinase M2; WB, western blot.
Figure 5
Figure 5
Illustration of the effects of IM, DCA or both on the synthesis of HIF1a, NF-κB, SCF and VEGF in K-562 and K-562R cells by WB analysis and band densitometry. Cells in each culture were seeded at 2-4×10⁵ cells/ml and treated with IM, DCA or both agents for 72 h. Control (untreated) and drug-treated K-562 (blue bars) and K-562R (pink bars) cells were assessed by WB analysis using 30 μg of total lysate per lane and antibodies against the human HIF1a, NF-κB, SCF and VEGF proteins. β-actin was used as internal marker. The quantification was based on band densitometry and normalization between the proteins of interest and the house keeper marker assessed. The levels shown represent mean values from at least triplicate biological experiments. (A) HIF1a: (K-562: Control-1 μM IM, P=0.0113; control-2 μM IM, P=0.0089; control-1 μM IM/DCA, P=0.0150; control-2 μM IM/DCA, P=0.0098); (K-562R: Control-1 μM IM/DCA, P=0.00372). (B) NF-κB: (K-562: Control-1 μM IM, P=0.019; control-2 μM IM, P=0.0429; control-1 μM IM/DCA, P=0.0170); (K-562R: Control-1 μM IM, P=0.0113; control-2 μM IM, P=0.0089; control-1 μM IM/DCA, P=0.0150; control-2 μM IM/DCA, P=0.0098). (C) SCF: (K-562: Control-1 μM IM, P=0.0308; control-2 μM IM, P=0.0010; control-1 μM IM/DCA, P=0.0032; control-1 μM IM/DCA, P=0.0253; control-2 μM IM/DCA, P=0.0018); (K-562R: Control-DCA, P=0.00345; control-2 μM IM/DCA, P=0.0098). (D) VEGF: (K-562: Control-1 μM, IM P=0.0118; control-2 μM IM, P=0.0056; control-1μM IM/DCA, P=0.0226; control-2 μM IM/DCA, P=0.0395); (K-562R: Control-1 μM IM, P=0.0134; control-2 μM IM, P=0.0016; Control-2 μM IM/DCA, P=0.0496). *P≤0.05 and **P≤0.01. IM, imatinib; DCA, dichloroacetate; HIF-1a, hypoxia inducing factor-1a; NF-κB, nuclear factor kappa-light-chain-enhancer of activated B cells; SCF, stem cell factor; VEGF, vascular endothelial growth factor; WB, western blot.
Figure 6
Figure 6
Assessment of the effects of IM, DCA or both on the endogenous production of ROS in K-562 and K-562R cells by flow cytometry. IM and DCA elicit distinct redox disruptions in K-562 and K-562R Imatinib-resistant cells. Violin plots of flow cytometry measurements of DCFDA for overall endogenous ROS production from (A) K-562 and (B) K-562R IM-resistant cells, treated with IM and/or DCA. Statistical associations of drug perturbations have been tested with repeated measures ANOVA in R programming language. IM, imatinib; DCA, dichloroacetate; ROS, reactive oxygen species; DCFDA, 2′,7′-dichlorofluorescein diacetate; FCM, flow cytometry; FC, fold change differences for the various treatments compared with the control-untreated-unperturbed cell state.
Figure 7
Figure 7
Cell proliferation and death in IM, DCA or IM/DCA treated HCT-116 (+/+p53) and HCT-116 (−/−p53) adherent cell cultures. Cells were seeded at 3×10⁵ cells/ml and left untreated or were treated with 2 μM IM (blue bars), 4 mM DCA (gray bars), or both IM/DCA (2 μM + 4 mM) (pink bars) for 72 h. (A and B) Cell proliferation and (C and D) death were measured in each culture as described in the materials and methods section. Each bar represents the mean value of at least a triplicate of experiments. (A) HCT-116 (+/+p53) proliferation: Control-IM, P=0.0383; control-DCA, P=0.0314; control-IM/DCA, P=0.0048; IM-IM/DCA, P=0.0151. (B) HCT-116 (−/−p53) proliferation: Control-IM, P=0.0237; control-DCA, P=0.0085; Control-IM/DCA, P=0.0166. (C) HCT-116 (+/+p53) death: Control-IM/DCA, P=0.0004. (D) HCT-116 (−/−p53) death: (Control-DCA, P=0.0042; control-IM/DCA, P=0.0042). *P≤0.05, **P≤0.01 and ***P≤0.001. IM, imatinib; DCA, dichloroacetate.
Figure 8
Figure 8
Exploration of the effects of IM, DCA or both on the synthesis of SCO2 and FXN in HCT-116 (+/+p53) and HCT-116 (−/−p53) cells by WB analysis and band densitometry. Cells in each culture were seeded at 3×10⁵ cells/ml and treated with 2 μM IM, 4 mM DCA or both IM/DCA (2 μM + 4 mM) for 72 h. Mitochondrial protein lysates from control (untreated) and drug-treated HCT-116 (+/+p53) (blue bars) and HCT-116 (−/−p53) (pink bars) cells were assessed by WB analysis using 40 μg of total lysate per lane and antibodies against the human SCO2 and FXN proteins. β-actin was used as internal marker. The quantification was based on band densitometry and normalization between the proteins of interest and the house keeper marker assessed. The levels shown represent mean values from at least triplicate biological experiments. (A) SCO2: [HCT-116 (+/+p53): Control-IM, P=0.0319; control-DCA, P=0.0119; control-IM/DCA, P=0.0142; IM-IM/DCA, P=0.0001]; [HCT-116 (−/−p53): Control-IM, P=0.0063; control-IM/DCA, P=0.0102; IM-IM/DCA, P=0.0354]. (B) FXN: [HCT-116 (+/+p53): Control-DCA, P=0.0011; control-IM/DCA, P=0.0365; IM-IM/DCA, P=0.0421]; [HCT-116 (−/−p53): Control-IM, P=0.0016; control-DCA, P=0.0182; control-IM/DCA, P=0.021; IM-IM/DCA, P=0.0087; DCA-IM/DCA, P=0.0439]. *P≤0.05, **P≤0.01 and ***P≤0.001. IM, imatinib; DCA, dichloroacetate; SCO2, synthesis of cytochrome c oxidase 2; FXN, frataxin; WB, western blot.
Figure 9
Figure 9
Examination of the effects of IM, DCA or both on the synthesis of LDHA, GAPDH and PKM2 in HCT-116 (+/+p53) and HCT-116 (−/−p53) cells by WB analysis and band densitometry. Cells in each culture were seeded at 3×10⁵ cells/ml and treated with 2 μM IM, 4 mM DCA or both IM/DCA (2 μM + 4 mM) for 72 h. Control (untreated) and drug-treated HCT-116 (+/+p53) (blue bars) and HCT-116 (−/−p53) (pink bars) cells were assessed by WB analysis using 40 μg of total lysate per lane and antibodies against the human LDHA, GAPDH and PKM2 proteins. β-actin and α-tubulin were used as internal markers. The quantification was based on band densitometry and normalization between the proteins of interest and the house keeper marker assessed. The levels shown represent mean values from at least triplicate biological experiments. (A) LDHA: [HCT-116 (+/+p53): Control-DCA, P=0.043; control-IM/DCA, P=0.0058); HCT-116 (−/−p53): Control-DCA, P=0.0457; control-IM/DCA, P=0.0433]. (B) GAPDH: [HCT-116 (+/+p53): Control-IM, P=0.0094; control-DCA, P=0.0294; control-IM/DCA, P=0.0225; IM-IM/DCA, P=0.0215; DCA-IM/DCA, P=0.0312; HCT-116 (−/−p53) IM-IM/DCA, P=0.0475; DCA-IM/DCA, P=0.0241] (C) PKM2: [HCT-116 (+/+p53): Control-IM/DCA, P=0.0498]. *P≤0.05 and **P≤0.01. IM, imatinib; DCA, dichloroacetate; LDHA, lactate dehydrogenase A; GAPDH, glyceraldehyde-3-phosphate dehydrogenase; PKM2, pyruvate kinase M2; WB, western blot.
Figure 10
Figure 10
Illustration of the effects of IM, DCA or both on the synthesis of HO-1, NF-κB and SCF in HCT-116 (+/+p53) and HCT-116 (−/−p53) cells by WB analysis and band densitometry. Cells in each culture were seeded at 3×10⁵ cells/ml and treated with 2 μM IM, 4 mM DCA or both IM/DCA (2 μM + 4 mM) for 72 h. Control (untreated) and drug-treated HCT-116 (+/+p53) (blue bars) and HCT-116 (−/−p53) (pink bars) cells were assessed by WB analysis using 40 μg of total lysate per lane and antibodies against the human HO-1, NF-κB and SCF proteins. β-actin and α-tubulin were used as internal markers. The quantification was based on band densitometry and normalization between the proteins of interest and the house keeper marker assessed. The levels shown represent mean values from at least triplicate biological experiments. (A) HO-1: [HCT-116 (+/+p53): Control-DCA, P=0.0007; HCT-116 (−/−p53): Control-IM, P=0.0405; control-IM/DCA, P=0.0012; IM-IM/DCA, P=0.0093] (B) NF-κB: [HCT-116 (+/+p53): Control-IM, P=0.0196; control-IM/DCA, P=0.0496; DCA-IM/DCA, P=0.0349; HCT-116 (−/−p53): control-IM/DCA, P=0.0152; DCA-IM/DCA, P=0.0355]. (C) SCF: [HCT-116 (+/+p53): Control-IM, P=0.0274; control-DCA, P=0.0059; control-IM/DCA, P=0.0093; IM-IM/DCA, P=0.0056; DCA-IM/DCA, P=0.0147; HCT-116 (−/−p53): Control-IM, P=0.0289; Control-DCA, P=0.0002; control-IM/DCA, P=0.0494]. *P≤0.05, **P≤0.01, ***P≤0.001 and ****P≤0.0001. IM, imatinib; DCA, dichloroacetate; HO-1, heme oxygenase-1; NF-κB, nuclear factor kappa-light-chain-enhancer of activated B cells; SCF, stem cell factor; VEGF, vascular endothelial growth factor; WB, western blot.

Similar articles

References

    1. Hanahan D, Weinberg RA. The hallmarks of cancer. Cell. 2000;100:57–70. doi: 10.1016/S0092-8674(00)81683-9. - DOI - PubMed
    1. Hanahan D, Weinberg RA. Hallmarks of cancer: The next generation. Cell. 2011;144:646–674. doi: 10.1016/j.cell.2011.02.013. - DOI - PubMed
    1. Bartman CR, Weilandt DR, Shen Y, Lee WD, Han Y, TeSlaa T, Jankowski CSR, Samarah L, Park NR, da Silva-Diz V, et al. Slow TCA flux and ATP production in primary solid tumours but not metastases. Nature. 2023;614:349–357. doi: 10.1038/s41586-022-05661-6. - DOI - PMC - PubMed
    1. Schwartz L, Supuran CT, Alfarouk KO. The warburg effect and the hallmarks of cancer. Anticancer Agents Med Chem. 2017;17:164–170. doi: 10.2174/1871520616666161031143301. - DOI - PubMed
    1. Alam MM, Lal S, FitzGerald KE, Zhang L. A holistic view of cancer bioenergetics: Mitochondrial function and respiration play fundamental roles in the development and progression of diverse tumors. Clin Transl Med. 2016;5:3. doi: 10.1186/s40169-016-0082-9. - DOI - PMC - PubMed

MeSH terms