

Physiological characterization of single-gene lysis proteins
- PMID: 38426721
- PMCID: PMC10955853
- DOI: 10.1128/jb.00384-23
Physiological characterization of single-gene lysis proteins
Abstract
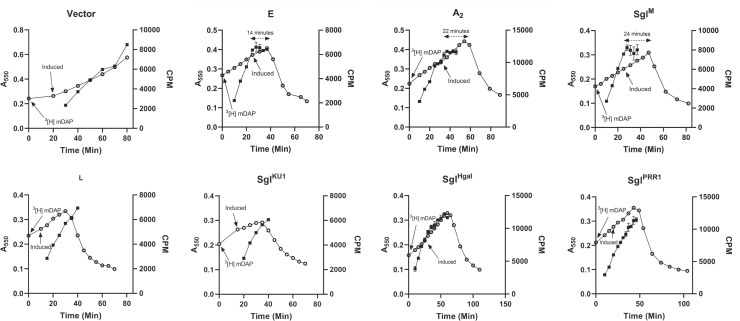
Single-strand RNA (ssRNA) and single-strand DNA phages elicit host lysis using a single gene, in each case designated as sgl. Of the 11 identified Sgls, three have been shown to be specific inhibitors of different steps in the pathway that supplies lipid II to the peptidoglycan (PG) biosynthesis machinery. These Sgls have been called "protein antibiotics" because the lytic event is a septal catastrophe indistinguishable from that caused by cell wall antibiotics. Here, we designate these as type I Sgls. In this formalism, the other eight Sgls are assigned to type II, the best-studied of which is protein L of the paradigm F-specific ssRNA phage MS2. Comparisons have suggested that type II Sgls have four sequence elements distinguished by hydrophobic and polar character. Environmental metatranscriptomics has revealed thousands of new ssRNA phage genomes, each of which presumably has an Sgl. Here, we describe methods to distinguish type I and type II Sgls. Using phase contrast microscopy, we show that both classes of Sgls cause the formation of blebs prior to lysis, but the location of the blebs differs significantly. In addition, we show that L and other type II Sgls do not inhibit the net synthesis of PG, as measured by radio-labeling of PG. Finally, we provide direct evidence that the Sgl from Pseudomonas phage PP7 is a type I Sgl, in support of a recent report based on a genetic selection. This shows that the putative four-element sequence structure suggested for L is not a reliable discriminator for the operational characterization of Sgls.
Importance: The ssRNA phage world has recently undergone a metagenomic expansion upward of a thousandfold. Each genome likely carries at least one single-gene lysis (sgl) cistron encoding a protein that single-handedly induces host autolysis. Here, we initiate an approach to segregate the Sgls into operational types based on physiological analysis, as a first step toward the alluring goal of finding many new ways to induce bacterial death and the attendant expectations for new antibiotic development.
Keywords: bacteriophage evolution; bacteriophage lysis; bacteriophages.
Conflict of interest statement
The authors declare no conflict of interest.
Figures


Update of
-
Physiological characterization of single gene lysis proteins.bioRxiv [Preprint]. 2023 Oct 16:2023.10.16.562596. doi: 10.1101/2023.10.16.562596. bioRxiv. 2023. Update in: J Bacteriol. 2024 Mar 21;206(3):e0038423. doi: 10.1128/jb.00384-23. PMID: 37905155 Free PMC article. Updated. Preprint.
Similar articles
-
Physiological characterization of single gene lysis proteins.bioRxiv [Preprint]. 2023 Oct 16:2023.10.16.562596. doi: 10.1101/2023.10.16.562596. bioRxiv. 2023. Update in: J Bacteriol. 2024 Mar 21;206(3):e0038423. doi: 10.1128/jb.00384-23. PMID: 37905155 Free PMC article. Updated. Preprint.
-
Single-gene lysis in the metagenomic era.Curr Opin Microbiol. 2020 Aug;56:109-117. doi: 10.1016/j.mib.2020.09.015. Epub 2020 Oct 16. Curr Opin Microbiol. 2020. PMID: 33075663 Free PMC article. Review.
-
Phage single-gene lysis: Finding the weak spot in the bacterial cell wall.J Biol Chem. 2019 Mar 8;294(10):3350-3358. doi: 10.1074/jbc.TM118.001773. Epub 2018 Nov 12. J Biol Chem. 2019. PMID: 30420429 Free PMC article. Review.
-
Multicopy suppressor screens reveal convergent evolution of single-gene lysis proteins.Nat Chem Biol. 2023 Jun;19(6):759-766. doi: 10.1038/s41589-023-01269-7. Epub 2023 Feb 20. Nat Chem Biol. 2023. PMID: 36805702 Free PMC article.
-
Expression of a Peptidoglycan Hydrolase from Lytic Bacteriophages Atu_ph02 and Atu_ph03 Triggers Lysis of Agrobacterium tumefaciens.Appl Environ Microbiol. 2017 Nov 16;83(23):e01498-17. doi: 10.1128/AEM.01498-17. Print 2017 Dec 1. Appl Environ Microbiol. 2017. PMID: 28970228 Free PMC article.
References
Publication types
MeSH terms
Substances
Grants and funding
LinkOut - more resources
Full Text Sources
