Bisphenol A exposure affects specific gut taxa and drives microbiota dynamics in childhood obesity
- PMID: 38426791
- PMCID: PMC10949422
- DOI: 10.1128/msystems.00957-23
Bisphenol A exposure affects specific gut taxa and drives microbiota dynamics in childhood obesity
Abstract
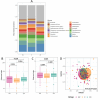
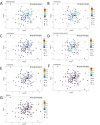
Cumulative xenobiotic exposure has an environmental and human health impact which is currently assessed under the One Health approach. Bisphenol A (BPA) exposure and its potential link with childhood obesity that has parallelly increased during the last decades deserve special attention. It stands during prenatal or early life and could trigger comorbidities and non-communicable diseases along life. Accumulation in the nature of synthetic chemicals supports the "environmental obesogen" hypothesis, such as BPA. This estrogen-mimicking xenobiotic has shown endocrine disruptive and obesogenic effects accompanied by gut microbiota misbalance that is not yet well elucidated. This study aimed to investigate specific microbiota taxa isolated and selected by direct BPA exposure and reveal its role on the overall children microbiota community and dynamics, driving toward specific obesity dysbiosis. A total of 333 BPA-resistant isolated species obtained through culturing after several exposure conditions were evaluated for their role and interplay with the global microbial community. The selected BPA-cultured taxa biomarkers showed a significant impact on alpha diversity. Specifically, Clostridium and Romboutsia were positively associated promoting the richness of microbiota communities, while Intestinibacter, Escherichia-Shigella, Bifidobacterium, and Lactobacillus were negatively associated. Microbial community dynamics and networks analyses showed differences according to the study groups. The normal-weight children group exhibited a more enriched, structured, and connected taxa network compared to overweight and obese groups, which could represent a more resilient community to xenobiotic substances. In this sense, subnetwork analysis generated with the BPA-cultured genera showed a correlation between taxa connectivity and more diverse potential enzymatic BPA degradation capacities.IMPORTANCEOur findings indicate how gut microbiota taxa with the capacity to grow in BPA were differentially represented within differential body mass index children study groups and how these taxa affected the overall dynamics toward patterns of diversity generally recognized in dysbiosis. Community network and subnetwork analyses corroborated the better connectedness and stability profiles for normal-weight group compared to the overweight and obese groups.
Keywords: BPA; amplicon-sequencing; culturomics; microbiota; obesity; xenobiotics.
Conflict of interest statement
The authors declare no conflict of interest.
Figures


Similar articles
-
Impact of Ex Vivo Bisphenol A Exposure on Gut Microbiota Dysbiosis and Its Association with Childhood Obesity.J Xenobiot. 2025 Jan 17;15(1):14. doi: 10.3390/jox15010014. J Xenobiot. 2025. PMID: 39846546 Free PMC article.
-
Culturing and Molecular Approaches for Identifying Microbiota Taxa Impacting Children's Obesogenic Phenotypes Related to Xenobiotic Dietary Exposure.Nutrients. 2022 Jan 6;14(2):241. doi: 10.3390/nu14020241. Nutrients. 2022. PMID: 35057422 Free PMC article.
-
Perinatal bisphenol A exposure impairs gut microbial colonization: Implications for offspring obesity and neurodevelopment.Ecotoxicol Environ Saf. 2025 Jun 15;298:118295. doi: 10.1016/j.ecoenv.2025.118295. Epub 2025 May 10. Ecotoxicol Environ Saf. 2025. PMID: 40349470
-
Bisphenol a: A narrative review of prenatal exposure effects on adipogenesis and childhood obesity via peroxisome proliferator-activated receptor gamma.Environ Res. 2019 Jun;173:54-68. doi: 10.1016/j.envres.2019.03.012. Epub 2019 Mar 6. Environ Res. 2019. PMID: 30897403 Free PMC article. Review.
-
Bisphenol A (BPA) Leading to Obesity and Cardiovascular Complications: A Compilation of Current In Vivo Study.Int J Mol Sci. 2022 Mar 9;23(6):2969. doi: 10.3390/ijms23062969. Int J Mol Sci. 2022. PMID: 35328389 Free PMC article. Review.
Cited by
-
Real-world bisphenol A exposure not linked to microbiota dynamics in childhood obesity.mSystems. 2024 Jul 23;9(7):e0055624. doi: 10.1128/msystems.00556-24. Epub 2024 Jul 3. mSystems. 2024. PMID: 38958482 Free PMC article. No abstract available.
-
Ultra-Processed Food Consumption as a Risk Factor for Gastrointestinal Cancer and Other Causes of Mortality in Southern Italy: A Competing Risk Approach.Nutrients. 2024 Jun 23;16(13):1994. doi: 10.3390/nu16131994. Nutrients. 2024. PMID: 38999742 Free PMC article.
-
Analysis of Human Gut Microbiota Enzymes for Biotechnological and Food Industrial Applications.Foods. 2025 May 18;14(10):1794. doi: 10.3390/foods14101794. Foods. 2025. PMID: 40428573 Free PMC article.
-
Multi-omics approach in gut and environmental microbiota research under the One Health concept.EFSA J. 2024 Dec 20;22(Suppl 1):e221104. doi: 10.2903/j.efsa.2024.e221104. eCollection 2024 Dec. EFSA J. 2024. PMID: 39712914 Free PMC article.
-
Impact of Ex Vivo Bisphenol A Exposure on Gut Microbiota Dysbiosis and Its Association with Childhood Obesity.J Xenobiot. 2025 Jan 17;15(1):14. doi: 10.3390/jox15010014. J Xenobiot. 2025. PMID: 39846546 Free PMC article.
References
MeSH terms
Substances
Grants and funding
- EUFORA/GP/EFSA/ENCO/2021/01/European Food Safety Authority (EFSA)
- MARIA ZAMBRANO Next Generation EU/UGR | Vicerrectorado de Investigación y Transferencia, Universidad de Granada (Office of Vice-Rector for Research and Knowledge Transfer, University of Granada)
- Proyectos-Excelencia: P21-00341 DiETOXµBio/Consejería de Universidad, Investigación e Innovación, Junta de Andalucía (Ministry of Knowledge, Research and University, Andalusia)
LinkOut - more resources
Full Text Sources
Medical

