. 2024 Jun;67(6):1095-1106.
doi: 10.1007/s00125-024-06116-5. Epub 2024 Mar 1.

Metabolic effect of adrenaline infusion in people with type 1 diabetes and healthy individuals

Affiliations

Metabolic effect of adrenaline infusion in people with type 1 diabetes and healthy individuals

Rui She et al. Diabetologia. 2024 Jun.

Abstract

Aims/hypothesis: As a result of early loss of the glucagon response, adrenaline is the primary counter-regulatory hormone in type 1 diabetes. Diminished adrenaline responses to hypoglycaemia due to counter-regulatory failure are common in type 1 diabetes, and are probably induced by exposure to recurrent hypoglycaemia, however, the metabolic effects of adrenaline have received less research attention, and also there is conflicting evidence regarding adrenaline sensitivity in type 1 diabetes. Thus, we aimed to investigate the metabolic response to adrenaline and explore whether it is modified by prior exposure to hypoglycaemia.

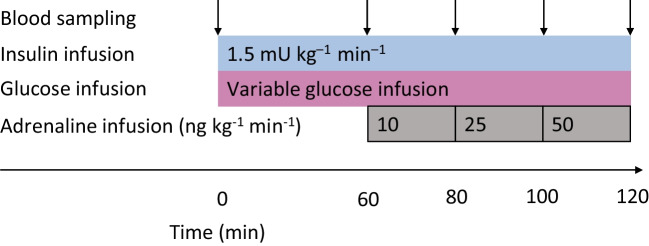
Methods: Eighteen participants with type 1 diabetes and nine healthy participants underwent a three-step ascending adrenaline infusion during a hyperinsulinaemic-euglycaemic clamp. Continuous glucose monitoring data obtained during the week before the study day were used to assess the extent of hypoglycaemia exposure.

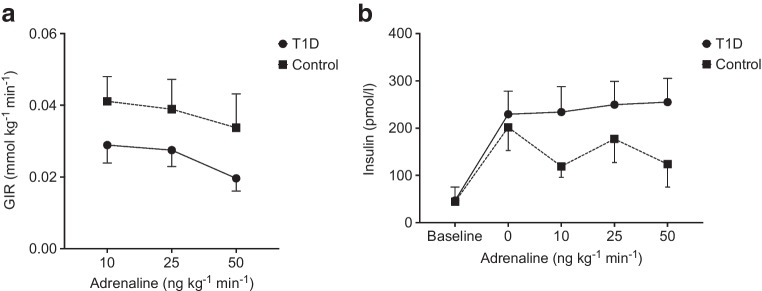
Results: While glucose responses during the clamp were similar between people with type 1 diabetes and healthy participants, plasma concentrations of NEFAs and glycerol only increased in the group with type 1 diabetes (p<0.001). Metabolomics revealed an increase in the most common NEFAs (p<0.01). Other metabolic responses were generally similar between participants with type 1 diabetes and healthy participants. Exposure to hypoglycaemia was negatively associated with the NEFA response; however, this was not statistically significant.

Conclusions/interpretation: In conclusion, individuals with type 1 diabetes respond with increased lipolysis to adrenaline compared with healthy participants by mobilising the abundant NEFAs in plasma, whereas other metabolic responses were similar. This may suggest that the metabolic sensitivity to adrenaline is altered in a pathway-specific manner in type 1 diabetes.

Trial registration: ClinicalTrials.gov NCT05095259.

Keywords: Clinical diabetes; Hypoglycaemia; Metabolic physiology in vivo; Metabolomics; Other hormones/action; Pathophysiology/metabolism.


Figures

Fig. 1
Fig. 1
Experimental design. All participants underwent a hyperinsulinaemic–euglycaemic clamp. Blood samples were taken before the clamp (baseline, time 0), 1 h after the start of the clamp (0 ng kg−1 min−1) and three times during the stepwise adrenaline infusion (10–50 ng kg−1 min−1). Blood samples for untargeted metabolomics profiling were taken before the initiation of the hyperinsulinaemic–euglycaemic clamp (baseline), 1 h after the start of the clamp and 20 min after the last infusion
Fig. 2
Fig. 2
(a) Mean glucose infusion rate (GIR) at each step of the adrenaline infusion. (b) Mean plasma insulin levels before the hyperinsulinaemic–euglycaemic clamp (baseline), 1 h after the start of the clamp (0 ng kg−1 min−1) and during the stepwise adrenaline infusion (10–50 ng kg−1 min−1). Error bars indicate the SEM. Circles with a solid line represent participants with type 1 diabetes; squares with a dotted line represent healthy control participants
Fig. 3
Fig. 3
Plasma concentrations of adrenaline (a), noradrenaline (b) and glucagon (c) before the clamp (baseline), 1 h after the start of the clamp (0 ng kg−1 min−1) and during the stepwise adrenaline infusion (10–50 ng kg−1 min−1). Error bars indicate the SEM. Circles with a solid line represent participants with type 1 diabetes; squares with a dotted line represent healthy control participants
Fig. 4
Fig. 4
(a) PG iAUC at each step of the adrenaline infusion. (b, c) Plasma NEFA (b) and glycerol (c) levels before the clamp (baseline), 1 h after the start of the clamp (0 ng kg−1 min−1) and during the stepwise adrenaline infusion (10–50 ng kg−1 min−1). Error bars indicate the SEM. Circles with a solid line represent participants with type 1 diabetes; squares with a dotted line represent healthy control participants. Between-group analysis, *p≤0.05; type 1 diabetes within-group analysis, †††p≤0.001 µmol/l
Fig. 5
Fig. 5
Forest plot of the metabolites that responded to adrenaline in participants with type 1 diabetes. Blue points and error bars indicate the response to the hyperinsulinaemic–euglycaemic clamp (from baseline to 0 ng kg−1 min−1). Purple points and error bars indicate the metabolic response to the whole stepwise adrenaline infusion protocol (the total response from baseline to 20 min after the last infusion of 50 ng kg−1 min−1). Grey bars indicate the difference between the two metabolic responses (i.e. how metabolite levels respond to adrenaline from the hyperinsulinaemic state). ‘Synergistic’ response indicates a metabolic response to the clamp and the adrenaline infusion in the same direction (solid grey bar). ‘Reverse’ response indicates a response that goes in the opposite direction (dotted grey bar). ‘Compensatory’ response indicates a reverse response without crossing the baseline concentration (dashed grey bar). Estimates are standardised according to the standard deviation of the metabolite (i.e. z scores). Error bars indicate 95% CI

References

    1. The DCCT Research Group Epidemiology of severe hypoglycemia in the diabetes control and complications trial. Am J Med. 1991;90(4):450–459. doi: 10.1016/0002-9343(91)80085-Z. - DOI - PubMed
    1. Khunti K, Alsifri S, Aronson R, et al. Rates and predictors of hypoglycaemia in 27 585 people from 24 countries with insulin-treated type 1 and type 2 diabetes: the global HAT study. Diabetes Obes Metab. 2016;18(9):907–915. doi: 10.1111/dom.12689. - DOI - PMC - PubMed
    1. Pedersen-Bjergaard U, Pramming S, Heller SR, et al. Severe hypoglycaemia in 1076 adult patients with type 1 diabetes: influence of risk markers and selection. Diabetes Metab Res Rev. 2004;20(6):479–486. doi: 10.1002/dmrr.482. - DOI - PubMed
    1. Gold AE, MacLeod KM, Frier BM. Frequency of severe hypoglycemia in patients with type I diabetes with impaired awareness of hypoglycemia. Diabetes Care. 1994;17(7):697–703. doi: 10.2337/diacare.17.7.697. - DOI - PubMed
    1. Clarke WL, Cox DJ, Gonder-Frederick LA, Julian D, Schlundt D, Polonsky W. Reduced awareness of hypoglycemia in adults with IDDM. A prospective study of hypoglycemic frequency and associated symptoms. Diabetes Care. 1995;18(4):517–522. doi: 10.2337/diacare.18.4.517. - DOI - PubMed

Publication types

MeSH terms

Associated data