Randomized Controlled Trial
. 2024 May 16;143(20):2073-2088.
doi: 10.1182/blood.2023022593.

Platelet dysfunction reversal with cold-stored vs room temperature-stored platelet transfusions

Affiliations
Randomized Controlled Trial

Platelet dysfunction reversal with cold-stored vs room temperature-stored platelet transfusions

Valery J Kogler et al. Blood. .

Abstract

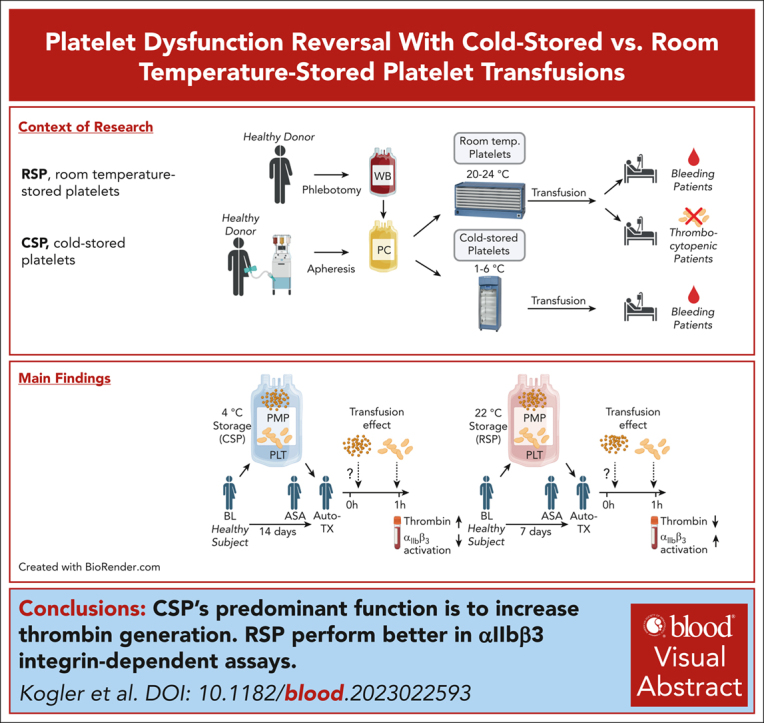
Platelets are stored at room temperature for 5 to 7 days (room temperature-stored platelets [RSPs]). Because of frequent and severe shortages, the US Food and Drug Administration recently approved up to 14-day cold-stored platelets (CSPs) in plasma. However, the posttransfusion function of CSPs is unknown and it is unclear which donors are best suited to provide either RSPs or CSPs. In this study, we sought to evaluate the posttransfusion platelet function and its predictors for platelets stored for the maximum approved storage times (7-day RSPs and 14-day CSPs) in healthy volunteers on acetylsalicylic acid (ASA). We conducted a randomized crossover study in 10 healthy humans. Individuals donated 1 platelet unit, stored at either 22°C or 4°C based on randomization. Before transfusion, participants ingested ASA to inhibit endogenous platelets. Transfusion recipients were tested for platelet function and lipid mediators. Platelet units were tested for lipid mediators only. A second round of transfusion with the alternative product was followed by an identical testing sequence. RSPs reversed platelet inhibition significantly better in αIIbβ3 integrin activation-dependent assays. In contrast, CSPs in recipients led to significantly more thrombin generation, which was independent of platelet microparticles. Lysophosphatidylcholine-O species levels predicted the procoagulant capacity of CSPs. In contrast, polyunsaturated fatty acid concentrations predicted the aggregation response of RSPs. In summary, we provide, to our knowledge, the first efficacy data of extended-stored CSPs in plasma. Our results suggest that identifying ideal RSP and CSP donors is possible, and pave the way for larger studies in the future. This trial is registered at www.ClinicalTrials.gov as #NCT0511102.


Conflict of interest statement

Conflict-of-interest disclosure: M.S. has received research support from Terumo Blood Component Technologies and Cerus. The remaining authors declare no competing financial interests.

Figures

None
Graphical abstract
Figure 1.
Figure 1.
Effect of RSP and extended-stored CSP transfusion in healthy humans on ASA. (A) In each of the 2 periods, healthy humans underwent plateletpheresis with platelet storage (randomized to RSPs or CSPs). The healthy humans then received an ASA loading dose, 24 hours before transfusion, and autologous platelet transfusion with blood assessments at baseline (BL; ie, without ASA), before transfusion (ASA), and at multiple time points after transfusion (1 hour, 4 hours, and 24 hours). Participants completed an RSP period (receiving 7-day RT-stored platelets) and a CSP period (receiving 14-day 4°C-stored platelets) as outlined in this overview schematic. (B) The number of RT (red circles) and 4°C (blue circles) total platelets transfused. The platelet count (C) and corrected count increments (CCI) (D) during each period (red circles: RSP period; blue squares: CSP period; 4 hours, ∗P = .0204; 24 hours, ∗∗P = .0047). (E) Platelet AA–stimulated whole-blood aggregation was measured by VerifyNow ASA (1 hour, ∗∗P = .0055; 24 hours, ∗P = .0198). Maximum light transmission aggregation (defined as maximum aggregation recorded [in percent] within 10 minutes after agonist stimulation) in response to 0.5 mM AA (1 hour, ∗P = .0347; 4 hours, ∗∗P = .0081) (F), and collagen (2.5 μg/mL; 24 hours, ∗P = .0493) (G). The thrombin generation potential of the participant’s whole blood–derived PRP was measured immediately before and 1 hour after transfusion with a commercially available fluorogenic thrombin generation assay. Results are reported as the change from the pretransfusion value to the 1-hour posttransfusion value for thrombin generation peak (defined as maximum concentration during recording; ∗P = .0429) (H), start tail time (time until end of thrombin generation; ∗P = .0266) (I), time to thrombin peak (time between begin and peak of thrombin generation) (J), and lag time (time from assay start to begin of thrombin generation) (K). Data are shown as mean ± standard error of the mean (SEM), panels H-K shown with individual values. Unpaired data, n = 7 to 9, individual P values are shown in the text above. RT, room temperature.
Figure 2.
Figure 2.
Increased small PMPs and thrombin generation with CSPs in vitro. (A) After platelet storage at both RT and 4°C conditions, PPP was prepared by centrifugation with 1 freeze-thaw cycle before testing. (B) Using the CytoFLEX flow cytometer, and nanobeads, we identified MPs with a large MP size gate (1-μm equivalent to 0.5-μm equivalent) and a small MP size gate (between 0.5-μm and 0.1-μm equivalent beads). (C) The gates were applied to MPs in plasma. (D) Within the respective large and small MP size gates, PMPs were defined as all CD41a+ events. Both large and small PMPs were further gated for lactadherin (E) or CD62P (gray trace indicates isotype control) (F) positivity within the CD41+ gate. (C-F) Example data from stored platelet samples and gating for large-sized events. (G) PMPs of both RSPs and CSPs were identified as events within small and large size gates that were CD41a+ and the concentration of each reported (large, ∗P = .0369; small, ∗∗∗∗P < .0001; small vs large, RSPs ∗∗P = .002; CSPs ∗∗∗∗P < .0001). The concentration of large and small PMPs that were also positive for lactadherin (small, ∗P = .0113; small vs large, CSPs ∗∗P = .005, RSPs ∗∗P = .002) (H) or CD62P (small, ∗∗∗P = .0002; small vs large, RSPs ∗P = .04; CSPs ∗∗∗∗P < .0001) (I). The MP-mediated thrombin generation potential of PPP from storage bags was measured and reported as thrombin generation peak (∗P = .0202) (J), start tail time (∗P = .0479), (K), time to thrombin peak (L), and lag time (M). Data are shown as mean ± SEM and individual values. Unpaired data, n = 9, individual P values are shown in the text above. RT, room temperature.
Figure 3.
Figure 3.
Bioactive lipid mediators in CSP and RSP storage bags. Data were mean-centered and divided by the standard deviation of each variable to normalize. (A) Heat map with individual lipid mediator levels at BL (fresh) and after 14 days of 4°C storage, and 7 days of RT storage. Color codes for individual donors in first row. The BL (fresh) data were averaged from 2 different collections. (B-C) Volcano plots of CSPs, plotted as logarithmic false discovery rate (FDR; Q = 1%, discoveries above the dotted line as blue circles) and logarithmic fold change (B) and 2-dimensional (2D) score plot of PC analysis of CSP (green triangles, baseline; blue squares, CSPs) (C). (D-E) Volcano plots of RSPs (discoveries shown above the dotted line as red circles) (D) and 2D score plot of PC analysis of RSPs (green triangles, baseline; red circles, RSPs) (E). n = 9 (only paired data). Statistical significance was assessed with a FDR of Q = 1% (89 comparisons). FC, fold change; RT, room temperature.
Figure 3.
Figure 3.
Bioactive lipid mediators in CSP and RSP storage bags. Data were mean-centered and divided by the standard deviation of each variable to normalize. (A) Heat map with individual lipid mediator levels at BL (fresh) and after 14 days of 4°C storage, and 7 days of RT storage. Color codes for individual donors in first row. The BL (fresh) data were averaged from 2 different collections. (B-C) Volcano plots of CSPs, plotted as logarithmic false discovery rate (FDR; Q = 1%, discoveries above the dotted line as blue circles) and logarithmic fold change (B) and 2-dimensional (2D) score plot of PC analysis of CSP (green triangles, baseline; blue squares, CSPs) (C). (D-E) Volcano plots of RSPs (discoveries shown above the dotted line as red circles) (D) and 2D score plot of PC analysis of RSPs (green triangles, baseline; red circles, RSPs) (E). n = 9 (only paired data). Statistical significance was assessed with a FDR of Q = 1% (89 comparisons). FC, fold change; RT, room temperature.
Figure 4.
Figure 4.
Lipid mediator concentration comparison between RSPs and CSPs. (A-F) Samples at the end of storage were compared between RSPs and CSPs. Data shown as individual values with mean and SEM. n = 9 (paired analysis) with α = 0.05 for total LPL comparisons with Holm-Šídák correction for multiple (n = 4) comparisons. Individual species were tested with FDR of Q = 1% (89 comparisons); ∗∗P < .01 and ∗∗∗∗P < .0001. LPL, lysoglycerophospholipids; RT, room temperature.
Figure 5.
Figure 5.
Bioactive lipid mediators in CSP and RSP transfusion recipients. (A) Heat maps of individual transfusion donor/recipients (color codes, first row) normalized to after ASA (before transfusion). Individual 3 squares show values for 1 hour, 4 hours, and 24 hours after transfusion. (B-J) Individual and pooled (“total”) bioactive lipid mediators normalized to after ASA (before transfusion). Individual lipid markers were tested with 2-tailed, paired t test with FDR of Q = 1% (89 comparisons), and total (sum) lipids with α = 0.05 and Holm-Šídák method for multiple (n = 4) comparisons. Data are shown as mean ± SEM; n = 8 (only paired recipient data included); ∗P ≤ .05, ∗∗P < .01; and ∗∗∗P < .001. RT, room temperature.
Figure 5.
Figure 5.
Bioactive lipid mediators in CSP and RSP transfusion recipients. (A) Heat maps of individual transfusion donor/recipients (color codes, first row) normalized to after ASA (before transfusion). Individual 3 squares show values for 1 hour, 4 hours, and 24 hours after transfusion. (B-J) Individual and pooled (“total”) bioactive lipid mediators normalized to after ASA (before transfusion). Individual lipid markers were tested with 2-tailed, paired t test with FDR of Q = 1% (89 comparisons), and total (sum) lipids with α = 0.05 and Holm-Šídák method for multiple (n = 4) comparisons. Data are shown as mean ± SEM; n = 8 (only paired recipient data included); ∗P ≤ .05, ∗∗P < .01; and ∗∗∗P < .001. RT, room temperature.
Figure 6.
Figure 6.
Correlation of lipid mediators and platelet function parameters. The left column (panels A,D,G,J,M) shows the correlation coefficient r in heat maps for BL, end of storage (7 and 14 days, respectively), and for the difference between BL and end of storage (Delta). The middle column (panels B,E,H,K,N) shows the correlation between platelet functional parameters and storage bag lipid mediator concentration. The right column (panels C,F,I,L,O) shows the correlation between platelet functional parameters and recipient bioactive lipid mediator concentration. Data are shown as heat maps and linear regression analysis plots; n = 8 to 9 in each group, and individual P values are shown in each figure. DHA, docosahexaenoic acid; ETP, endogenous thrombin potential.

Comment in

References

    1. Curley A, Stanworth SJ, Willoughby K, et al. Randomized trial of platelet-transfusion thresholds in neonates. N Engl J Med. 2019;380(3):242–251. - PubMed
    1. Baharoglu MI, Cordonnier C, Al-Shahi Salman R, et al. Platelet transfusion versus standard care after acute stroke due to spontaneous cerebral haemorrhage associated with antiplatelet therapy (PATCH): a randomised, open-label, phase 3 trial. Lancet. 2016;387(10038):2605–2613. - PubMed
    1. Cap AP. Platelet storage: a license to chill! Transfusion. 2016;56(1):13–16. - PubMed
    1. Kogler VJ, Stolla M. There and back again: the once and current developments in donor-derived platelet products for hemostatic therapy. Blood. 2022;139(26):3688–3698. - PMC - PubMed
    1. Reddoch-Cardenas KM, Peltier GC, Chance TC, et al. Cold storage of platelets in platelet additive solution maintains mitochondrial integrity by limiting initiation of apoptosis-mediated pathways. Transfusion. 2021;61(1):178–190. - PubMed

Publication types