

Membrane localization accelerates association under conditions relevant to cellular signaling
- PMID: 38427601
- PMCID: PMC10927583
- DOI: 10.1073/pnas.2319491121
Membrane localization accelerates association under conditions relevant to cellular signaling
Abstract
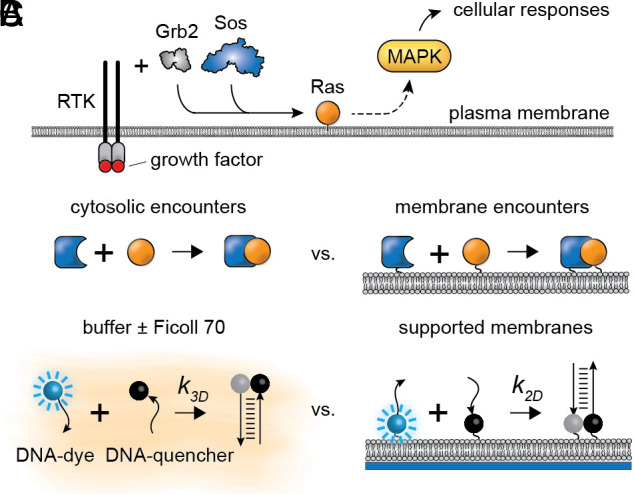
Translocation of cytoplasmic molecules to the plasma membrane is commonplace in cell signaling. Membrane localization has been hypothesized to increase intermolecular association rates; however, it has also been argued that association should be faster in the cytosol because membrane diffusion is slow. Here, we directly compare an identical association reaction, the binding of complementary DNA strands, in solution and on supported membranes. The measured rate constants show that for a 10-µm-radius spherical cell, association is 22- to 33-fold faster at the membrane than in the cytoplasm. The kinetic advantage depends on cell size and is essentially negligible for typical ~1 µm prokaryotic cells. The rate enhancement is attributable to a combination of higher encounter rates in two dimensions and a higher reaction probability per encounter.
Keywords: Ras activation; bimolecular reaction; membrane-associated proteins; receptor signaling; reduction of dimensionality.
Conflict of interest statement
Competing interests statement:The authors declare no competing interest.
Figures


Similar articles
-
Ras Diffusion and Interactions with the Plasma Membrane Measured by FRAP Variations.Methods Mol Biol. 2021;2262:185-197. doi: 10.1007/978-1-0716-1190-6_10. Methods Mol Biol. 2021. PMID: 33977477
-
Translocation of diacylglycerol kinase theta from cytosol to plasma membrane in response to activation of G protein-coupled receptors and protein kinase C.J Biol Chem. 2005 Mar 18;280(11):9870-8. doi: 10.1074/jbc.M409301200. Epub 2005 Jan 4. J Biol Chem. 2005. PMID: 15632189
-
Independent action of serine/threonine protein phosphatase in ovarian cancer plasma membrane and cytosol during gonadotropin-releasing hormone stimulation.Oncol Rep. 2003 Nov-Dec;10(6):1885-9. Oncol Rep. 2003. PMID: 14534713
-
Why cytoplasmic signalling proteins should be recruited to cell membranes.Trends Cell Biol. 2000 May;10(5):173-8. doi: 10.1016/s0962-8924(00)01741-4. Trends Cell Biol. 2000. PMID: 10754559 Review.
-
Tuning outer segment Ca2+ homeostasis to phototransduction in rods and cones.Adv Exp Med Biol. 2002;514:179-203. doi: 10.1007/978-1-4615-0121-3_11. Adv Exp Med Biol. 2002. PMID: 12596922 Review.
Cited by
-
Translocation of penetratin-like peptides involving calcium-dependent interactions between glycosaminoglycans and phosphocholine headgroups of the membrane lipid bilayer.RSC Chem Biol. 2025 Aug 2;6(9):1391-1402. doi: 10.1039/d5cb00099h. eCollection 2025 Aug 27. RSC Chem Biol. 2025. PMID: 40787615 Free PMC article.
-
Engineered Proteins and Chemical Tools to Probe the Cell Surface Proteome.Chem Rev. 2025 Apr 23;125(8):4069-4110. doi: 10.1021/acs.chemrev.4c00554. Epub 2025 Apr 3. Chem Rev. 2025. PMID: 40178992 Free PMC article. Review.
-
Membrane-associated polymerases deliver most of the actin subunits to a lamellipodial network.bioRxiv [Preprint]. 2025 Mar 25:2025.03.24.645090. doi: 10.1101/2025.03.24.645090. bioRxiv. 2025. PMID: 40196521 Free PMC article. Preprint.
-
Enzymatic Reactions Dictated by the 2D Membrane Environment.J Phys Chem Lett. 2025 Jul 3;16(26):6745-6756. doi: 10.1021/acs.jpclett.5c00988. Epub 2025 Jun 24. J Phys Chem Lett. 2025. PMID: 40554482 Free PMC article.
-
Binding affinities for 2D protein dimerization benefit from enthalpic stabilization.bioRxiv [Preprint]. 2025 Mar 15:2025.01.16.633485. doi: 10.1101/2025.01.16.633485. bioRxiv. 2025. PMID: 40161697 Free PMC article. Preprint.
References
-
- Lim W., Mayer B., Pawson T., Cell Signaling (Garland Science, 2014).
-
- Schlessinger J., Cell signaling by receptor tyrosine kinases. Cell 103, 211–225 (2000). - PubMed
MeSH terms
Grants and funding
LinkOut - more resources
Full Text Sources
