

Multi-feature SEIR model for epidemic analysis and vaccine prioritization
- PMID: 38427619
- PMCID: PMC10906911
- DOI: 10.1371/journal.pone.0298932
Multi-feature SEIR model for epidemic analysis and vaccine prioritization
Abstract
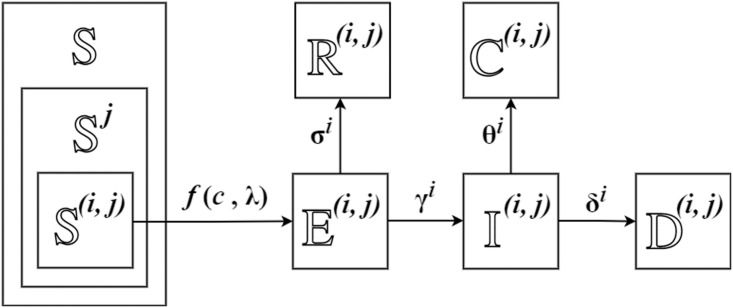
The SEIR (susceptible-exposed-infected-recovered) model has become a valuable tool for studying infectious disease dynamics and predicting the spread of diseases, particularly concerning the COVID pandemic. However, existing models often oversimplify population characteristics and fail to account for differences in disease sensitivity and social contact rates that can vary significantly among individuals. To address these limitations, we have developed a new multi-feature SEIR model that considers the heterogeneity of health conditions (disease sensitivity) and social activity levels (contact rates) among populations affected by infectious diseases. Our model has been validated using the data of the confirmed COVID cases in Allegheny County (Pennsylvania, USA) and Hamilton County (Ohio, USA). The results demonstrate that our model outperforms traditional SEIR models regarding predictive accuracy. In addition, we have used our multi-feature SEIR model to propose and evaluate different vaccine prioritization strategies tailored to the characteristics of heterogeneous populations. We have formulated optimization problems to determine effective vaccine distribution strategies. We have designed extensive numerical simulations to compare vaccine distribution strategies in different scenarios. Overall, our multi-feature SEIR model enhances the existing models and provides a more accurate picture of disease dynamics. It can help to inform public health interventions during pandemics/epidemics.
Copyright: © 2024 Hou, Bidkhori. This is an open access article distributed under the terms of the Creative Commons Attribution License, which permits unrestricted use, distribution, and reproduction in any medium, provided the original author and source are credited.
Conflict of interest statement
Since the authors are affiliated with the University of Pittsburgh and George Mason University, they have competing interests with those institutes. This does not alter our adherence to PLOS ONE policies on sharing data and materials.
Figures


Similar articles
-
Modified susceptible-exposed-infectious-recovered model for assessing the effectiveness of non-pharmaceutical interventions during the COVID-19 pandemic in Seoul.J Theor Biol. 2023 Jan 21;557:111329. doi: 10.1016/j.jtbi.2022.111329. Epub 2022 Oct 26. J Theor Biol. 2023. PMID: 36309117 Free PMC article.
-
[Evaluation of interventions during the COVID-19 pandemic: development of a model based on subpopulations with different contact rates].Rev Argent Microbiol. 2022 Apr-Jun;54(2):81-94. doi: 10.1016/j.ram.2021.04.004. Epub 2021 Jul 24. Rev Argent Microbiol. 2022. PMID: 34509309 Free PMC article. Spanish.
-
Analytical solution of l-i SEIR model-Comparison of l-i SEIR model with conventional SEIR model in simulation of epidemic curves.PLoS One. 2023 Jun 14;18(6):e0287196. doi: 10.1371/journal.pone.0287196. eCollection 2023. PLoS One. 2023. PMID: 37315097 Free PMC article.
-
A dynamical map to describe COVID-19 epidemics.Eur Phys J Spec Top. 2022;231(5):893-904. doi: 10.1140/epjs/s11734-021-00340-5. Epub 2021 Nov 25. Eur Phys J Spec Top. 2022. PMID: 34849187 Free PMC article. Review.
-
Learning from the COVID-19 pandemic: A systematic review of mathematical vaccine prioritization models.Infect Dis Model. 2024 May 15;9(4):1057-1080. doi: 10.1016/j.idm.2024.05.005. eCollection 2024 Dec. Infect Dis Model. 2024. PMID: 38988830 Free PMC article. Review.
References
-
- Alvarez F., Argente D., Lippi F. A simple planning problem for COVID-19 lock-down, testing, and tracing. American Economic Review: Insights. 2021;3(3):367–382.
-
- Djidjou-Demasse R., Michalakis Y., Choisy M., et al.. Optimal COVID-19 epidemic control until vaccine deployment. MedRxiv. 2020;20049189.
MeSH terms
Substances
LinkOut - more resources
Full Text Sources
Medical
