. 2024 Mar 1;20(3):e1011833.
doi: 10.1371/journal.pcbi.1011833. eCollection 2024 Mar.

Computational models of compound nerve action potentials: Efficient filter-based methods to quantify effects of tissue conductivities, conduction distance, and nerve fiber parameters

Affiliations

Computational models of compound nerve action potentials: Efficient filter-based methods to quantify effects of tissue conductivities, conduction distance, and nerve fiber parameters

Edgar Peña et al. PLoS Comput Biol. .

Abstract

Background: Peripheral nerve recordings can enhance the efficacy of neurostimulation therapies by providing a feedback signal to adjust stimulation settings for greater efficacy or reduced side effects. Computational models can accelerate the development of interfaces with high signal-to-noise ratio and selective recording. However, validation and tuning of model outputs against in vivo recordings remains computationally prohibitive due to the large number of fibers in a nerve.

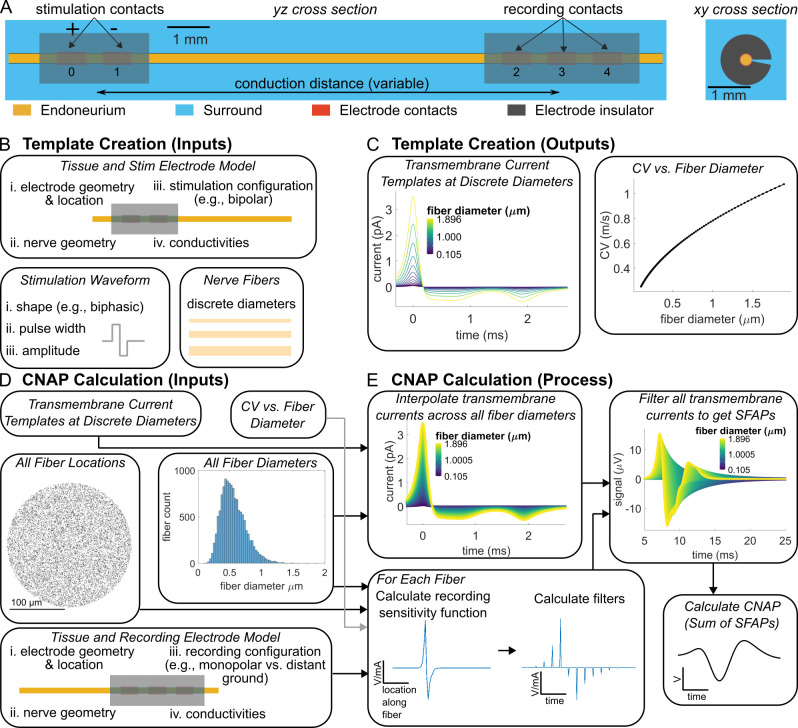
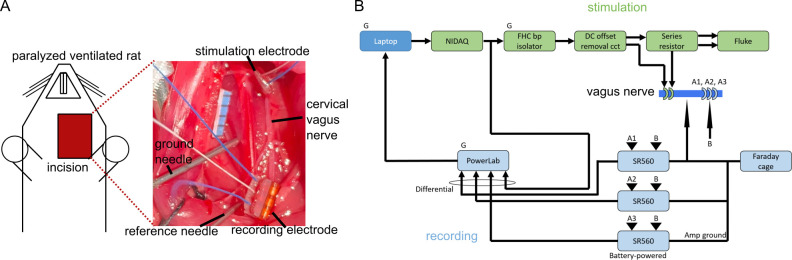
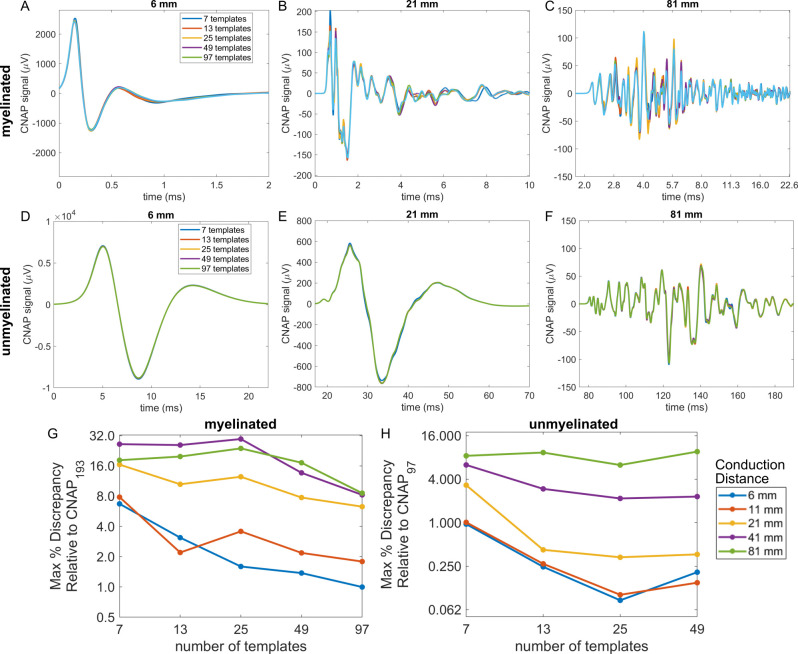
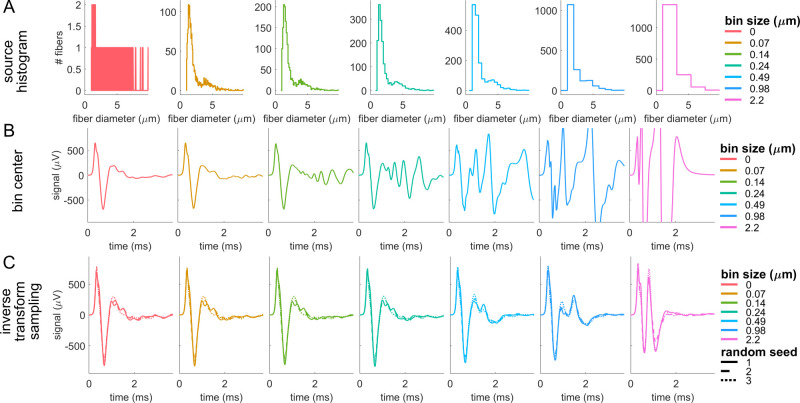
Methods: We designed and implemented highly efficient modeling methods for simulating electrically evoked compound nerve action potential (CNAP) signals. The method simulated a subset of fiber diameters present in the nerve using NEURON, interpolated action potential templates across fiber diameters, and filtered the templates with a weighting function derived from fiber-specific conduction velocity and electromagnetic reciprocity outputs of a volume conductor model. We applied the methods to simulate CNAPs from rat cervical vagus nerve.

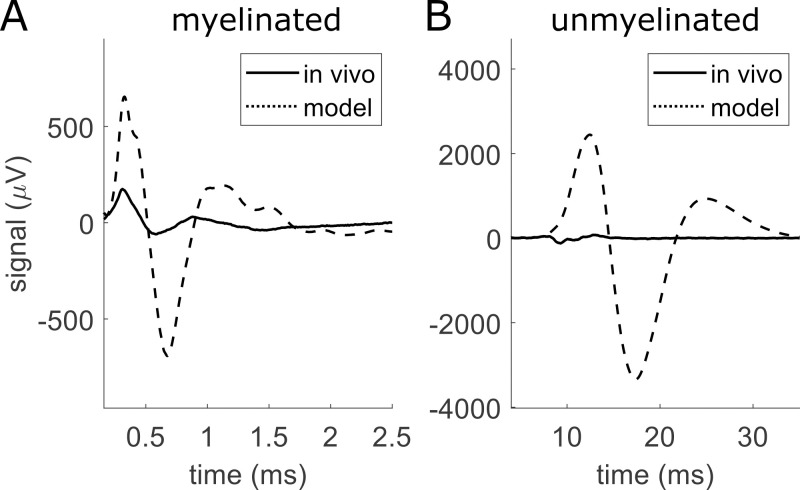
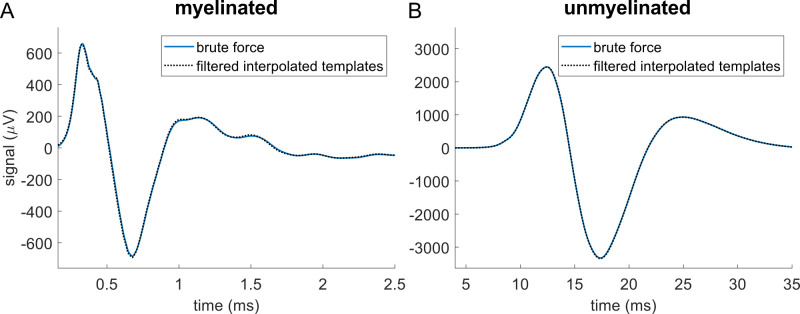
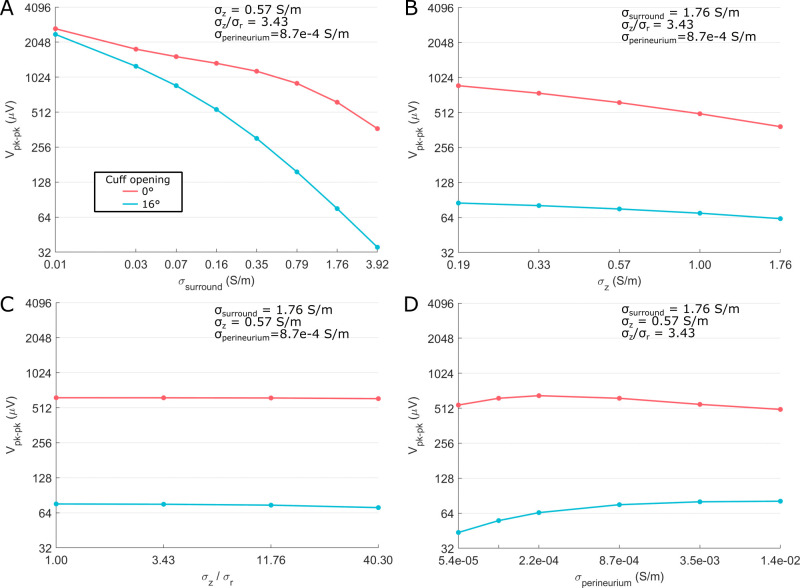
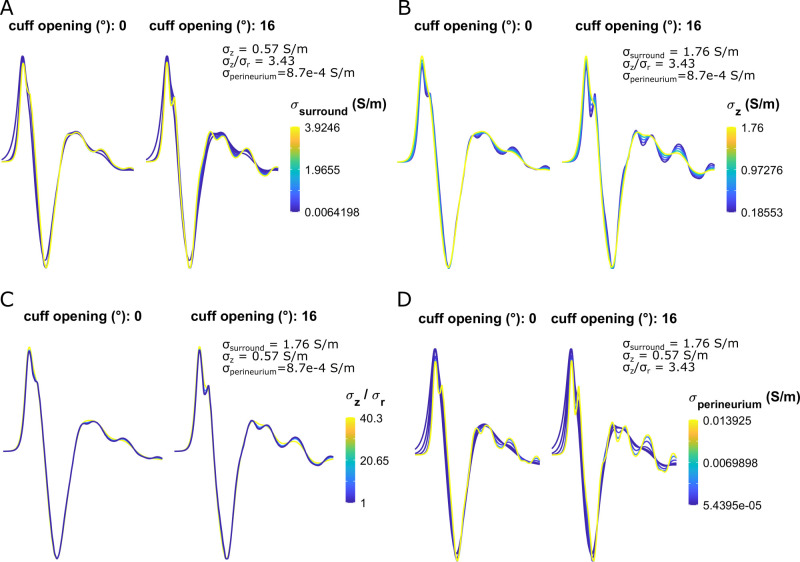
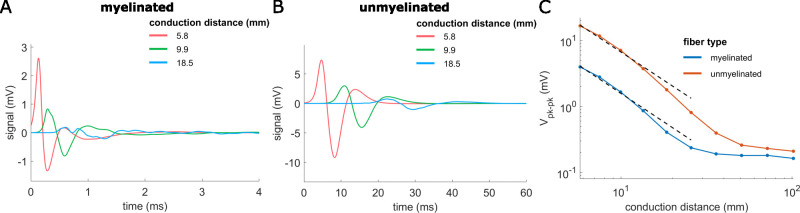
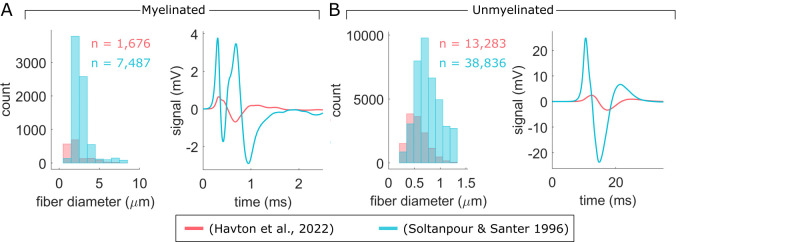
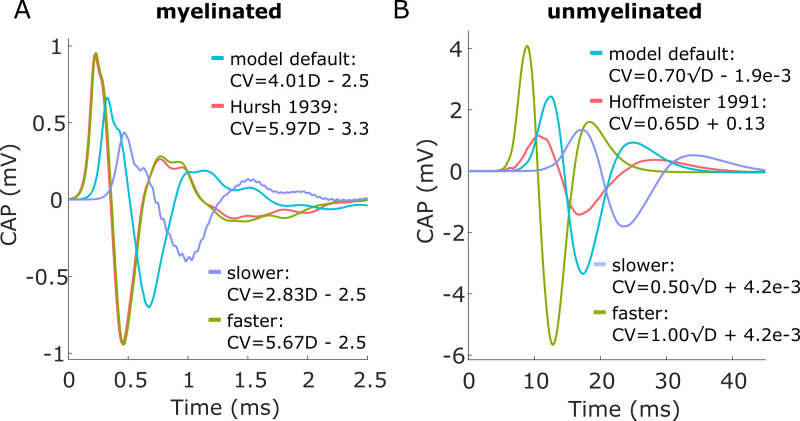
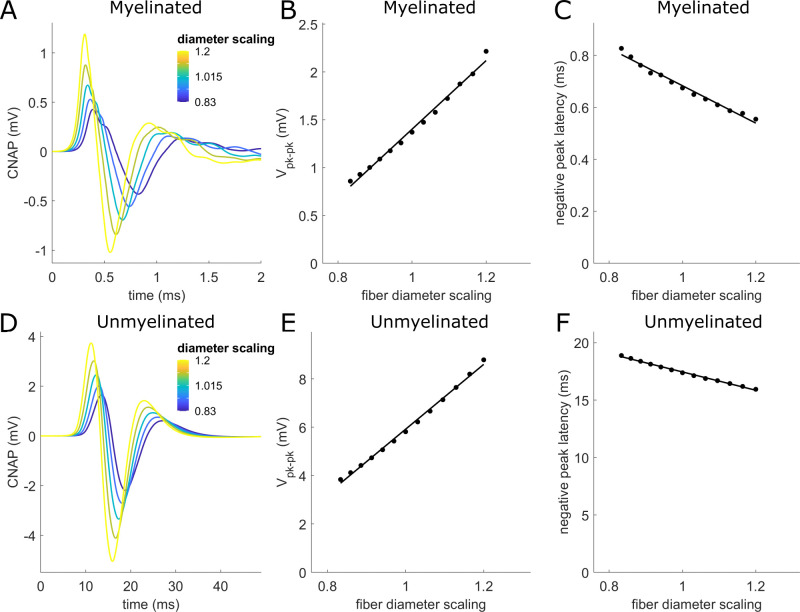
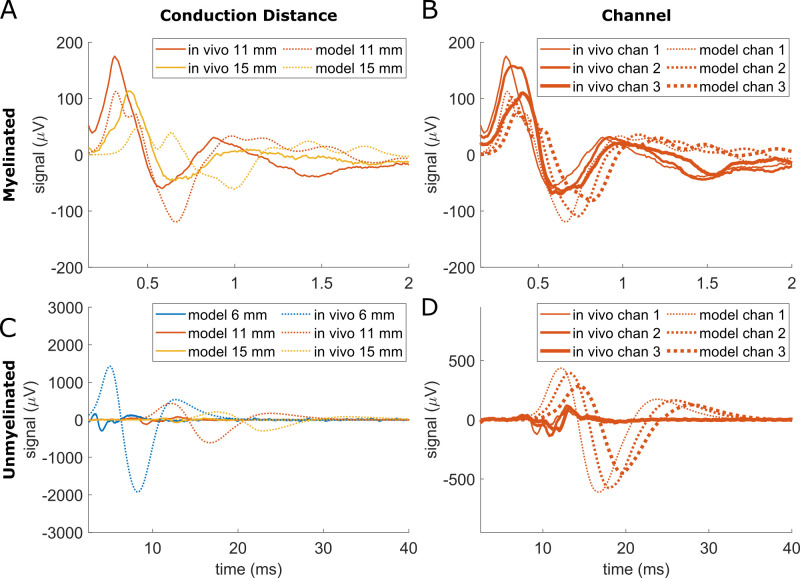
Results: Brute force simulation of a rat vagal CNAP with all 1,759 myelinated and 13,283 unmyelinated fibers in NEURON required 286 and 15,860 CPU hours, respectively, while filtering interpolated templates required 30 and 38 seconds on a desktop computer while maintaining accuracy. Modeled CNAP amplitude could vary by over two orders of magnitude depending on tissue conductivities and cuff opening within experimentally relevant ranges. Conduction distance and fiber diameter distribution also strongly influenced the modeled CNAP amplitude, shape, and latency. Modeled and in vivo signals had comparable shape, amplitude, and latency for myelinated fibers but not for unmyelinated fibers.

Conclusions: Highly efficient methods of modeling neural recordings quantified the large impact that tissue properties, conduction distance, and nerve fiber parameters have on CNAPs. These methods expand the computational accessibility of neural recording models, enable efficient model tuning for validation, and facilitate the design of novel recording interfaces for neurostimulation feedback and understanding physiological systems.


Conflict of interest statement

The authors have declared that no competing interests exist.

Figures

Fig 1
Fig 1. Comparison of rat cervical vagus nerve compound nerve action potentials (CNAPs) that we recorded in vivo (solid) and that we modeled computationally (dashed) from myelinated (A) and unmyelinated (B) fibers with a conduction distance of 11 mm.
We simulated the model using values from literature, including 0.16 S/m for the surrounding medium, and using a fully sealed cuff.
Fig 2
Fig 2. Overview of modeling CNAP recordings from rat cervical vagus nerve.
(A) A bipolar stimulation electrode activated the nerve fibers at the proximal end of the nerve. A tripolar electrode recorded the CNAP at each contact—in a monopolar configuration—at the distal end of the nerve. The volume conductor model represented the monofascicular nerve as a cylinder with a perineurium (not illustrated) and an anisotropic endoneurium, and it represented the electrodes as electrode contacts within insulating cuffs. The recording electrode had a cuff opening of either 0° or 16°. A conductive material (“surround”) filled the space within and around the nerve and cuffs. (B) Template creation inputs included the stimulation volume conductor model, a stimulation waveform, and a set of 193 (myelinated) or 97 (unmyelinated) discrete fiber diameters that defined a population of nerve fibers at the centroid of the nerve to simulate in a biophysical model. (C) Template creation outputs included CV and transmembrane currents for each of the 193 (myelinated) or 97 (unmyelinated) simulated fibers. (D) CNAP calculation inputs included a recording volume conductor model, fiber diameter measurements, fiber locations, and the template creation outputs (i.e., transmembrane current templates and CV vs. fiber diameter relationship). Fiber diameter measurements and random fiber locations defined a population of 1,676 (myelinated; not illustrated) or 13,283 (unmyelinated; illustrated) nerve fibers to be recorded. Fiber diameter measurements were obtained from a publicly available dataset [47] and transformed by the shape-adjusted ellipse method [48]. (E) We interpolated transmembrane current templates across all fiber diameters. We calculated the recording sensitivity functions at all fiber locations via the recording volume conductor model. We calculated a filter for each fiber by inserting zeros into the recording sensitivity function such that the time between non-zero samples equaled the internodal length divided by CV. We generated SFAPs by convolving each filter with an interpolated transmembrane current template, and we superposed SFAPs to generate CNAPs.
Fig 3
Fig 3. In vivo CNAP recording setup overview.
(A) Surgical setup of stimulation and recording electrodes along the rat cervical vagus nerve. The black tick marks on the blue ruler are 1 mm apart. (B) Block diagram of stimulation (green) and recording (light blue) hardware setup. “G” denotes a unit plugged into wall power. “FHC bp isolator” is a current source, “Fluke” is a battery-powered oscilloscope, and “SR560” is a preamplifier. The “ground needle” in panel (A) was connected to the Faraday cage, while the “reference needle” was connected to channel B of all three SR560 units.
Fig 4
Fig 4
Modeled CNAPs for myelinated (A) and unmyelinated (B) fibers in rat cervical vagus nerve calculated by using brute force (blue solid) or by filtering interpolated templates (black dotted). In the brute force method, we simulated all 1,759 myelinated fibers and 13,283 unmyelinated fibers in NEURON, while in the ‘filtering interpolated templates’ method, we simulated only 193 myelinated fibers and 97 unmyelinated fibers and interpolated templates for the thousands of remaining fibers.
Fig 5
Fig 5. CNAPs modeled with different numbers of templates by using linear interpolation across fiber diameters (1.013 to 9.809 μm for myelinated fibers and 0.105 to 1.896 μm for unmyelinated fibers) at five conduction distances.
(A-F) Example myelinated and unmyelinated CNAPs at conduction distances of 6, 21, and 81 mm. (G-H) Maximum percent discrepancy between CNAPn (i.e., CNAP constructed from n templates) and CNAPfinest (i.e., finest = 193 for myelinated or finest = 97 for unmyelinated): 100*max(abs(CNAPn—CNAPfinest))/Vpk-pk,finest.
Fig 6
Fig 6. Sensitivity of peak-to-peak CNAP amplitude (Vpk-pk) across tissue conductivity values and cuff opening size on the myelinated fiber CNAP from the rat cervical vagus nerve at a single conduction distance (11 mm center-to-center).
‘σsurround’ is the conductivity of the cuff slit, of the medium containing the cuff and nerve, and of the thin space between the cuff and the nerve (Fig 2A); ‘σr’ and ‘σz’ are the radial and longitudinal conductivity of the endoneurium, respectively; ‘σperineurium’ is the conductivity of the perineurium.
Fig 7
Fig 7. Sensitivity of myelinated fiber CNAP shape to all tissue conductivities and cuff openings shown in Fig 6.
Each subpanel shows a normalized waveform (to facilitate shape comparison) from t = 0 to t = 2 ms.
Fig 8
Fig 8. Effects of conduction distance on CNAPs from rat cervical vagus nerve.
CNAPs from myelinated (A) and unmyelinated (B) fiber populations for different conduction distances (center-to-center) between the stimulation and recording cuffs. (C) Effect of conduction distance (5.8 to 101.8 mm) on peak-to-peak CNAP amplitude for myelinated and unmyelinated fibers. Nonlinear power fits of conduction distances <26 mm (black dashed lines) related amplitude (in mV) to conduction distance (in mm): amplitude = 83*distance^-1.7 (myelinated), amplitude = 339*distance^-1.7 (unmyelinated).
Fig 9
Fig 9. Effect of bin size and sampling method on myelinated fiber CNAPs during extraction of fiber diameters from distributions.
(A) Histograms of known myelinated fiber diameters across different bin sizes. A bin size of 0 μm used the individual fiber diameter measurements (precision of 1e-6 μm). (B) Effect on CNAPs of generating fiber diameters based on the center of the bin and the bin height. As bin size increased, using the bin centers produced inaccuracies due to less destructive interference and more constructive interference. (C) Effect on CNAPs of generating fiber diameters based on inverse transform sampling to sample diameters randomly from the estimated cumulative distribution function. For a given non-zero bin size, CNAPs were more accurate than when using bin centers.
Fig 10
Fig 10
Comparison of CNAPs from two published fiber diameter datasets of myelinated (A) and unmyelinated (B) fibers in rat cervical vagus nerve. Individual fiber measurements from the (Havton et al., 2022) dataset [47] were from a left cervical vagus nerve (sex: female; age: 68 days; strain: Sprague-Dawley; weight: 198 g); we corrected the measurements according to the shape-adjusted ellipse method [48]. Fiber diameter distributions from (Soltanpour & Santer 1996) [79] were from a right cervical vagus nerve (sex: male; age: 4 months; strain: Wistar; weight: none listed); we used standard inverse transform sampling to obtain individual fiber measurements.
Fig 11
Fig 11
Effect of CV-to-fiber diameter relationship on CNAPs from myelinated fibers (A) and unmyelinated fibers (B).
Fig 12
Fig 12. Effect on CNAPs due to scaling fiber diameters.
(A,D) CNAPs from myelinated (A) and unmyelinated (D) fibers with diameters scaled by different scaling factors (legend). (B,E) Effects of diameter scaling factor on peak-to-peak CNAP amplitude. (C,F) Effects of diameter scaling factor on latency of the CNAP negative peak. Linear fits (black solid lines) related Vpk-pk or latency (y) to fiber diameter scaling (x) with an adjusted R2 value ≥0.98 for all fits: (B) y = -2.18 + 3.58*x; (C) y = 1.40–0.72*x; (E) y = -7.48 + 13.40*x; (F) y = 25.41–7.97*x.
Fig 13
Fig 13
Comparison of CNAPs from in vivo data (solid lines) and models (dashed lines) from a rat cervical vagus nerve across conduction distances (A,C) and recording channels within the tripolar cuff (B,D). Model surround conductivity and cuff opening were tuned to 0.50 S/m and 16°, respectively, to match the model amplitude to the in vivo myelinated fiber CNAP at 11 mm conduction distance from recording channel 1.

Similar articles

Cited by

References

    1. Plachta DTT, Gierthmuehlen M, Cota O, Espinosa N, Boeser F, Herrera TC, et al.. Blood pressure control with selective vagal nerve stimulation and minimal side effects. J Neural Eng. 2014. Jun 1;11(3):036011. doi: 10.1088/1741-2560/11/3/036011 - DOI - PubMed
    1. Sevcencu C, Nielsen TN, Struijk JJ. A neural blood pressure marker for bioelectronic medicines for treatment of hypertension. Biosens Bioelectron. 2017. Dec;98:1–6. doi: 10.1016/j.bios.2017.06.031 - DOI - PubMed
    1. Güemes Gonzalez A, Etienne-Cummings R, Georgiou P. Closed-loop bioelectronic medicine for diabetes management. Bioelectron Med. 2020. Dec;6(1):11. doi: 10.1186/s42234-020-00046-4 - DOI - PMC - PubMed
    1. Masi EB, Levy T, Tsaava T, Bouton CE, Tracey KJ, Chavan SS, et al.. Identification of hypoglycemia-specific neural signals by decoding murine vagus nerve activity. Bioelectron Med. 2019. Dec;5(1):9. doi: 10.1186/s42234-019-0025-z - DOI - PMC - PubMed
    1. Steinberg BE, Silverman HA, Robbiati S, Gunasekaran MK, Tsaava T, Battinelli E, et al.. Cytokine-specific Neurograms in the Sensory Vagus Nerve. Bioelectron Med. 2016. Jun;3(1):7–17. - PMC - PubMed