. 2024 Mar 1;22(3):e3002528.
doi: 10.1371/journal.pbio.3002528. eCollection 2024 Mar.

Structural and functional characterization of AfsR, an SARP family transcriptional activator of antibiotic biosynthesis in Streptomyces

Affiliations

Structural and functional characterization of AfsR, an SARP family transcriptional activator of antibiotic biosynthesis in Streptomyces

Yiqun Wang et al. PLoS Biol. .

Abstract

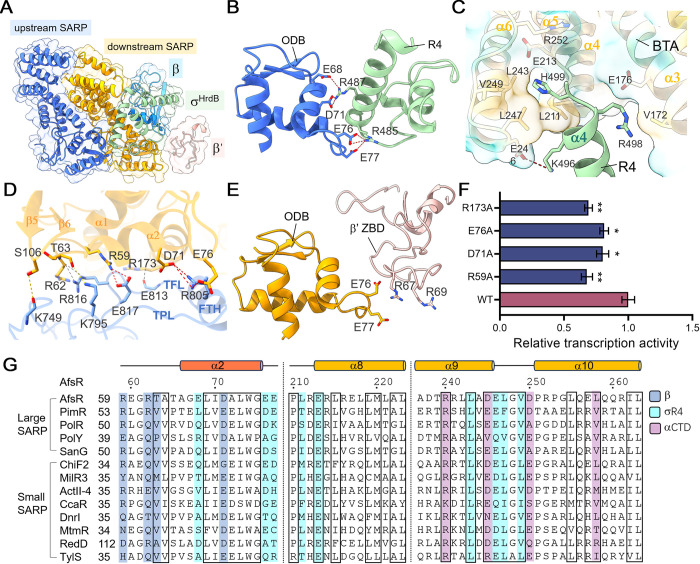
Streptomyces antibiotic regulatory proteins (SARPs) are widely distributed activators of antibiotic biosynthesis. Streptomyces coelicolor AfsR is an SARP regulator with an additional nucleotide-binding oligomerization domain (NOD) and a tetratricopeptide repeat (TPR) domain. Here, we present cryo-electron microscopy (cryo-EM) structures and in vitro assays to demonstrate how the SARP domain activates transcription and how it is modulated by NOD and TPR domains. The structures of transcription initiation complexes (TICs) show that the SARP domain forms a side-by-side dimer to simultaneously engage the afs box overlapping the -35 element and the σHrdB region 4 (R4), resembling a sigma adaptation mechanism. The SARP extensively interacts with the subunits of the RNA polymerase (RNAP) core enzyme including the β-flap tip helix (FTH), the β' zinc-binding domain (ZBD), and the highly flexible C-terminal domain of the α subunit (αCTD). Transcription assays of full-length AfsR and truncated proteins reveal the inhibitory effect of NOD and TPR on SARP transcription activation, which can be eliminated by ATP binding. In vitro phosphorylation hardly affects transcription activation of AfsR, but counteracts the disinhibition of ATP binding. Overall, our results present a detailed molecular view of how AfsR serves to activate transcription.


Conflict of interest statement

The authors have declared that no competing interests exist.

Figures

Fig 1
Fig 1. The TIC of the SARP, RNAP, and afsS promoter DNA.
(A) Domain structures of SARPs. The N-terminal ODB together with the following BTA is referred as an SARP domain. S. coelicolor AfsR is a large SARP with additional NOD and TPR domains. (B) Hypothetical scheme for the regulation of S. coelicolor AfsR. (C) Fluorescence polarization assays of the SARP with afs box. Error bars represent mean ± SEM of n = 3 experiments. (D) Transcription assays with increasing concentrations (62.5 nM, 125 nM, 250 nM, 500 nM, 750 nM, 1,000 nM) of the SARP. CK represents the control group without the addition of the SARP. Data are presented as mean ± SEM from 3 independent assays. (E) Assembly of the SARP-TIC. The protein compositions in the dotted line boxed fractions are shown in the SDS-PAGE. The original gel image can be found in S1 Raw Images. (F) The afsS promoter fragment used for the SARP-TIC assembly. The −35 element, −10 element, the TSS, and the 6-bp noncomplementary bubble are denoted. The afs box is colored orange and contains DRup (the upstream direct repeat) and DRdown (the downstream direct repeat). The top (non-template, NT) strand and bottom (template, T) strand are colored light green and dark green, respectively. (G) Two views of cryo-EM map. The map was generated by merging the consensus map of the full SARP-TIC and the focused map of the SARP region in Chimera X. (H) Cartoon representation of the SARP-TIC structure. The subunits are colored as in the color scheme. The data underlying C, D, and E are provided in S1 Data. BTA, bacterial transcriptional activation; cryo-EM, cryo-electron microscopy; NOD, nucleotide-binding oligomerization domain; ODB, OmpR-type DNA-binding; RNAP, RNA polymerase; SARP, Streptomyces antibiotic regulatory protein; TIC, transcription initiation complex; TPR, tetratricopeptide repeat; TSS, transcription start site.
Fig 2
Fig 2. Interactions of SARP with afs box.
(A) Two SARP protomers bind to the afs box (−19 to −40) side-by-side with each protomer contacting 1 DR. The density map is shown as transparent surface. T-30 (nt) is the last nucleotide of DRup. Upstream and downstream SARP are colored blue and orange, respectively. (B) Conserved sequences corresponding to the 11-nt DR of the afs box generated by MEME. (C) The dimer interface between 2 SARP protomers. (D) The domain organization indicated in the downstream SARP protomer. (E) Detailed interactions of the upstream protomer with the DNA backbone. Hydrogen bonds and salt bridges are shown as yellow and red dashed lines, respectively. (F) Contacts of SARP with specific nucleotides. The residues R92 and T88 make hydrogen bonds (shown as yellow dashed lines) with O4 of T-38(nt) and N7 of G-36(t), respectively. (G) Sequence alignments of SARP regulators from different Streptomyces strains, highlighting the residues interacting with DNA (green). Only ODB domains were compared. These proteins include AfsR (P25941), ActII-4 (P46106), RedD (P16922) from S. coelicolor, PimR (Q70DY8) from S. natalensis, PolY (ABX24502.1), PolR (ABX24503.1) from S. asoensis, SanG (Q5IW77) from S. ansochromogenes, ChlF2 (Q0R4N4) from S. antibioticus, MilR3 (D7BZQ7) from S. bingchenggensis, CcaR (P97060) from S. clavuligerus, DnrI (P25047) from S. peucetius, MtmR (Q194R8) from S. argillaceus, and TlyS (M4ML56) from S. fradiae. The black boxes highlight the positions conserved. DR, direct repeat; ODB, OmpR-type DNA-binding; SARP, Streptomyces antibiotic regulatory protein.
Fig 3
Fig 3. SARP interacts with σHrdB R4, β FTH, β′ ZBD.
(A) The SARP protomers interact with σHrdB, β, and β′. (B) The upstream SARP protomer contacts σHrdB R4 by its ODB domain. Salt bridges are shown as red dashed lines. (C) The H499 of σHrdBR4 is enfolded in an amphiphilic pocket of the BTA domain. The K496 of σHrdBR4 makes a salt bridge with the E246 of the BTA domain. (D) The downstream SARP protomer make extensive interactions with the β FTH, the preceding loop (TPL) and the following loop (TFL) of the β flap. SARP is colored orange and β flap is colored blue. Hydrogen bonds, salt-bridges, and van der Waals interactions are shown as yellow, red, and gray dashed lines, respectively. (E) Interactions between the β′ ZBD and the ODB of downstream SARP. The positively charged R67 and R69 of β′ ZBD contact the negatively charged E76 and E77 of the HTH loop of the ODB domain. (F) Mutating interfacial residues of SARP impaired transcription activation. The data underlying this figure can be found in S1 Data; error bars, SEM; n = 3; *P < 0.05; **P < 0.01 in comparison with the wild-type SARP. (G) Sequence alignments of SARP regulators from different Streptomyces strains, highlighting the residues interacting with β (blue), σ R4 (cyan), and αCTD (purple). The black boxes highlight the positions conserved. BTA, bacterial transcriptional activation; FTH, flap tip helix; ODB, OmpR-type DNA-binding; SARP, Streptomyces antibiotic regulatory protein; ZBD, zinc-binding domain.
Fig 4
Fig 4. Interactions of SARP with RNAP αCTD.
(A) BTA domains of both SARP protomers interact with the αCTD. Detailed interactions are shown in the gray box. (B) The electrostatic potential interface of BTA domains composed of R240, D245, E246, D250, and L263, and that of RNAP αCTD composed of E252, R259, K265, R266, R287, and K292. (C) Removing αCTD or mutating SARP residues involved in interactions with αCTD impaired transcription activation compared with wild-type SARP. The data underlying this figure can be found in S1 Data; error bars, SEM; n = 3; *P < 0.05; **P < 0.01; ***P < 0.001 in comparison with the wild-type SARP. (D) Proposed model for SARP-dependent transcription activation. BTA, bacterial transcriptional activation; RNAP, RNA polymerase; SARP, Streptomyces antibiotic regulatory protein.
Fig 5
Fig 5. ATP binding activates unphosphorylated AfsR.
(A) Transcription assays with increasing concentrations of AfsR as well as its truncations ΔTPR and SARP. (B) Sequence alignment of Streptomyces STAND family members highlighting the consensuses sequences of Walker A motif. The T337 phosphorylated by E. coli kinases is colored orange. (C) Transcription assays of 500 nM dephosphorylated AfsR preincubated with different additional nucleotides. Data are presented as mean ± SEM from 3 independent assays. (D) Representative SDS-PAGE analysis of proteolysis resistance of dephosphorylated AfsR, phosphorylated AfsR by AfsKΔC, AfsRT337A, and AfsR4E in the absence or presence of 1 mM ATP. Arrows and triangles indicate the primary AfsR bands and major degradation bands, respectively. Increasing concentrations of trypsin (0–100 μg/ml) were used. The original gel images can be found in S1 Raw Images. (E) Transcription assays of 500 nM AfsR (untreated), dephosphorylated AfsR (dephos), phosphorylated AfsR (phos), AfsRT337A and AfsR4E with or without preincubation with 1 mM ATP. CK represents the control group without the addition of AfsR. Data are presented as mean ± SEM from 3 independent assays. (F) ATPase activity assay of the AfsR4E, phosphorylated AfsR, and dephosphorylated AfsR. The AfsR4E showed Km of 0.995 ± 0.152 mM and kcat of 0.147 ± 0.00841 s−1. The phosphorylated AfsR showed Km of 0.767 ± 0.163 mM and kcat of 0.070 ± 0.00515 s−1. The dephosphorylated AfsR showed Km of 1.16 ± 0.231 mM and kcat of 0.0453 ± 0.00356 s−1. Data shown are the mean ± SEM for n = 3 experiments. (G) The cryo-EM map of AfsR-TIC. The map was generated by merging the consensus map of the full AfsR-TIC and the focused maps of the AfsR in Chimera X. Detailed interactions in the focused map focused on SARP are shown in the box. The data underlying A, C, E, and F are provided in S1 Data. cryo-EM, cryo-electron microscopy; SARP, Streptomyces antibiotic regulatory protein; STAND, signal transduction ATPases with numerous domains; TIC, transcription initiation complex.

Similar articles

Cited by

References

    1. Flardh K, Buttner MJ. Streptomyces morphogenetics: dissecting differentiation in a filamentous bacterium. Nat Rev Microbiol. 2009;7(1):36–49. doi: 10.1038/nrmicro1968 . - DOI - PubMed
    1. Bibb MJ. Regulation of secondary metabolism in streptomycetes. Curr Opin Microbiol. 2005;8(2):208–215. doi: 10.1016/j.mib.2005.02.016 . - DOI - PubMed
    1. Li Y, Zhang J, Zheng J, Guan H, Liu W, Tan H. Co-expression of a SARP Family Activator ChlF2 and a Type II Thioesterase ChlK Led to High Production of Chlorothricin in Streptomyces antibioticus DSM 40725. Front Bioeng Biotechnol. 2020;8:1013. Epub 20200821. doi: 10.3389/fbioe.2020.01013 . - DOI - PMC - PubMed
    1. Yan YS, Yang YQ, Zhou LS, Zhang L, Xia HY. MilR3, a unique SARP family pleiotropic regulator in Streptomyces bingchenggensis. Arch Microbiol. 2022;204(10):631. doi: 10.1007/s00203-022-03240-x . - DOI - PubMed
    1. Martinez-Hackert E, Stock AM. The DNA-binding domain of OmpR: crystal structures of a winged helix transcription factor. Structure. 1997;5(1):109–124. doi: 10.1016/s0969-2126(97)00170-6 . - DOI - PubMed

MeSH terms