. 2024 Mar;9(93):eadj7363.
doi: 10.1126/sciimmunol.adj7363. Epub 2024 Mar 1.

Mast cells help organize the Peyer's patch niche for induction of IgA responses

Affiliations

Mast cells help organize the Peyer's patch niche for induction of IgA responses

Marco De Giovanni et al. Sci Immunol. 2024 Mar.

Abstract

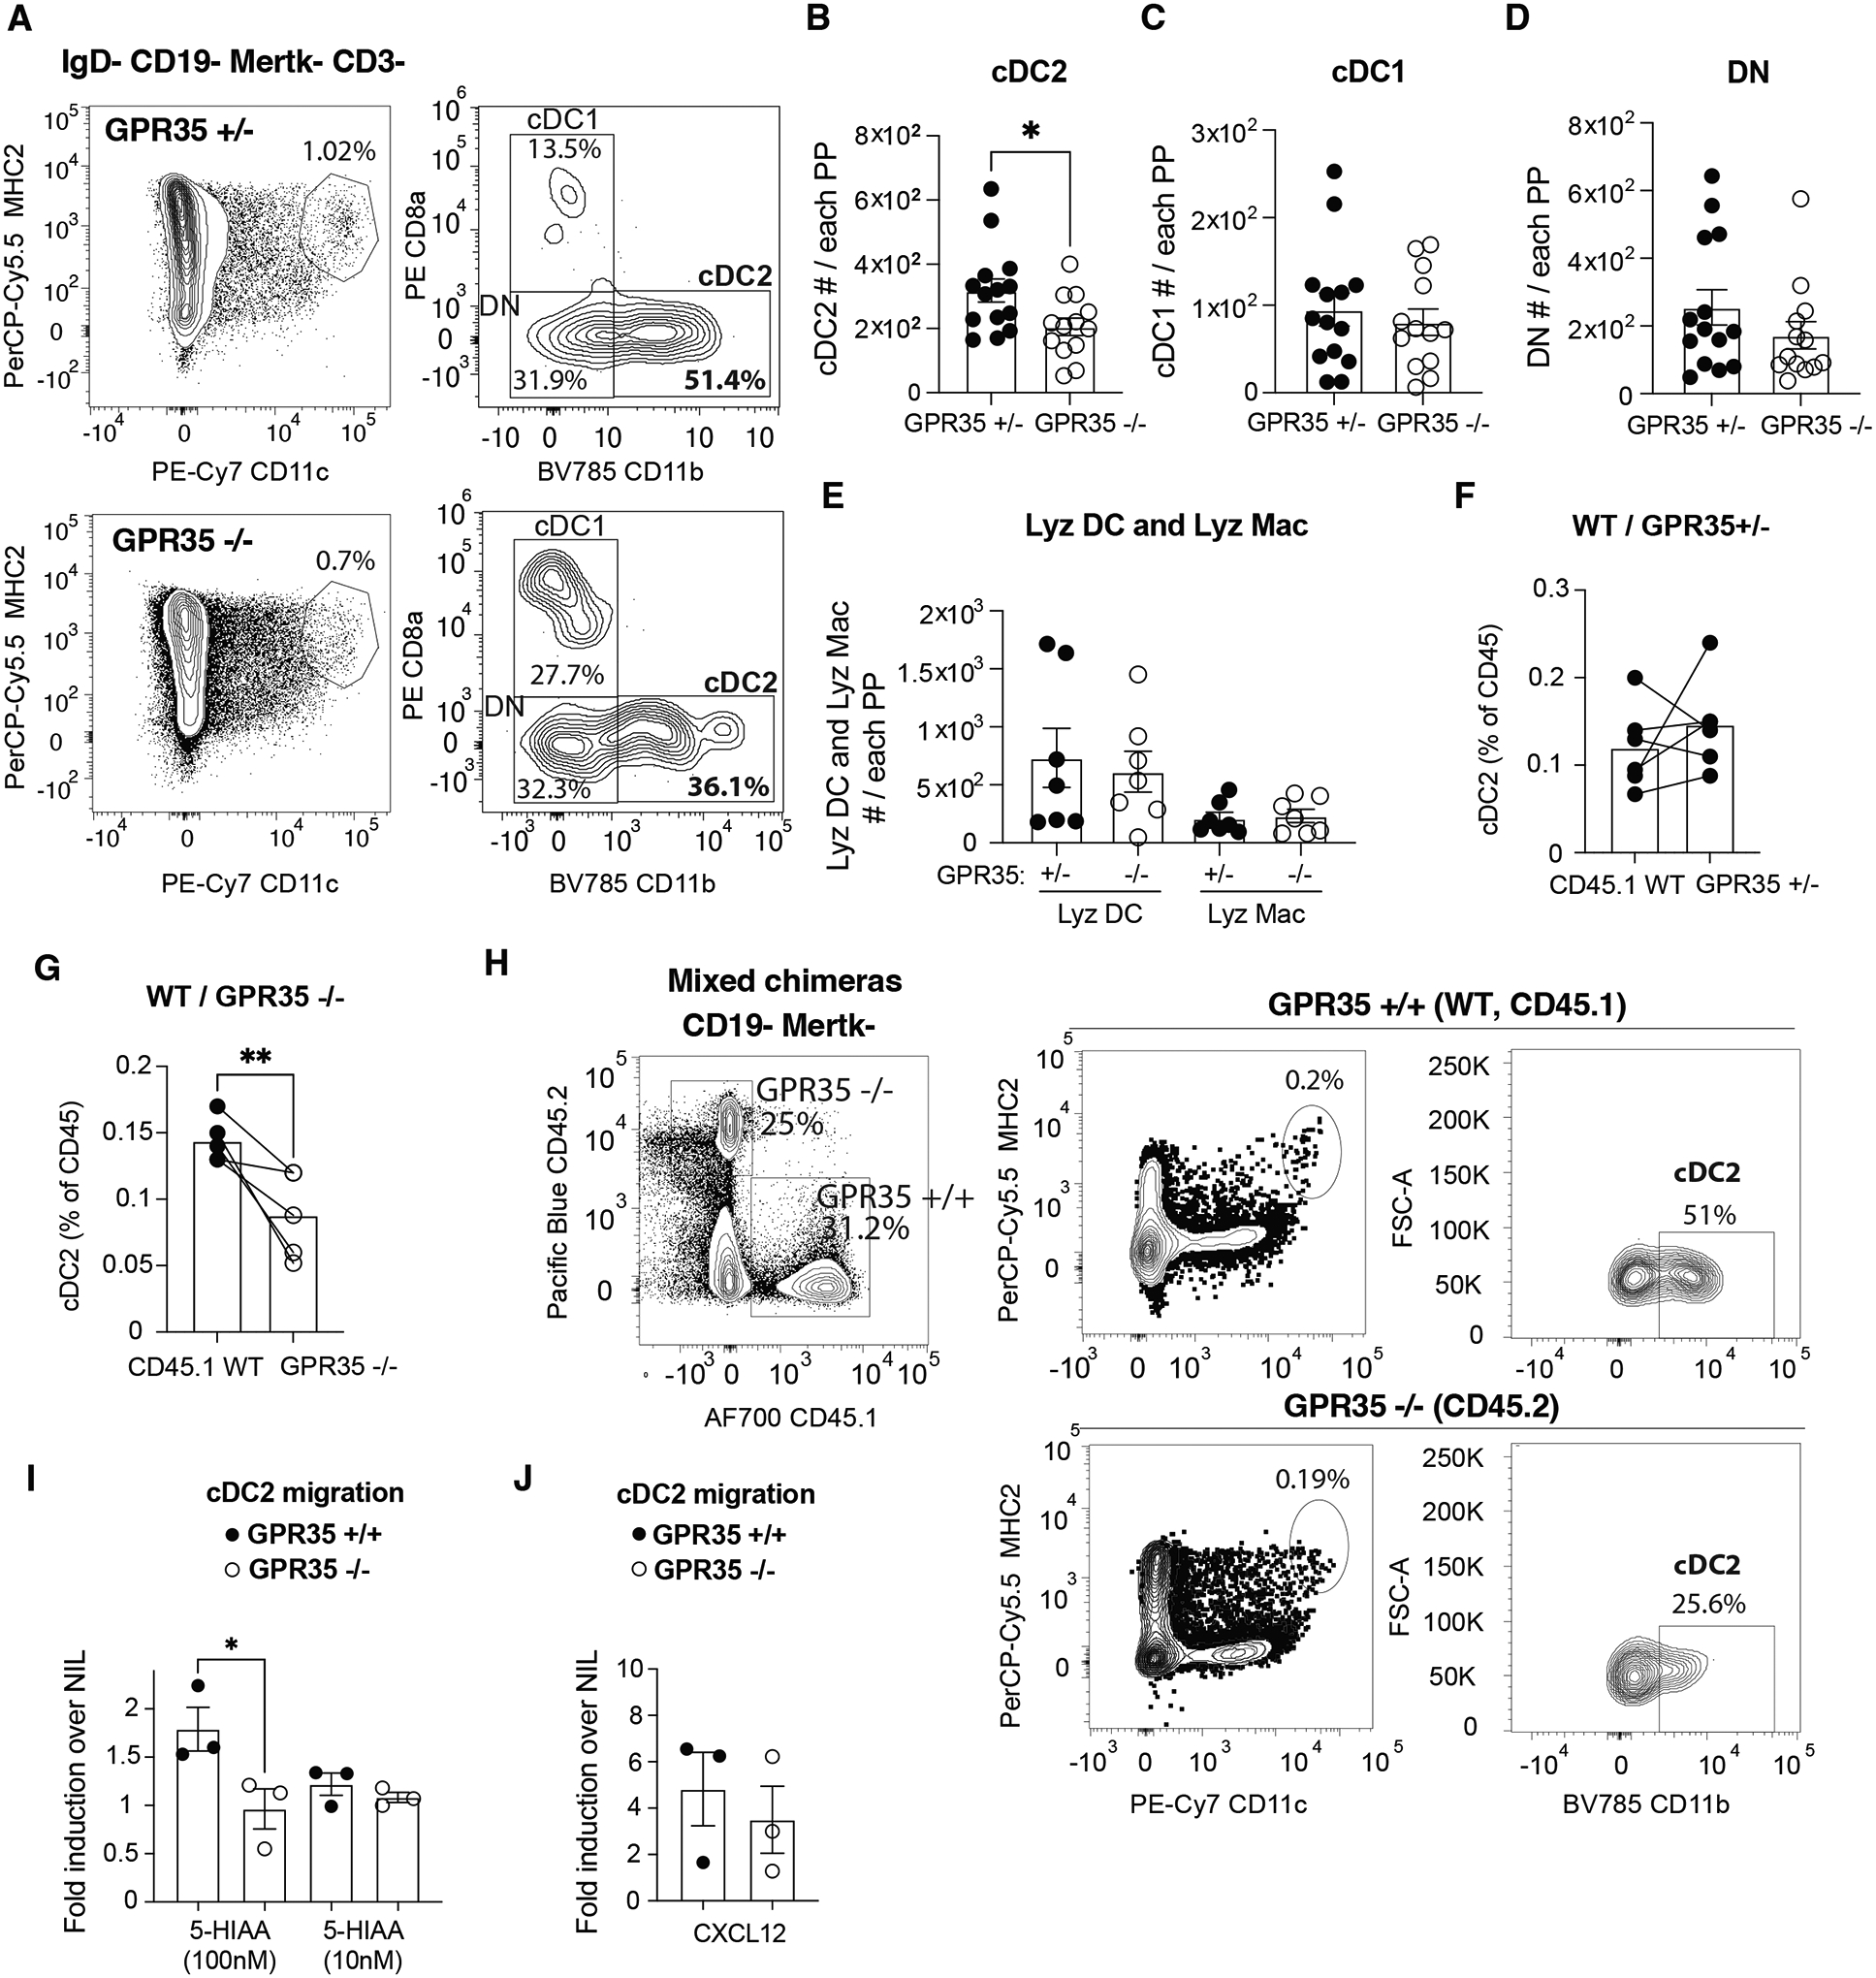
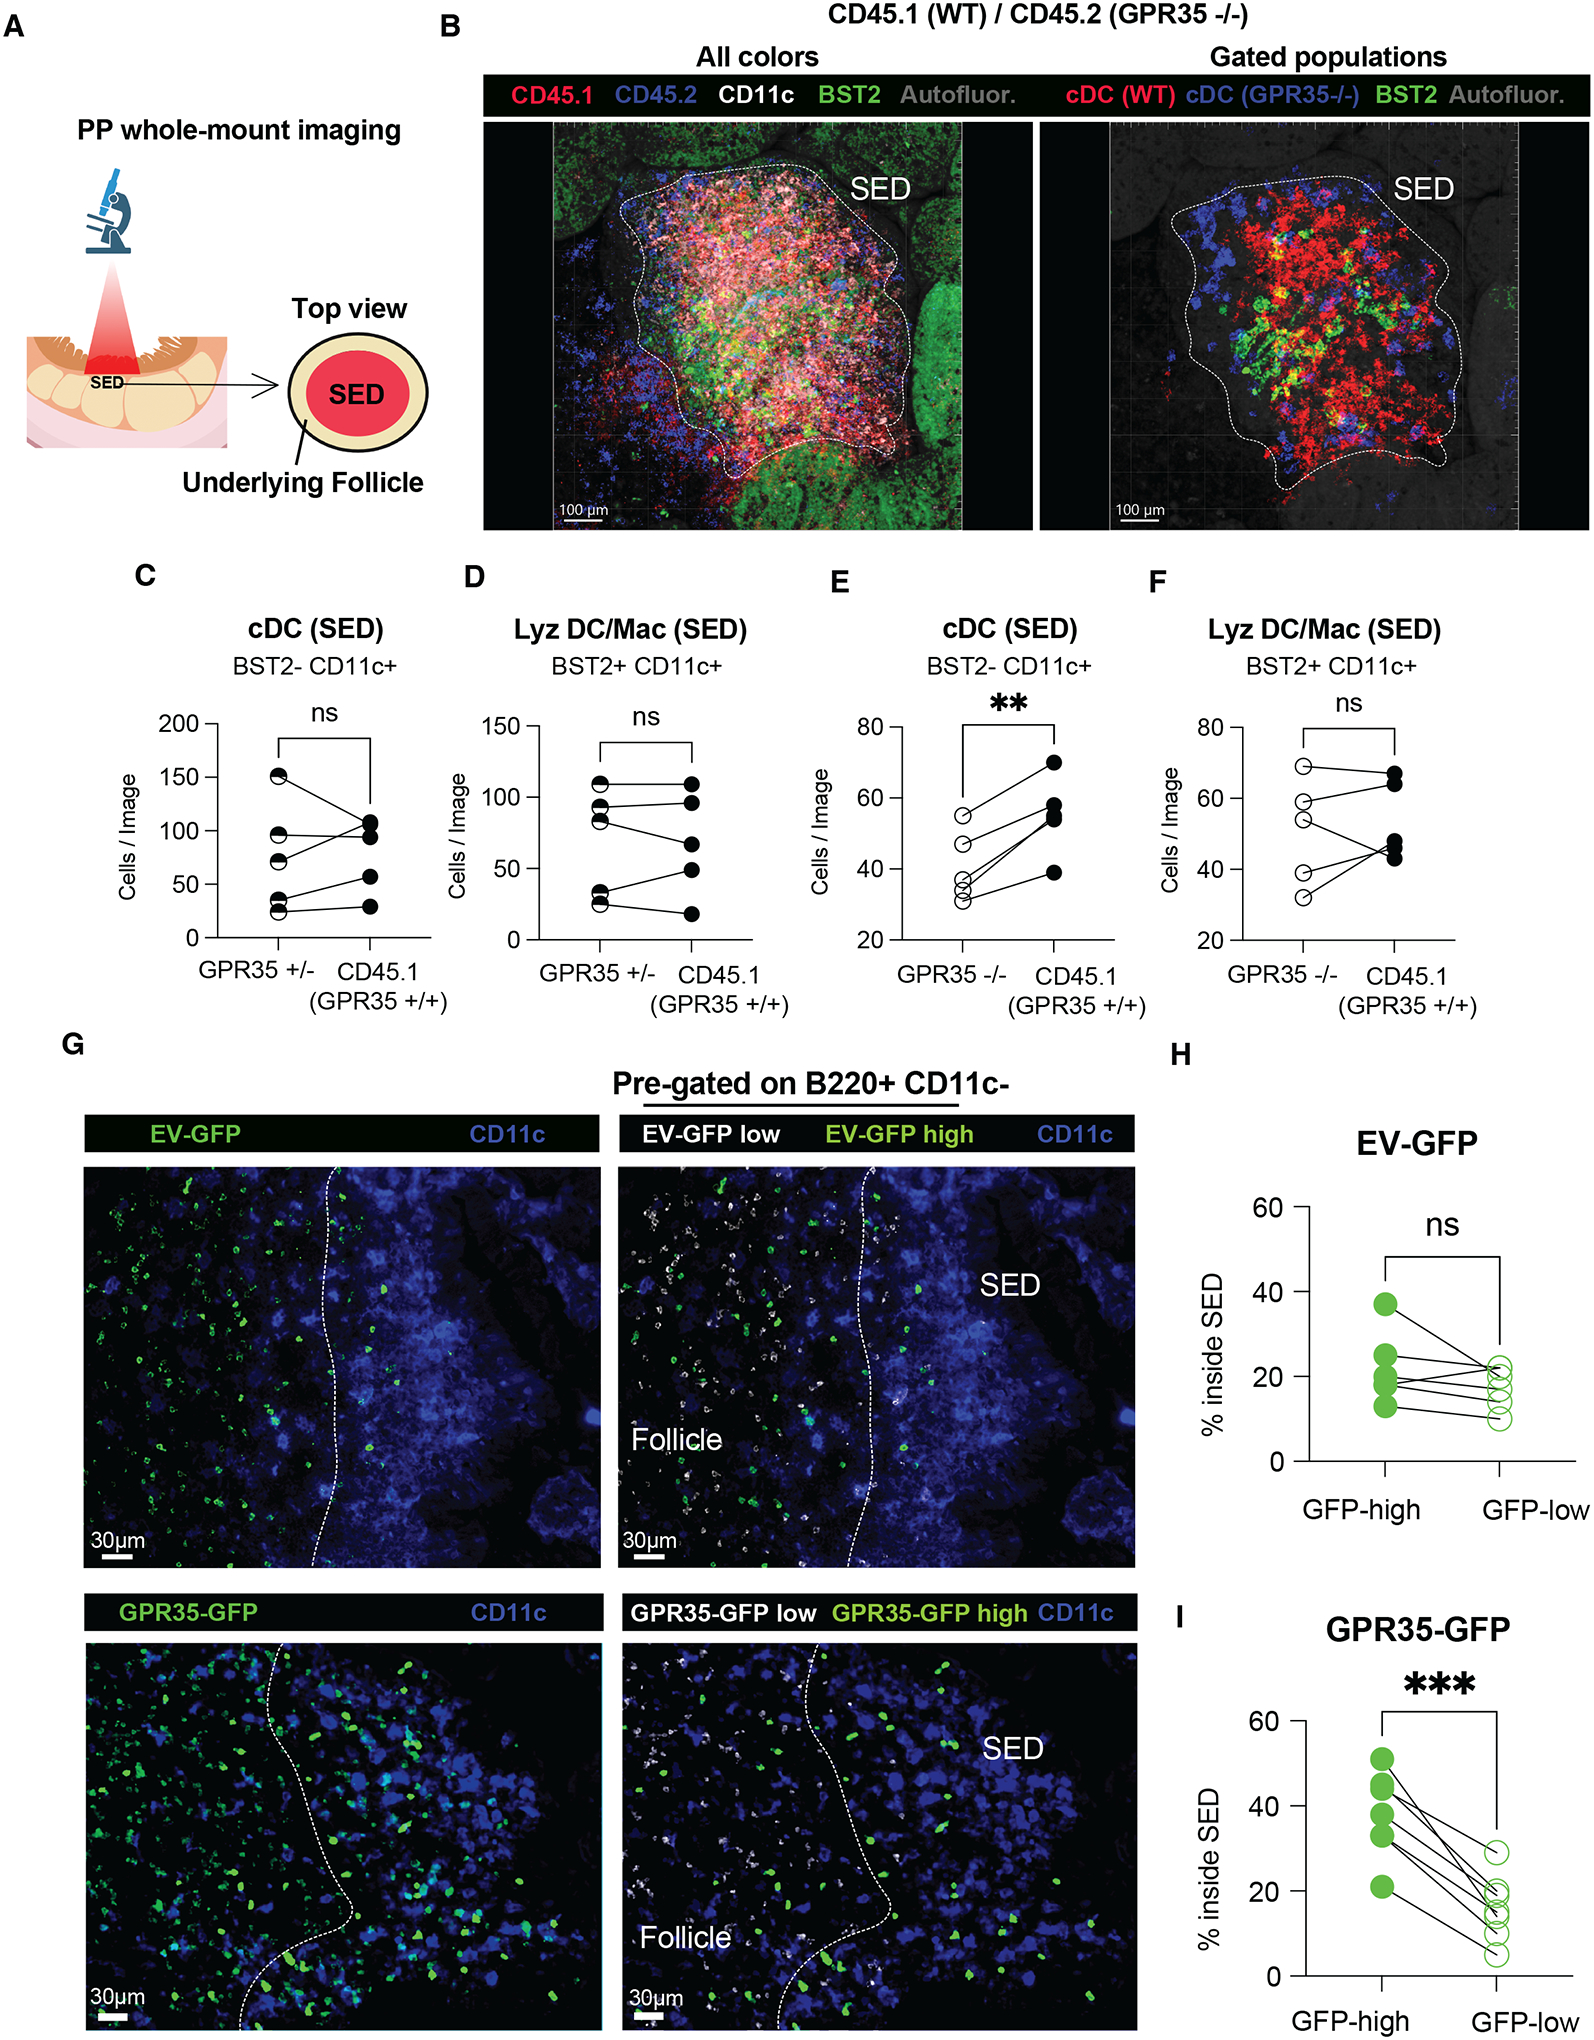
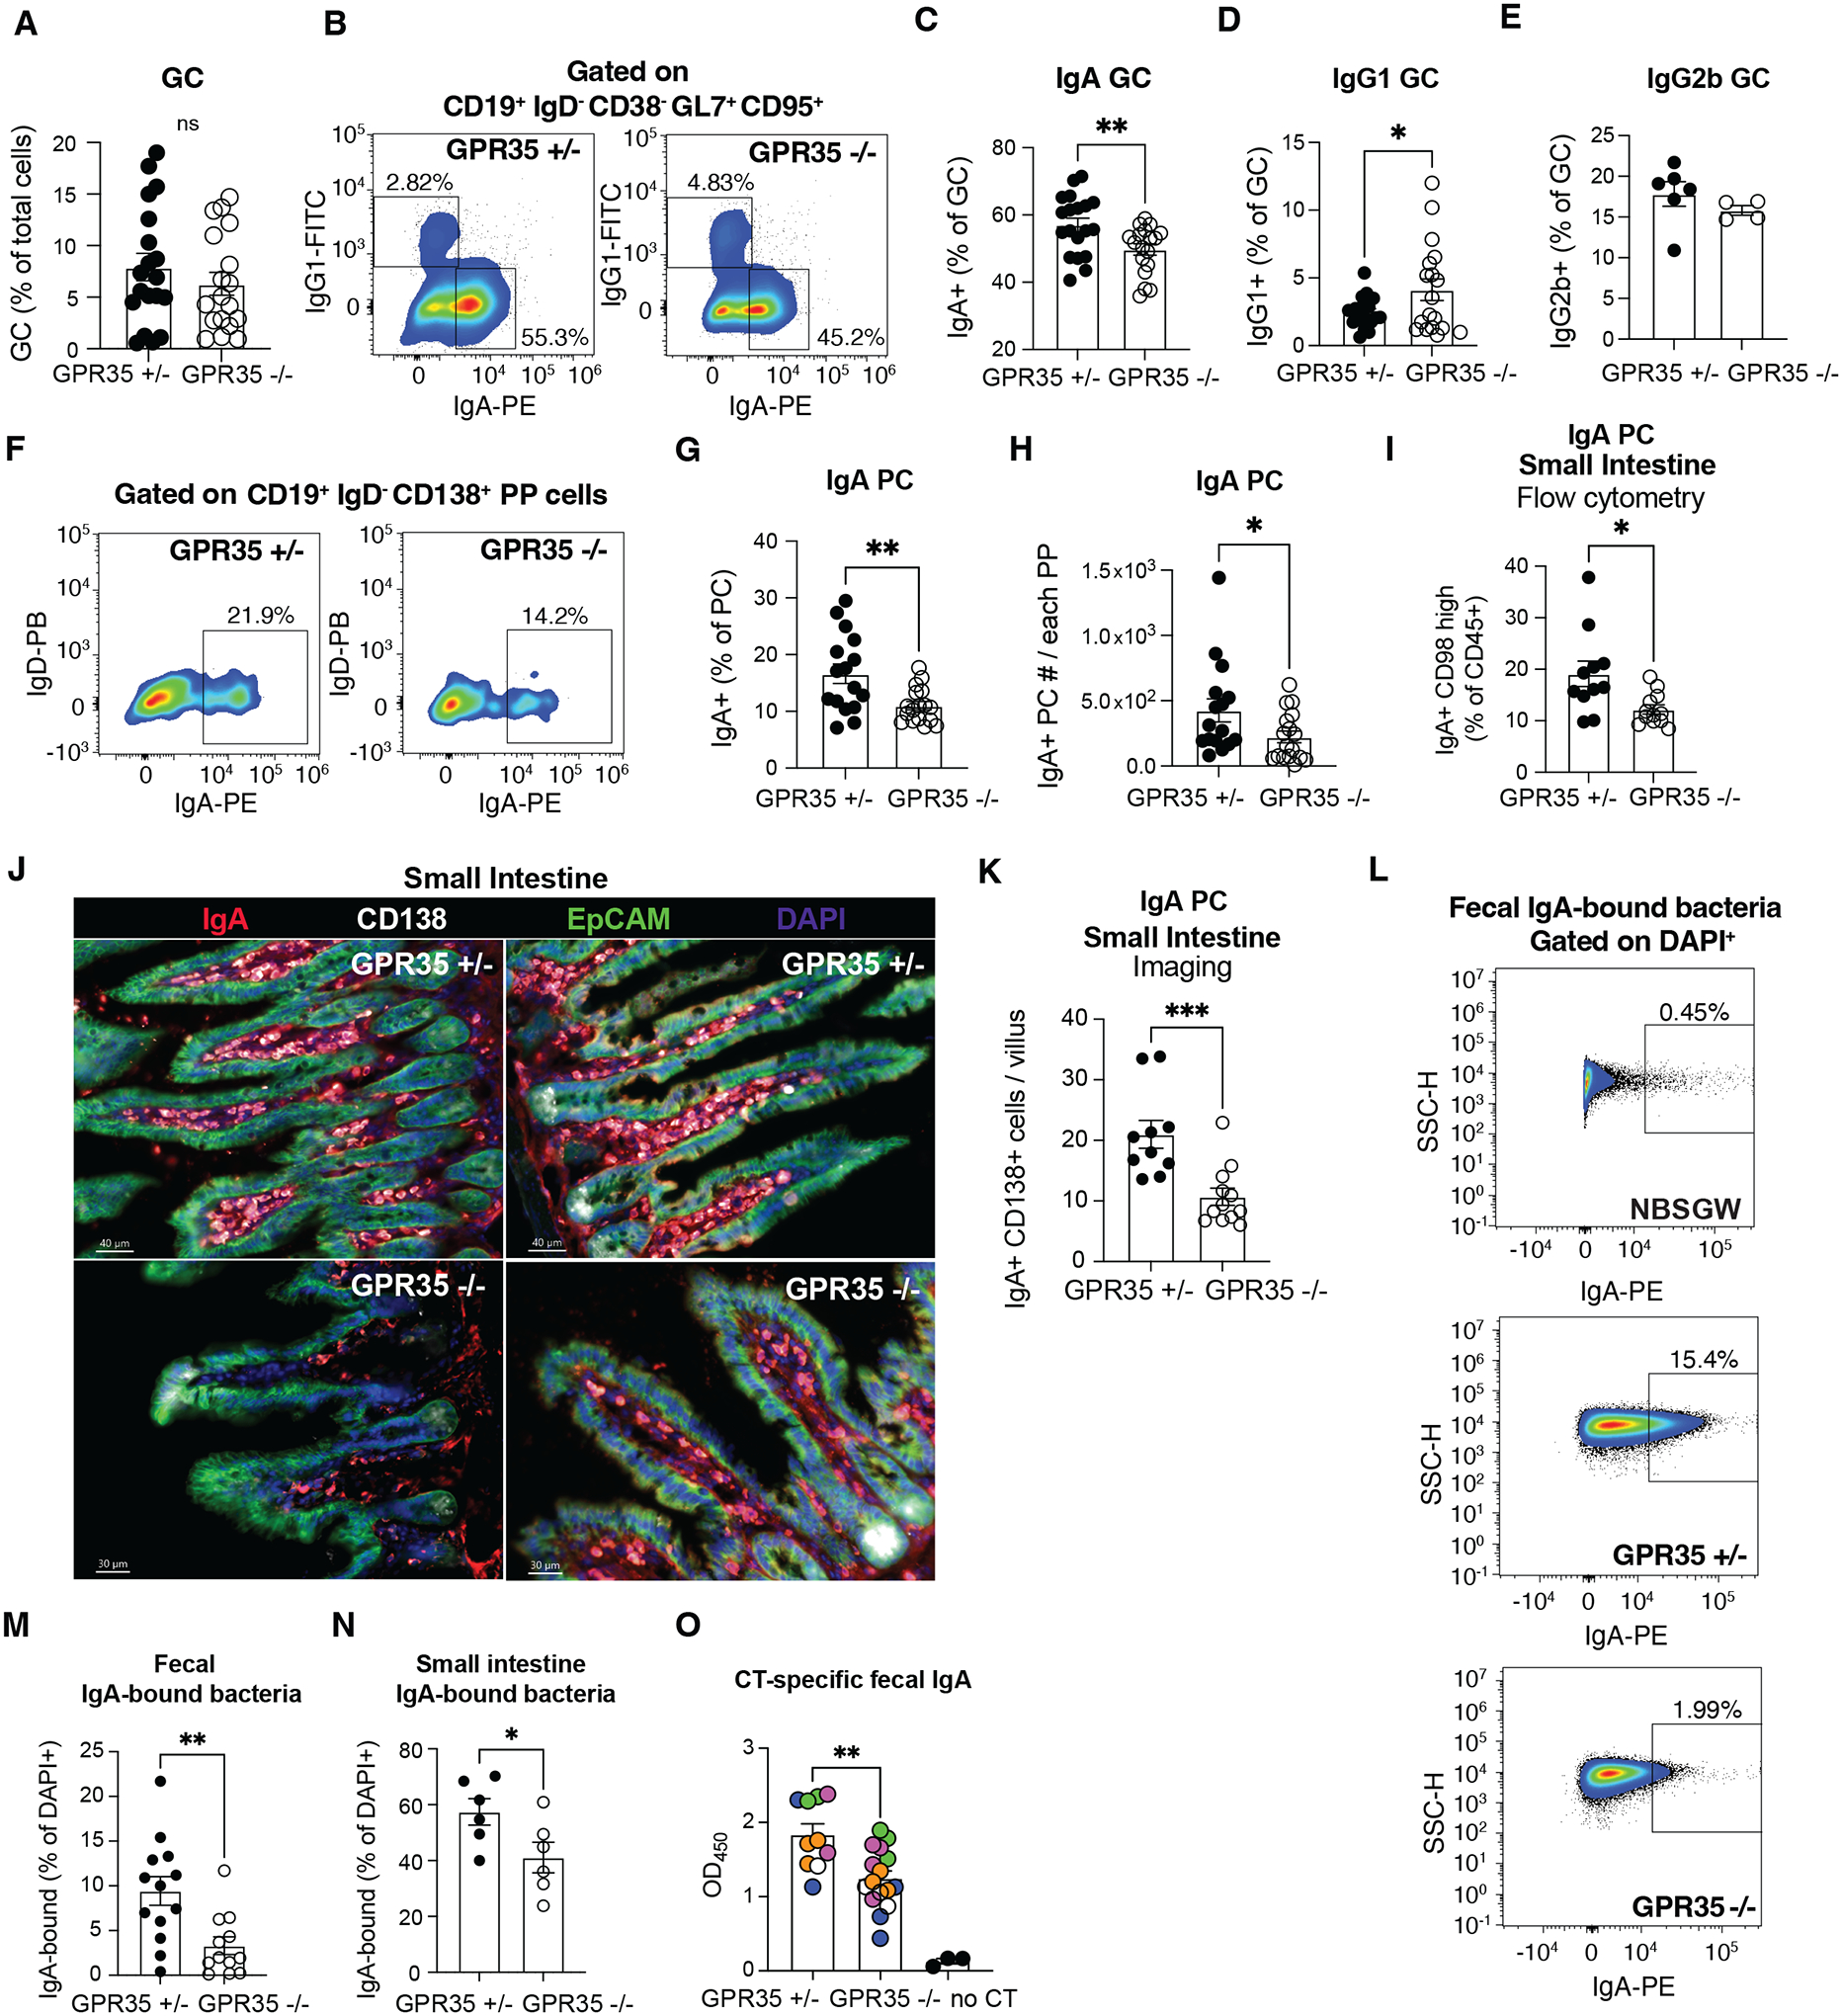
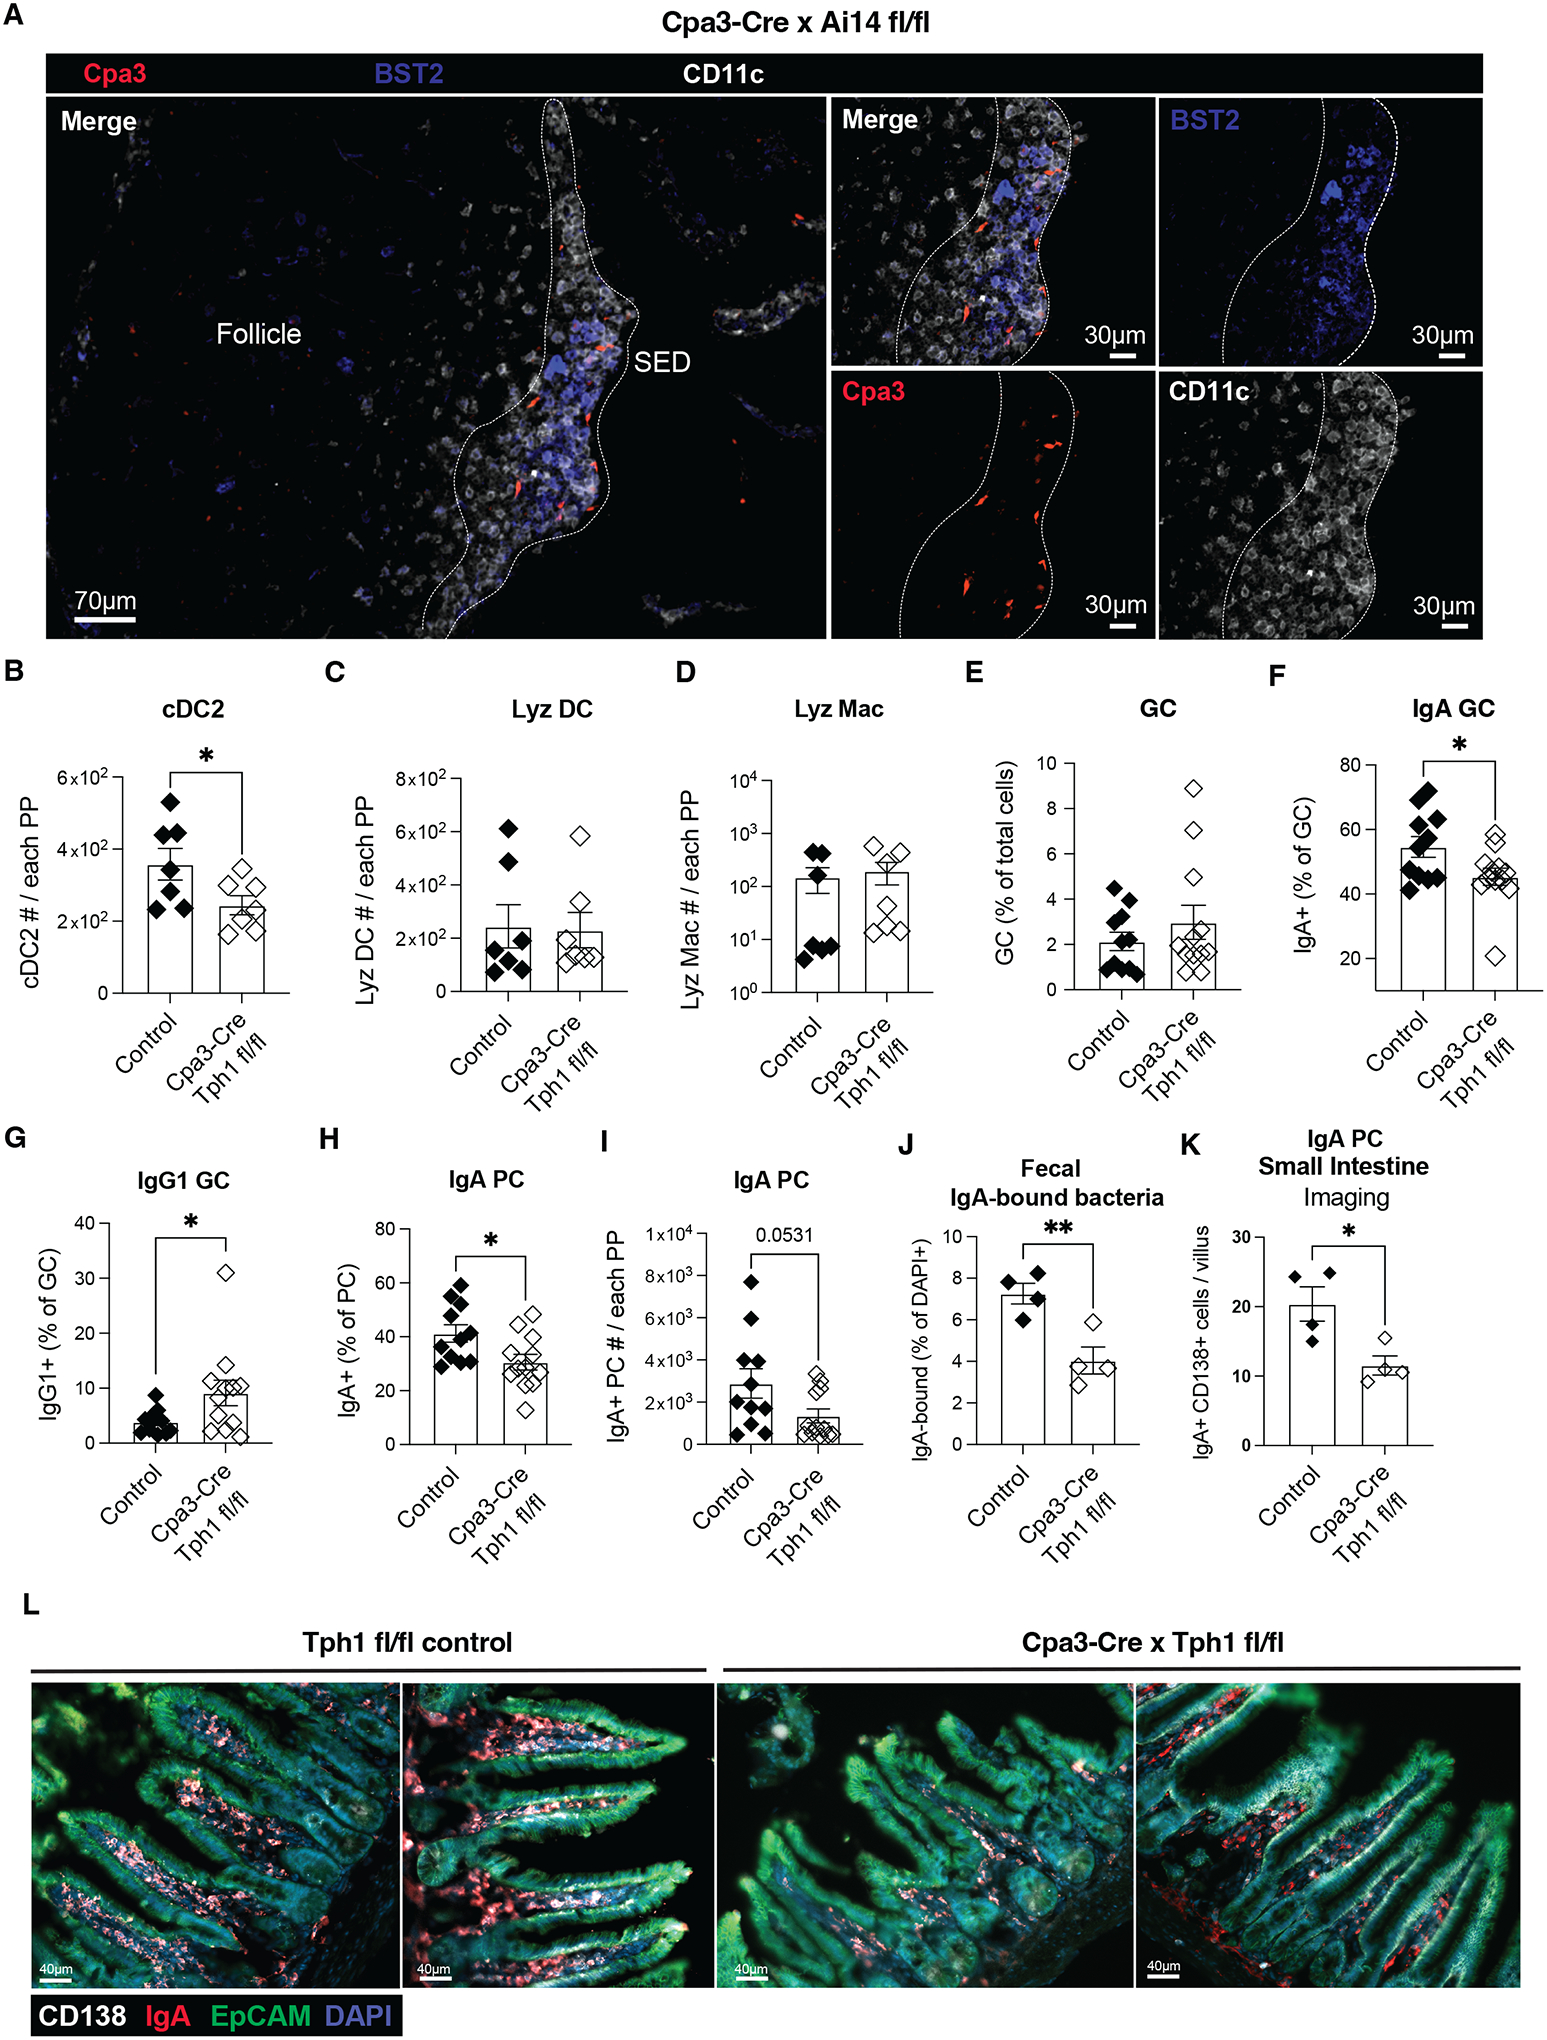
Peyer's patches (PPs) are lymphoid structures situated adjacent to the intestinal epithelium that support B cell responses that give rise to many intestinal IgA-secreting cells. Induction of isotype switching to IgA in PPs requires interactions between B cells and TGFβ-activating conventional dendritic cells type 2 (cDC2s) in the subepithelial dome (SED). However, the mechanisms promoting cDC2 positioning in the SED are unclear. Here, we found that PP cDC2s express GPR35, a receptor that promotes cell migration in response to various metabolites, including 5-hydroxyindoleacetic acid (5-HIAA). In mice lacking GPR35, fewer cDC2s were found in the SED, and frequencies of IgA+ germinal center (GC) B cells were reduced. IgA plasma cells were reduced in both the PPs and lamina propria. These phenotypes were also observed in chimeric mice that lacked GPR35 selectively in cDCs. GPR35 deficiency led to reduced coating of commensal bacteria with IgA and reduced IgA responses to cholera toxin. Mast cells were present in the SED, and mast cell-deficient mice had reduced PP cDC2s and IgA+ cells. Ablation of tryptophan hydroxylase 1 (Tph1) in mast cells to prevent their production of 5-HIAA similarly led to reduced PP cDC2s and IgA responses. Thus, mast cell-guided positioning of GPR35+ cDC2s in the PP SED supports induction of intestinal IgA responses.


Conflict of interest statement

Competing interests.

D.S. is a founder of and holds stock in Pliant Therapeutics and a member of the Scientific Advisory Board for Genentech and Amgen. J.G.C. is a member of the Scientific Advisory Board of BeBio Pharma and consults for Lycia Therapeutics and DrenBio Inc. All other authors declare that they have no competing interests.

Figures

Figure 1.
Figure 1.. GPR35 promotes cDC2 maintenance in Peyer patches.
A. Flow cytometry plots showing cDC percentages in PPs from control (GPR35+/−, top) and GPR35−/− (bottom) mice. B-E. Absolute numbers of (B) cDC2 (IgD CD19 CD3 Mertk CD11c+ MHC2+ CD11b+), (C) cDC1 (IgD CD19 CD3 Mertk CD11c+ MHC2+ CD8a+), (D) DN DC (IgD CD19CD3 Mertk CD11c+ MHC2+ CD11b CD8a), (E) Lyz DC (IgD CD19 CD3 BST2+ CD11c+ MHC2+ CD4) and Lyz Macrophages (Mac, IgD CD19 CD3 BST2+ CD11c+ MHC2+ CD4+) in PPs from GPR35+/− and GPR35−/− mice. n= 14 GPR35+/− in B-D; n=13 GPR35−/− in B-D; n=7 in E. Data are pooled from 3 independent experiments. F-H. Quantification of cDC2 % (out of cDC) in (F) CD45.1 WT/ CD45.2 GPR35+/− and (G) CD45.1 WT/CD45.2 GPR35−/− mixed BM chimeras and (H) example flow cytometry plots. n=5 in F; n=4 in G. Data are pooled from 2 independent experiments. I, J. Quantification of GPR35+/+ and GPR35−/− cDC2 migration to (I) 5-HIAA and (J) CXCL12 at the indicated concentrations in Transwell migration assays. Each dot represents one independent experiment. Data are pooled from 3 independent experiments and are plotted as fold migration over nil to allow comparisons between experiments that have different baseline migration. * p<0.05; ** p<0.005; *** p<0.0005. Data are presented as mean ± SEM. Two-tailed unpaired t-tests (B-E), paired- t-tests (F, G), and two-way ANOVA with multiple comparisons test (I) was performed.
Figure 2.
Figure 2.. GPR35 drives cDC localization within SED.
A, B. Schematic representation (A) and confocal maximum intensity projections (B) of whole-mount PP SED from CD45.1 WT/CD45.2 GPR35−/− mixed chimera. Images show CD45.2 (blue), CD45.1 (red), BST2 (green), and CD11c (white) signal (B, left); or cDC WT (red), cDC GPR35−/(blue) and BST2+ Lyz DC/Mac (green) gated populations (B, right). The white dashed line delimits the SED and was depicted based on CD11c positivity. C-F. Quantification of BST2 CD11c+ (cDCs, C and E), BST2+ CD11c+ (Lyz DC/Mac, D and F) cells from images of the type shown in B and Supplementary Movies 1 and 2. n=5. Data are pooled from 2 independent experiments. SED=subepithelial dome. * p<0.05; ** p<0.005; *** p<0.0005. Data are presented as mean ± SEM. G. Immunofluorescence micrographs showing PPs from EV-GFP (top) and GPR35-GFP (bottom) overexpressing chimeric mice. GFP total (green, left panels) and CD11c (purple, all panels) staining are shown. Masked channels of GFP low (white, right panel), GFP high (green, right panel) are also shown. Dashed line shows boundary between SED and follicle. H, I. Quantification of EV-GFP (H) and GPR35-GFP (I) high and low cell % inside the SED from images of the type shown in A. n=6 in H; n=7 in I. Data are pooled from 2 independent experiments. SED=subepithelial dome. O. Quantification of CT (cholera toxin)-binding IgA relative abundance in CT-immunized GPR35+/−, GPR35−/− and non-immunized controls (no CT). n=10 (GPR35+/−); n=16 (GPR35−/−); n=3 (no CT). Data are pooled from 2 independent experiments and co-caged mice are shown in the same color. Data were pooled from 3 independent experiments. * p<0.05; ** p<0.005; *** p<0.0005. Data are presented as mean ± SEM. Paired-t-tests were used.
Figure 3.
Figure 3.. GPR35 supports intestinal IgA B cell responses.
A. Quantification of GC cells % (CD19+ IgD CD38 Gl7+ CD95+ out of total cells) in PPs from control (GPR35+/−) and GPR35−/− mice using indicated markers. B. Flow cytometry plots showing % of IgA+ and IgG1+ GC B cells. C-E. Summary graphs showing % GC B cells that were IgA+ (C) IgG1+ (D) or IgG2b+ (E) in PPs from GPR35+/− and GPR35−/− mice. n=19 (GPR35+/− A, C, D); n=18 (GPR35−/−, A, C, D); n=6 (GPR35+/−, E), n=4 (GPR35−/−, E). Data are pooled from 4 (A, C, D) or 2 (E) independent experiments. F. Representative flow cytometry plots showing % of IgA+ (out of CD19+ IgD CD138+ plasma cells). G, H. Quantification of IgA+ % (out of CD19+ IgD CD138+ plasma cells, G) and absolute numbers (H) of IgA+ plasma cells in PPs from GPR35+/− and GPR35−/− mice using gating as in F. n=16 (Gpr35+/−, G, H); n=17 (GPR35−/−, G, H). Data are pooled from 4 independent experiments. I-K. Quantification of IgA+ CD98 high plasma cell % (out of CD45+) by flow cytometry (I) and of IgA+ CD138+ plasma cells quantification by imaging (J, K) in the small intestine of GPR35+/− and GPR35−/− mice. (J) Shows two representative epifluorescence images of data quantified in (K) of small intestinal villi from GPR35+/− (upper) and GPR35−/− (lower) mice. IgA (red), CD138 (white), EpCAM (green) and DAPI (blue) staining are shown. n=10 (GPR35+/−, I, K); n=12 (GPR35−/−, I, K). L. Representative flow cytometry plots showing % (out of DAPI+) of IgA-bound fecal bacteria from lymphocyte-deficient NBSGW (negative control, top), GPR35+/− (middle) or GPR35−/− (bottom) mice. N-M. Quantification of IgA-bound fecal (M) or small intestine (N) bacteria in GPR35+/− and GPR35−/− mice. n=13 (GPR35+/−, M); n=12 (GPR35−/−, M); n=6 (GPR35+/− and GPR35−/−, N). Data are pooled from 3 (M) or 2 (N) independent experiments. Data are representative of 3 independent experiments. * p<0.05; ** p<0.005; *** p<0.0005. Data are presented as mean ± SEM. Two-tailed unpaired t-tests were performed.
Figure 4.
Figure 4.. Mast cell-derived serotonin metabolite(s) support cDC2 maintenance and localization within SED to boost intestinal IgA responses.
A. Epifluorescence micrographs of PPs from Cpa3-Cre × Ai14fl/fl (mast cell reporter) mice. Cpa3 (red), BST2 (blue) and CD11c (white) signals and staining are shown. The white dashed lined delimits the SED and was depicted based on CD11c positivity. Images are representative of at least 4 mice and 2 independent experiments. B-D. Quantification of cDC2 (B), Lyz DC (C) and Lyz Mac (D) absolute numbers in PPs from control (Cpa3-Cre Tph1fl/wt and Tph1fl/fl) and Cpa3-Cre Tph1fl/fl mice. n=7. Data are pooled from 2 independent experiments. E-J. Quantification of (E) GC cells % (CD19+IgDCD38GL7+CD95+ out of total cells), (F) IgA+ GC cell % and (G) IgG1+ GC cell % (out of CD19+ GL7+ CD95+ CD38 IgD), (H) IgA+ plasma cells % (out of CD19+ IgD CD138+), (I) IgA+ plasma cells numbers, and (J) IgA-bound fecal bacteria % (out of DAPI+) in control (Cpa3-Cre Tph1fl/wt and Tph1fl/fl) and Cpa3-Cre Tph1fl/fl mice. n=11 (control, E-I); n=4 (control, J); n=12 (Cpa3-Cre × Tph1fl/fl, E-I); n=4 (Cpa3-Cre × Tph1fl/fl, L). Data are pooled from 3 (E-I) or 2 (J) independent experiments. Data are representative of 3 independent experiments. K, L. Quantification (K) of CD138+ IgA+ plasma cells per villus in images (L) from Tph1fl/fl control (two examples, left) and Tph1fl/fl Cpa3-Cre (two examples, right) mice. n=12. Data are pooled from 2 independent experiments. * p<0.05; ** p<0.005; *** p<0.0005. Data are presented as mean ± SEM. Two-tailed unpaired t-tests were performed.

References

    1. Macpherson AJ, Yilmaz B, Limenitakis JP, Ganal-Vonarburg SC, IgA Function in Relation to the Intestinal Microbiota. Annu. Rev. Immunol 36, 359–381 (2018). - PubMed
    1. Hand TW, Reboldi A, Production and Function of Immunoglobulin A. Annu. Rev. Immunol 39, 695–718 (2021). - PubMed
    1. Reboldi A, Cyster JG, Peyer’s patches: organizing B-cell responses at the intestinal frontier. Immunol. Rev 271, 230–245 (2016). - PMC - PubMed
    1. Travis MA, Sheppard D, TGF-beta activation and function in immunity. Annu. Rev. Immunol 32, 51–82 (2014). - PMC - PubMed
    1. Reboldi A, Arnon TI, Rodda LB, Atakilit A, Sheppard D, Cyster JG, IgA production requires B cell interaction with subepithelial dendritic cells in Peyer’s patches. Science 352, aaf4822 (2016). - PMC - PubMed

Publication types

Substances