. 2024 Mar;10(9):eadj4698.
doi: 10.1126/sciadv.adj4698. Epub 2024 Mar 1.

The FLRT3-UNC5B checkpoint pathway inhibits T cell-based cancer immunotherapies

Affiliations

The FLRT3-UNC5B checkpoint pathway inhibits T cell-based cancer immunotherapies

Kushal Prajapati et al. Sci Adv. 2024 Mar.

Abstract

Cancers exploit coinhibitory receptors on T cells to escape tumor immunity, and targeting such mechanisms has shown remarkable clinical benefit, but in a limited subset of patients. We hypothesized that cancer cells mimic noncanonical mechanisms of early development such as axon guidance pathways to evade T cell immunity. Using gain-of-function genetic screens, we profiled axon guidance proteins on human T cells and their cognate ligands and identified fibronectin leucine-rich transmembrane protein 3 (FLRT3) as a ligand that inhibits T cell activity. We demonstrated that FLRT3 inhibits T cells through UNC5B, an axon guidance receptor that is up-regulated on activated human T cells. FLRT3 expressed in human cancers favored tumor growth and inhibited CAR-T and BiTE + T cell killing and infiltration in humanized cancer models. An FLRT3 monoclonal antibody that blocked FLRT3-UNC5B interactions reversed these effects in an immune-dependent manner. This study supports the concept that axon guidance proteins mimic T cell checkpoints and can be targeted for cancer immunotherapy.


Figures
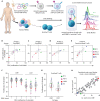
Fig. 1.
Fig. 1.. An axon guidance coinhibitory mimicry screen using primary human T cells.
(A) A subset of human AGMs was screened by cell-cell interaction-based gain of function for T cell proliferation. (B to E) CD8+ and CD4+ T cell proliferation based on CFSE dilution from total cryopreserved PBMCs (B and C), fresh PBMCs (D), or fresh enriched T cells (E) from healthy donor leukopaks. (F and G) Violin plots of CD8+ and CD4+ T cell proliferation from total PBMC screens (F) and enriched T cell screen (G). Each data point in (B) to (G) represents one technical replicate for each donor. Data from single screens performed over four different donors are shown. (H) All genes were rank-scored for individual screens for their effect on the T cell proliferation. The averaged rank scores for all screens are shown, with the most costimulatory and inhibitory scores being 1 and 57, respectively, to identify candidate immune inhibitory genes.
Fig. 2.
Fig. 2.. FLRT3 inhibits T cell proliferation and function in vitro.
(A) Illustration of experimental approaches for validation of FLRT3 screening results using 293T-OKT3 cell-based or FLRT3-Fc fusion protein-based systems. (B to E) CFSE-labeled human PBMCs from three healthy donors were cocultured with 293T-OKT3 cells transfected with FLRT3, PD-L1, and B7-1 genes followed by analysis of proliferation by CFSE dilution (B and C) and IFN-γ production by ELISA (D and E). Quantification of proliferating CD8+ T cells (B) and IFN-γ production (D) is shown for one representative donor. Each data point represents one technical replicate, and error bars denote SD. (C and E) Percent change mediated by individual genes in CD8+ T cell proliferation (C) and IFN-γ production (E) in comparison to EV control for all three donors in a pairwise fashion. (F and G) Human PBMCs from a healthy donor were labeled with CFSE and activated on plates coated with titrated OKT3 and FLRT3-Fc (10 μg/ml). Proliferation of CD8+ T cells was analyzed by CFSE dilution via flow cytometry (F), and IFN-γ production was measured in the supernatants by ELISA (G). Error bars denote SD. n = 3 technical replicates for each data point. Data representative of at least two independent experiments. Statistical significance was determined for (B) and (D) by one-way ANOVA with Tukey’s post hoc test for multiple comparisons and for (C) and (E) by repeated-measures one-way ANOVA with Tukey’s post hoc test for multiple comparisons to account for matched values for individual donors. For all the data, *P < 0.05, **P < 0.01, ***P < 0.001, ****P < 0.0001.
Fig. 3.
Fig. 3.. FLRT3 inhibits T cells by interacting with UNC5B receptor.
(A and B) Human PBMCs from three healthy donors were activated with CD3 + CD28 Abs, and FLRT3 binding partner expression was analyzed on CD8+ T cells on days 0 (naïve), 3, and 4 (activated). (A) Representative histograms for UNC5B and LPHN1 staining on day 3, and (B) quantification of % CD8+ T cell expression. Each dot represents one donor, and error bars denote SD. (C) Representative dot plots of UNC5B and checkpoint receptor expression in CD8+ T cells from PBMCs activated with CD3 Abs for 10 days. (D) Illustration showing Jurkat-NG reporter system. (E and F) Jurkat-NG cells were transduced with LPHN3 or UNC5B and cocultured with EV- or FLRT3-expressing 293T-OKT3 cells for 16 hours, followed by GFP quantification by flow cytometry. Quantification of GFP MFI in Jurkat-NG cells with or without (E) UNC5B or (F) LPHN3 overexpression. (G) UNC5B–Jurkat-NG cells were cocultured with 293T-OKT3 cells expressing FLRT3, PD-L1, or CD80 for 16 hours, and NF-κB activity (GFP) was measured by flow cytometry. Quantification of GFP is shown. (H and I) UNC5B–Jurkat-NG cells were activated with (H) CD3 + CD28 Abs or (I) soluble CD3 Abs on control Fc of FLRT3 Fc–coated plates for 16 hours, and NF-κB activity (GFP) was measured by flow cytometry. Quantification of GFP levels is shown. For (E) to (I), each data point represents one technical replicate and error bars denote +SD. Data representative of at least two independent experiments. Statistical significance was determined for (E), (F), (H), and (I) by unpaired t test and for (G) by one-way ANOVA with Tukey’s post hoc test for multiple comparisons. For all the data, *P < 0.05, **P < 0.01, ***P < 0.001, ****P < 0.0001.
Fig. 4.
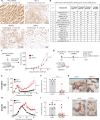
Fig. 4.. FLRT3 is expressed on tumors and suppressed T cell–based immunotherapies.
Tissues from 15 tumor types were stained with an FLRT3 mAb to evaluate FLRT3 membrane expression. (A) Representative FLRT3 staining in renal cancer (papillary and clear cell), bladder, and head and neck cancers. (B) Pathologist scoring of membrane FLRT3 expression in several tumor types. N indicates number of patients screened for a given tumor type. (C) FLRT3+ renal cancer model in NSG mice. EV- or FLRT3-transduced 293T cells were admixed with human PBMCs and injected in mice intradermally, followed by tumor growth measurements every 2 to 3 days. n = 6 animals per group. Data representative of two independent experiments. (D to J) Soluble FLRT3 Fc testing in HT29-OKT3– or WT-bearing NSG mice. (D) Schematic of experimental design. HT29-OKT3 or WT cells were injected. For the HT29-OKT3 model, PBMCs from a single donor were injected. For the HT29 WT model, PBMCs from five donors were injected. ID, intradermally; IP, intraperitoneally. (E and H) Tumor growth curve. (F and I) Clinical GVHD score measurement on day 59. (G and J) Representative photographs of GVHD development in control Fc– and FLRT3 Fc–treated mice for HT29-OKT3 (E to G) and WT (H to J) models. For the OKT3 model, n = 6 animals for control Fc and n = 7 animals for FLRT3-Fc. For WT, n = 7 animals for control Fc and n = 8 animals for FLRT3-Fc. groups. Data representative of two independent experiments. Error bars denote +SEM. Statistical significance was determined for (C), (E), and (H) by paired t test and for (F) and (I) by unpaired t test. *P < 0.05, **P < 0.01, ***P < 0.001, ****P < 0.0001.
Fig. 5.
Fig. 5.. FLRT3 suppresses T cell immunity, infiltration, and tumor engagement in zebrafish models.
(A) Representative schematic of rag2∆/∆, il2rga−/− zebrafish experimental model to evaluate FLRT3-overexpressing cancer cell lines in the context of CAR-T cells and BiTEs. (B) Representative microscopy images showing recruitment (left two panels) and close cell interaction (engagement) (right panel) of T cells (blue) to the RD tumor cells (red). 3D modeling was used to assess T cell:tumor cell engagement. (C) OVCAR-5 cells with control CD8+ T cells, EV–OVCAR-5 + EpCAM CAR-T cells, and FLRT3–OVCAR-5 + EpCAM CAR-T cell effect on tumor growth (tumor cell counts), T cell recruitment/infiltration (T cell counts), and T cell engagement (percentage of T cells in contact with tumor). (D) Same as (C) except using RD tumor model with EV-RD + EGFR-CD3 BiTEs or FLRT3-RD + EGFR-CD3 BiTEs. For (C), six animals for EV + CD8 and FLRT3 + EpCAM CAR groups, and five animals for EV + EpCAM CAR. For (D), five animals for EV + CD8 and EV + CD8 + BiTE groups, and six animals for FLRT3 + CD8 + BiTE. Each data point represents one animal, and error bars denote ±SD. Data representative of two independent experiments. Statistical significance was determined by one-way ANOVA with Tukey’s post hoc test for multiple comparisons. *P < 0.05, **P < 0.01, ***P < 0.001, ****P < 0.0001.
Fig. 6.
Fig. 6.. FLRT3-UNC5B blockade promoted T cell function and antitumor immunity.
(A) Quantification of GFP–NF-κB in UNC5B-Jurkat-NG cells following 16 hours of coculture with EV or FLRT3-293T-OKT3 cells, and NP591 or isotype. Data representative of two experiments. (B) Four-day activated human PBMCs from three donors were cocultured with SKOV3 cells with CD3 + CD28 Abs in the presence of NP591 or isotype Ab. Three days later, IFN-γ was measured by ELISA. (C and D) PBMCs from three healthy donors (responders) were cocultured with donor PBMCs (stimulators) at a 1:1 ratio for 7 days in the presence of irradiated SKOV3 cells. Isotype control or NP591 was added in the cultures on days 0 and 3. On day 7, supernatants were harvested for IFN-γ (C) and TNF-α (D) analysis by ELISA. Bar graph data points in (A) to (D) represent one replicate, and error bars denote SD. (E) FLRT3-293T cells were admixed with human PBMCs and injected in mice intradermally. Mice were treated with NP591 anti–PD-1, NP591 and anti–PD-1 combo, or isotype control intraperitoneally starting on day 7 every 2 to 3 days × 3 weeks, then once per week. n = 12 per group. (F) Human PBMCs were injected intravenously followed by intradermal injection of SKOV3 cells 1 day later. Mice were treated with NP591 or isotype control intraperitoneally starting on day 7 every 2 to 3 days × 2 weeks, then once per week. N = 9 for isotype, n = 10 for NP591. Error bars denote SEM in (E) and (F). Data representative of two independent experiments. Statistical significance was determined for (A) by unpaired t test, for (B) by one-way ANOVA with Tukey’s post hoc test for multiple comparisons, for (C) and (D) by two-way ANOVA with Tukey’s post hoc test for multiple comparisons, and for (E) and (F) by paired t test. *P < 0.05, **P < 0.01, ***P < 0.001, ****P < 0.0001.
Fig. 7.
Fig. 7.. FLRT3-UNC5B blockade promotes T cell–based immunotherapy activity.
(A to H) Zebrafish models were conducted as described in Fig. 5 except with NP591 (10 mg/kg) or isotype control treatments. (A and E) Illustrations for experimental EGFR-CD3 BiTE and EpCAM CAR-T systems, respectively. (B and F) Relative tumor growth, (C and G) T cell recruitment, and (D and H) T cell engagement quantification in RD and OVCAR-5 tumor zebrafish models, respectively. n = 10 animals for all the groups. Each data point represents one animal, and error bars denote ±SD. Data representative of two independent experiments. Statistical significance was determined by unpaired t test. *P < 0.05, **P < 0.01, ***P < 0.001, ****P < 0.0001.

References

    1. Hosseinkhani N., Derakhshani A., Kooshkaki O., Abdoli Shadbad M., Hajiasgharzadeh K., Baghbanzadeh A., Safarpour H., Mokhtarzadeh A., Brunetti O., Yue S., Silvestris N., Baradaran B., Immune checkpoints and CAR-T cells: The pioneers in future cancer therapies? Int. J. Mol. Sci. 21, 8305 (2020). - PMC - PubMed
    1. Wang Y., Tong Z., Zhang W., Zhang W., Buzdin A., Mu X., Yan Q., Zhao X., Chang H.-H., Duhon M., Zhou X., Zhao G., Chen H., Li X., FDA-approved and emerging next generation predictive biomarkers for immune checkpoint inhibitors in cancer patients. Front. Oncol. 11, 683419 (2021). - PMC - PubMed
    1. Davis A. A., Patel V. G., The role of PD-L1 expression as a predictive biomarker: An analysis of all US Food and Drug Administration (FDA) approvals of immune checkpoint inhibitors. J. Immunother. Cancer 7, 278 (2019). - PMC - PubMed
    1. Chocarro L., Blanco E., Arasanz H., Fernández-Rubio L., Bocanegra A., Echaide M., Garnica M., Ramos P., Fernández-Hinojal G., Vera R., Kochan G., Escors D., Clinical landscape of LAG-3-targeted therapy. Immunooncol Technol 14, 100079 (2022). - PMC - PubMed
    1. FDA approves anti-LAG3 checkpoint. Nat. Biotechnol. 40, 625 (2022). - PubMed

Publication types