. 2024 Mar;10(9):eadj5107.
doi: 10.1126/sciadv.adj5107. Epub 2024 Mar 1.

BRG1 establishes the neuroectodermal chromatin landscape to restrict dorsal cell fates

Affiliations

BRG1 establishes the neuroectodermal chromatin landscape to restrict dorsal cell fates

Jackson A Hoffman et al. Sci Adv. 2024 Mar.

Abstract

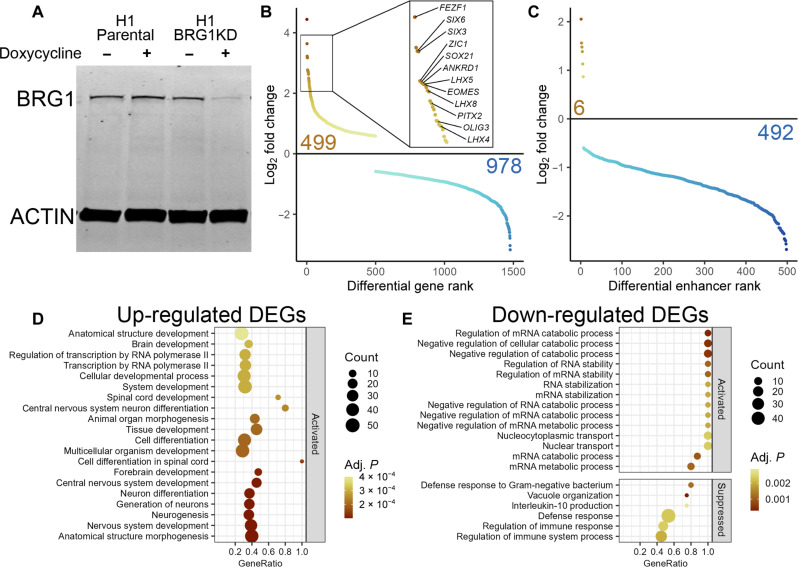
Cell fate decisions are achieved with gene expression changes driven by lineage-specific transcription factors (TFs). These TFs depend on chromatin remodelers including the Brahma-related gene 1 (BRG1)-associated factor (BAF) complex to activate target genes. BAF complex subunits are essential for development and frequently mutated in cancer. Thus, interrogating how BAF complexes contribute to cell fate decisions is critical for human health. We examined the requirement for the catalytic BAF subunit BRG1 in neural progenitor cell (NPC) specification from human embryonic stem cells. During the earliest stages of differentiation, BRG1 was required to establish chromatin accessibility at neuroectoderm-specific enhancers. Depletion of BRG1 dorsalized NPCs and promoted precocious neural crest specification and enhanced neuronal differentiation. These findings demonstrate that BRG1 mediates NPC specification by ensuring proper expression of lineage-specific TFs and appropriate activation of their transcriptional programs.


Figures

Fig. 1.
Fig. 1.. BRG1 controls neurectoderm developmental transcription programs in hESCs.
(A) Western blot for BRG1 and actin protein levels in parental and BRG1KD cells ± Dox. (B) Mean RNA sequencing (RNA-seq) log2 fold change of BRG1KD DEGs ranked in descending order. Inset highlights select up-regulated neuroectodermal transcription factors. See also fig. S2. (C) Mean RNA-seq log2 fold change of BRG1KD differentially expressed enhancers ranked in descending order. (D) Gene set enrichment plot of basic processes enriched in up-regulated BRG1KD DEGs. (E) Gene set enrichment plot of basic processes enriched in down-regulated BRG1KD DEGs. In (D) and (E), GeneRatio represents the fraction of genes in each biological pathway that are present in the DEG list. “Activated” and “suppressed” panels designate whether the changes in expression of the DEGs are consistent with activation or suppression of the enriched biological pathway.
Fig. 2.
Fig. 2.. BRG1 depletion promotes formation of atypical NPC populations.
(A) Graphical depiction of experimental setup for (B) to (F). (B) Western blots showing BRG1, SOX2, tubulin, BAF60A, PAX6, and actin protein expression at collection time points. See also figs. S2 and S3. (C) Phase contrast images of control and BRG1KD NPCs. Scale bar, 100 μm. (D and E) Fluorescence-activated cell sorting (FACS) histogram of SOX2 (D) and PAX6 (E) protein detection at collection time points. Log10 fluorescent signal depicted for control cells in gray and BRG1KD cells in light blue. Data represents the total of all biological replicates (n ≥ 3). (F) Graphs depicting the percent of cells at each collection time point that were SOX2+/PAX6, SOX2+/PAX6+, or SOX2/PAX6. Bar height indicates mean percentages, and error bars represent SD of biological replicates (n ≥ 3). Control values are in gray, and BRG1KD values are in light blue.
Fig. 3.
Fig. 3.. scRNA-seq captures abnormal cell populations in BRG1KD NPCs.
(A and B) UMAP plots depicting clustering of NPCs by treatment (A) and day (B). WT, wild-type. (C and D) UMAP feature plots depicting SOX2 (C) and PAX6 (D) log-scaled expression. (E and F) Box-and-jitter plots and UMAP feature plots depicting log-scaled expression of neuroectodermal transcription factors (E) and cadherins (F) in control and BRG1KD at days 3, 6, and 9. Each dot represents a single cell, box edges represent the 25th and 75th percentiles, and midline represents the median.
Fig. 4.
Fig. 4.. Dorsalization of BRG1KD NPCs and precocious neural crest differentiation.
(A) UMAP plot depicting first-trimester fetal human brain–based cell type annotations. (B) Box-and-jitter plots and UMAP feature plots of log-scaled expression of dorsal neuroectodermal transcription factors at days 3, 6, and 9. Each dot represents a single cell, box edges represent the 25th and 75th percentiles, and midline represents the median. (C) Western blots for PAX3 and LHX5 at NPC collection time points. (D) UMAP plot showing de novo Seurat cluster assignments. See also figs. S4 and S5. (E) Heatmap of log-scaled expression of neural crest cell marker genes in randomly downsampled Seurat clusters (50 cells per cluster). (F) Zoomed-in UMAP plots highlighting cells in cluster 5 with more than one count of SOX10, MITF, and MPZ.
Fig. 5.
Fig. 5.. BRG1 is required during the initial stages of NPC specification.
(A) Western blot of BRG1 and β-tubulin protein levels over a time course of PROTAC treatment. (B) Graphical depiction of experimental setup for (C) and (D). See also fig. S6. (C) Percent of cells in each treatment that was detected as SOX2/PAX6 and NGFR+ by FACS at day 6. (D) RT-PCR for PAX3 and MSX1 at day 6. (E) Graphical depiction of experimental setup for (F) and (G). See also fig. S6. (F) Percent of cells in each treatment that was detected as SOX2/PAX6 and NGFR+ by FACS at day 9. (G) RT-PCR for PAX3 and MSX1 at day 9. (H) Graphical depiction of experimental setup for (I) and (J). See also fig. S6. (I) Percent of cells in each treatment that was detected as SOX2/PAX6 and NGFR+ by FACS at day 9. (J) RT-PCR for PAX3 and MSX1 at day 9. For (C), (F), and (I), bar heights indicate mean percentages, and error bars represent SD of biological replicates (n ≥ 3). For (D), (G), and (J), bars depict mean expression level relative to geometric mean of ACTB, GAPDH, and TUBA1B; error bars represent SD of biological triplicates.
Fig. 6.
Fig. 6.. BRG1 maintains chromatin accessibility and enhancer marks at neuroectoderm enhancers.
(A) Graphical depiction of ATAC-seq experimental setup. Cells were collected at day 0 (ESCs) and day 3 (NPCs). (B and C) Scatter plots comparing NFR counts between treatments over the total set of NFRs in hESCs (B) and NPCs (C). Colored dots and numbers represent NFRs with significantly more or less accessibility. (D) Integrative genomics viewer browser snapshot of ATAC-seq NFR coverage around the CDH8 gene. NFR peaks are annotated as blue lines above the gene model. Scale for all tracks is 0 to 44. (E) Number of NFRs called in each treatment/time point. Bars represent mean, and error bars represent SD of biological triplicates. (F) Violin plots of NFR distance from the closest annotated TSS for the total NFR set, NFRs that gain accessibility upon BRG1 depletion (gained) and NFRs that lose accessibility upon BRG1 depletion (lost). Red numbers represent the median distance for each NFR set. (G) Heatmap of log2 fold change (log2FC) relative to control hESCs of NFR coverage over the peaks depicted in (D). (H and I) Meta-profiles of NFR coverage over lost NFRs (H) and gained NFRs (I). (J and K) Dot plots of transcription factor motifs enriched in lost NFRs (J) and gained NFRs (K). (L and M) Meta-profiles of H3K27ac CUT&Tag coverage over lost NFRs (L) and gained NFRs (M).
Fig. 7.
Fig. 7.. BRG1 establishes the NPC chromatin landscape.
(A) Scatter plot comparing NFR counts between hESCs and NPCs over the total set of NFRs. Black dots and numbers represent NFRs with significantly more or less accessibility in NPCs versus hESCs. (B) Bar plots depicting the number of day 3 lost and day 3 gained NFRs in each hESC-NPC treatment pair. (C) Meta-profiles of hESC and NPC ATAC-seq NFR coverage over day 3 lost NFRs. (D) Meta-profiles of hESC and NPC H3K27ac CUT&Tag coverage over day 3 lost NFRs. (E) Meta-profiles of hESC and NPC BRG1 CUT&Tag coverage over day 3 lost NFRs. (F) Meta-profiles of hESC and NPC ATAC-seq NFR coverage over day 3 gained NFRs. (G) Meta-profiles of hESC and NPC H3K27ac CUT&Tag coverage over day 3 gained NFRs. (H) Meta-profiles of hESC and NPC BRG1 CUT&Tag coverage over day 3 gained NFRs.

Similar articles

Cited by

References

    1. Clapier C. R., Iwasa J., Cairns B. R., Peterson C. L., Mechanisms of action and regulation of ATP-dependent chromatin-remodelling complexes. Nat. Rev. Mol. Cell Biol. 18, 407–422 (2017). - PMC - PubMed
    1. Iurlaro M., Stadler M. B., Masoni F., Jagani Z., Galli G. G., Schübeler D., Mammalian SWI/SNF continuously restores local accessibility to chromatin. Nat. Genet. 53, 279–287 (2021). - PubMed
    1. Schick S., Grosche S., Kohl K. E., Drpic D., Jaeger M. G., Marella N. C., Imrichova H., Lin J. M. G., Hofstätter G., Schuster M., Rendeiro A. F., Koren A., Petronczki M., Bock C., Müller A. C., Winter G. E., Kubicek S., Acute BAF perturbation causes immediate changes in chromatin accessibility. Nat. Genet. 53, 269–278 (2021). - PMC - PubMed
    1. Alfert A., Moreno N., Kerl K., The BAF complex in development and disease. Epigenetics Chromatin 12, 19 (2019). - PMC - PubMed
    1. Kadoch C., Hargreaves D. C., Hodges C., Elias L., Ho L., Ranish J., Crabtree G. R., Proteomic and bioinformatic analysis of mammalian SWI/SNF complexes identifies extensive roles in human malignancy. Nat. Genet. 45, 592–601 (2013). - PMC - PubMed

Publication types