. 2024 Mar;10(9):eadk0820.
doi: 10.1126/sciadv.adk0820. Epub 2024 Mar 1.

Aberrant RNA sensing in regulatory T cells causes systemic autoimmunity

Affiliations

Aberrant RNA sensing in regulatory T cells causes systemic autoimmunity

Domnica Luca et al. Sci Adv. 2024 Mar.

Abstract

Chronic and aberrant nucleic acid sensing causes type I IFN-driven autoimmune diseases, designated type I interferonopathies. We found a significant reduction of regulatory T cells (Tregs) in patients with type I interferonopathies caused by mutations in ADAR1 or IFIH1 (encoding MDA5). We analyzed the underlying mechanisms using murine models and found that Treg-specific deletion of Adar1 caused peripheral Treg loss and scurfy-like lethal autoimmune disorders. Similarly, knock-in mice with Treg-specific expression of an MDA5 gain-of-function mutant caused apoptosis of peripheral Tregs and severe autoimmunity. Moreover, the impact of ADAR1 deficiency on Tregs is multifaceted, involving both MDA5 and PKR sensing. Together, our results highlight the dysregulation of Treg homeostasis by intrinsic aberrant RNA sensing as a potential determinant for type I interferonopathies.


Figures

Fig. 1.
Fig. 1.. Patients with AGS caused by ADAR1 or IFIH1 mutations have a decreased frequency of peripheral effector Tregs.
(A) Representative flow cytometry (FC) plots of CD25 and CD45RA expression on CD4+ T cells from controls or patients with AGS. Fr. I: CD25lowCD45RA+ suppressive resting Tregs, Fr. II: CD25hiCD45RA highly suppressive effector Tregs, and Fr. III: CD25lowCD45RA (FOXP3low) nonsuppressive T cells. (B) Summarized percentages of Fr. I, Fr. II, and Fr. III from all controls and patients with AGS analyzed in this study. (C to F) Representative histograms of CTLA-4 and PD-1 expression on Fr. I (solid line) and Fr. II (dotted line) and summarized mean fluorescence intensity (MFI) values from controls (black) and patients with AGS (yellow), relative to Fr. I in healthy controls (HC). The samples from patients with AGS have been analyzed one at a time (in two instances, two at a time), together with control samples from healthy donors. The dot plots shown here contain pooled data from respective analyses. Samples from patients 1 and 4 have been analyzed at four [three for CTLA-4 and PD-1 expression; (D) and (F) and fig. S1D] and two different time points (fig. S1A), and the mean is represented as one symbol in pooled-data dot plots (B, D, and F); otherwise, each symbol represents one individual. Statistics were calculated using Student’s t test with Welch’s correction (B) and one-way ANOVA (D and F); *P ≤ 0.05; **P ≤ 0.01; ****P ≤ 0.0001; ns, not significant, P > 0.05.
Fig. 2.
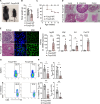
Fig. 2.. Adar1 deletion in Tregs causes Treg loss and a scurfy-like phenotype in mice.
(A and B) Pictures and body weight measurements of 3-week-old Foxp3-WT (n = 44) and Foxp3ΔAdar1 (n = 36) mice. (C) Survival graphs of Foxp3-WT and Foxp3ΔAdar1 mice (n = 7, but all Foxp3ΔAdar1 mice developed a severe phenotype and were sacrificed at latest 4 weeks after birth). (D) Representative H&E staining images. S. intestine, small intestine. Scale bars, 100 μm. (E to H) Representative FC plots and summarized percentages (%) of CD4+FOXP3+ Tregs in the spleens. (I and J) Representative FC plots and summarized percentages of naïve (CD44CD62L+), effector (CD44+CD62L), and memory (CD44+CD62L+) CD4+ T cells in the spleens. (K) ELISA heatmap of indicated cytokines measured in supernatants from enriched CD4+ T cells (pg/ml), stimulated overnight with anti-CD3/anti-CD28 antibody–coated beads. (L) Representative FC plots of FOXP3+ versus GATA3+CD4+ T cells after overnight culture (without stimulation). Panels (E) to (J) are representative of ≥3 independent experiments with ≥3 mice per group. Panels (K) and (L) are representative of two experiments with two mice per group. In dot plots, each symbol indicates an individual mouse. Statistics were calculated using Student’s t test; ****P ≤ 0.0001; ns, not significant, P > 0.05.
Fig. 3.
Fig. 3.. Constitutive MDA5 activation in Tregs causes Treg loss and autoimmunity in mice.
(A and B) Pictures and body weight measurements of 4-week-old Foxp3-WT (n = 12) and Foxp3-GS (n = 9) mice. (C) Survival graph of Foxp3-WT (n = 12) and Foxp3-GS (n = 14) mice. (D) Representative H&E staining images of indicated organs. Scale bars, 100 μm. (E) Representative H&E staining images of kidneys, immunofluorescence staining images of IgG (green) in the kidneys (4′,6-diamidino-2-phenylindole (DAPI), blue), and immunofluorescence staining of L929 cells using sera from Foxp3-WT and Foxp3-GS mice. (F) Relative mRNA expression of indicated genes. (G and H) Representative FC plots, summarized percentages (%), and total numbers (#) of CD4+YFP+(FOXP3+) Tregs in spleens and small intestines. Panels (F) to (H) are representative of ≥3 independent experiments with ≥3 mice per group. In dot plots, each symbol indicates an individual mouse. Statistics were calculated using Student’s t test; *P ≤ 0.05; **P ≤ 0.01; ****P ≤ 0.0001; ns, not significant, P > 0.05.
Fig. 4.
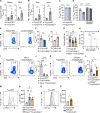
Fig. 4.. Adar1 deletion in Tregs activates both the MDA5/MAVS and PKR/eIF-2α pathways contributing to cell death.
(A) Annexin V+7AAD+ Treg percentages in the spleens and mesenteric lymph nodes (MLNs). (B) Relative mRNA expression of Noxa in sorted CD4+YFP+(FOXP3+) Tregs. (C and D) Percentages of CD4+FOXP3+ ex vivo induced Tregs (iTregs) at day 3 and their viability at day 5. iTregs were induced from Foxp3-WT (n = 3) or Foxp3ΔAdar1 (n = 5) naïve CD4+ T cells and treated or not with caspase inhibitor. (E and F) Representative FC plots and summarized percentages of CD4+FOXP3+ Tregs in the spleens of 30-week-old Cx3cr1ΔAdar1, 10-week-old Cx3cr1-GS, and respective Cx3cr1-WT control mice. (G) Body weight measurements of 3-week-old Foxp3-WT (n = 44), Foxp3ΔAdar1 (n = 36), and Mavs−/−Foxp3ΔAdar1 (n = 20) mice. (H) Survival graphs of Foxp3-WT (gray), Foxp3ΔAdar1 (blue, n = 7), and Mavs−/−Foxp3ΔAdar1 mice (orange, n = 5). (All Foxp3ΔAdar1 and Mavs−/−Foxp3ΔAdar1 mice to date developed a severe phenotype and were sacrificed at latest 4 or 8 weeks old, respectively.) (I to L) Representative FC plots and summarized percentages of CD4+FOXP3+ Tregs in the spleens. (M to P) Representative histograms and plots of phospho–eIF-2α mean fluorescence intensity in CD4+FOXP3+ Tregs from spleens. Panels (A), (B), (I), (J), (M), and (N) are representative of ≥3 independent experiments with ≥3 mice per group; panels (C) to (F) are representative of two independent experiments with ≥2 mice per group. In dot plots, each symbol indicates an individual mouse. Statistics were calculated using Student’s t test or one-way ANOVA; *P ≤ 0.05; **P ≤ 0.01; ***P ≤ 0.001; ****P ≤ 0.0001; ns, not significant, P > 0.05.

References

    1. Crow Y. J., Stetson D. B., The type I interferonopathies: 10 years on. Nat. Rev. Immunol. 22, 471–483 (2022). - PMC - PubMed
    1. Lee-Kirsch M. A., The type I interferonopathies. Annu. Rev. Med. 68, 297–315 (2017). - PubMed
    1. Crow Y. J., Hayward B. E., Parmar R., Robins P., Leitch A., Ali M., Black D. N., van Bokhoven H., Brunner H. G., Hamel B. C., Corry P. C., Cowan F. M., Frints S. G., Klepper J., Livingston J. H., Lynch S. A., Massey R. F., Meritet J. F., Michaud J. L., Ponsot G., Voit T., Lebon P., Bonthron D. T., Jackson A. P., Barnes D. E., Lindahl T., Mutations in the gene encoding the 3′-5′ DNA exonuclease TREX1 cause Aicardi-Goutières syndrome at the AGS1 locus. Nat. Genet. 38, 917–920 (2006). - PubMed
    1. Rice G. I., Bond J., Asipu A., Brunette R. L., Manfield I. W., Carr I. M., Fuller J. C., Jackson R. M., Lamb T., Briggs T. A., Ali M., Gornall H., Couthard L. R., Aeby A., Attard-Montalto S. P., Bertini E., Bodemer C., Brockmann K., Brueton L. A., Corry P. C., Desguerre I., Fazzi E., Cazorla A. G., Gener B., Hamel B. C. J., Heiberg A., Hunter M., van der Knaap M. S., Kumar R., Lagae L., Landrieu P. G., Lourenco C. M., Marom D., McDermott M. F., van der Merwe W., Orcesi S., Prendiville J. S., Rasmussen M., Shalev S. A., Soler D. M., Shinawi M., Spiegel R., Tan T. Y., Vanderver A., Wakeling E. L., Wassmer E., Whittaker E., Lebon P., Stetson D. B., Bonthron D. T., Crow Y. J., Mutations involved in Aicardi-Goutières syndrome implicate SAMHD1 as regulator of the innate immune response. Nat. Genet. 41, 829–832 (2009). - PMC - PubMed
    1. Crow Y. J., Leitch A., Hayward B. E., Garner A., Parmar R., Griffith E., Ali M., Semple C., Aicardi J., Babul-Hirji R., Baumann C., Baxter P., Bertini E., Chandler K. E., Chitayat D., Cau D., Déry C., Fazzi E., Goizet C., King M. D., Klepper J., Lacombe D., Lanzi G., Lyall H., Martínez-Frías M. L., Mathieu M., McKeown C., Monier A., Oade Y., Quarrell O. W., Rittey C. D., Rogers R. C., Sanchis A., Stephenson J. B. P., Tacke U., Till M., Tolmie J. L., Tomlin P., Voit T., Weschke B., Woods C. G., Lebon P., Bonthron D. T., Ponting C. P., Jackson A. P., Mutations in genes encoding ribonuclease H2 subunits cause Aicardi-Goutières syndrome and mimic congenital viral brain infection. Nat. Genet. 38, 910–916 (2006). - PubMed

Publication types