. 2024 Mar;10(9):eadk8123.
doi: 10.1126/sciadv.adk8123. Epub 2024 Mar 1.

Early IGF-1 receptor inhibition in mice mimics preterm human brain disorders and reveals a therapeutic target

Affiliations

Early IGF-1 receptor inhibition in mice mimics preterm human brain disorders and reveals a therapeutic target

Alberto Potenzieri et al. Sci Adv. 2024 Mar.

Abstract

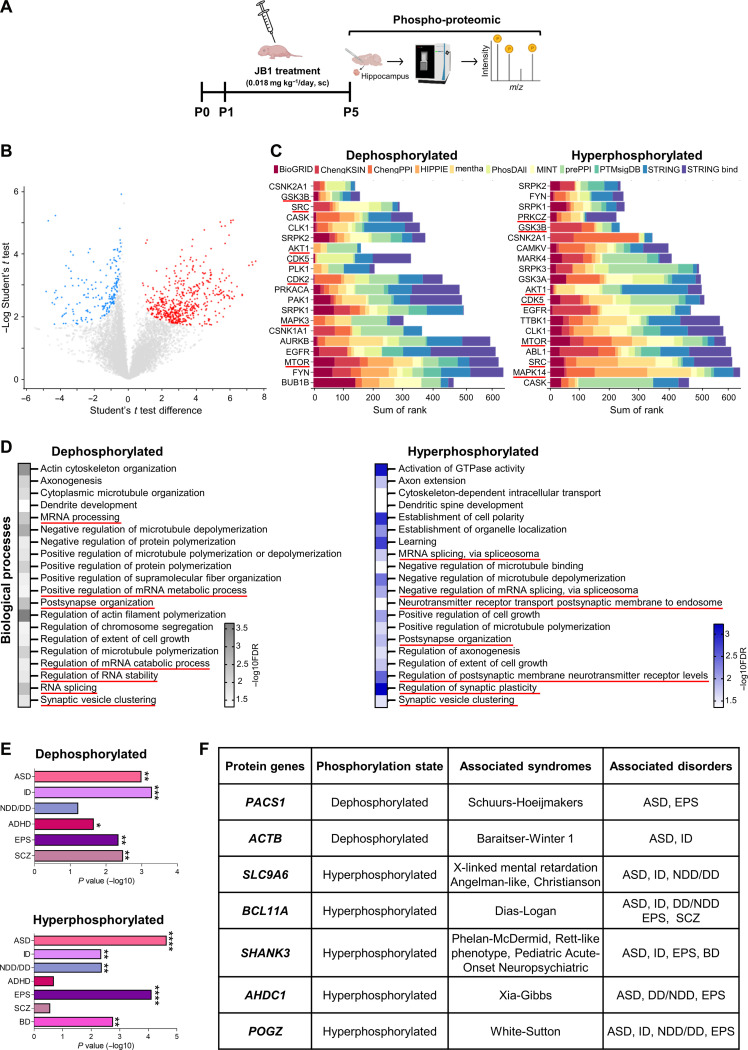
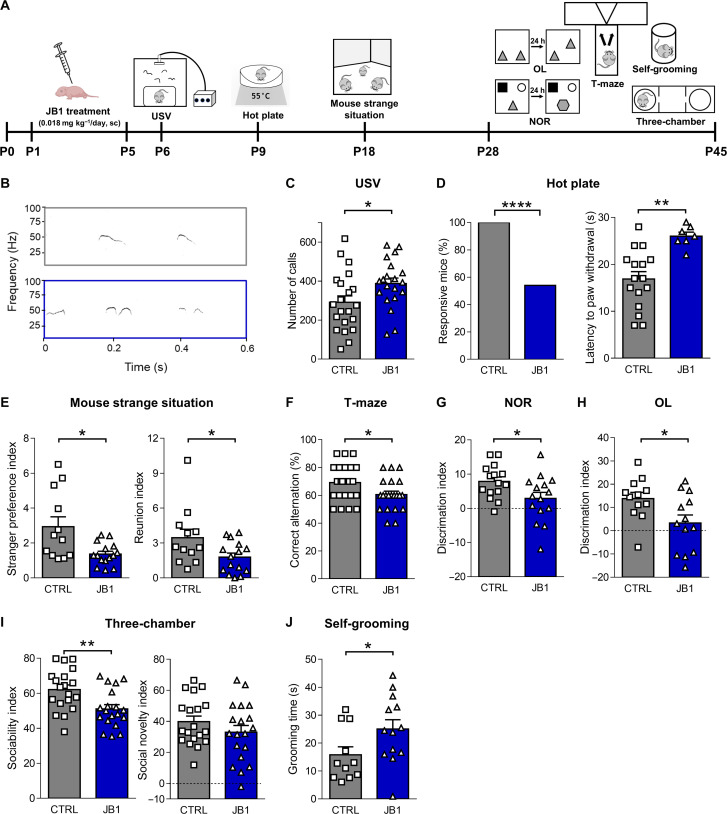
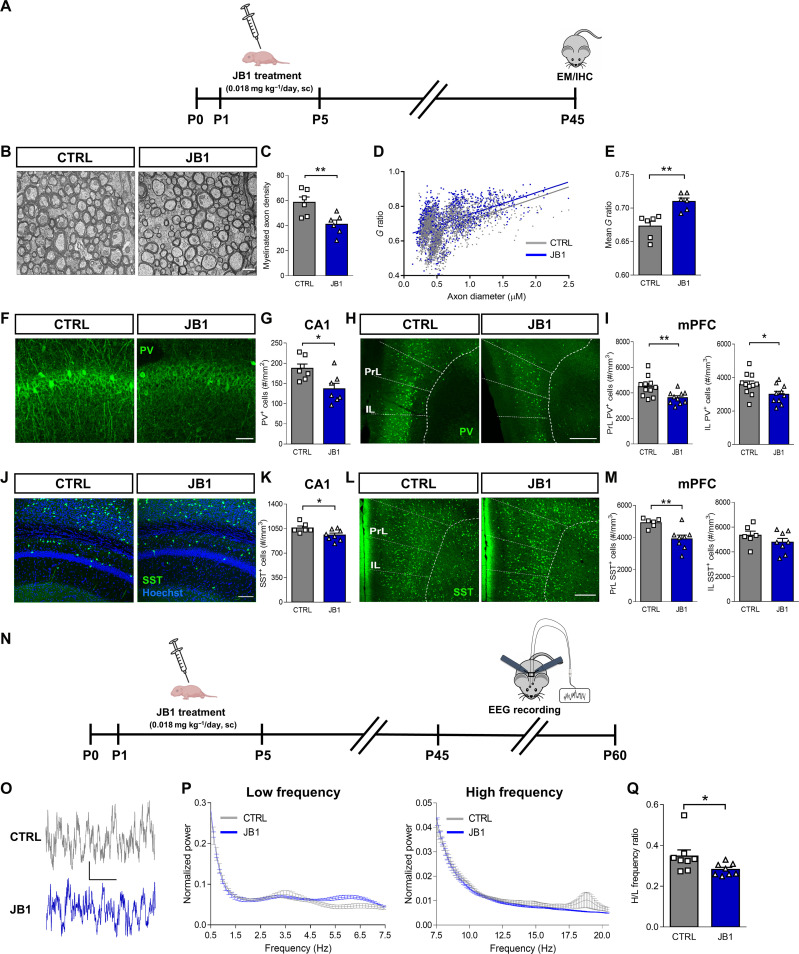
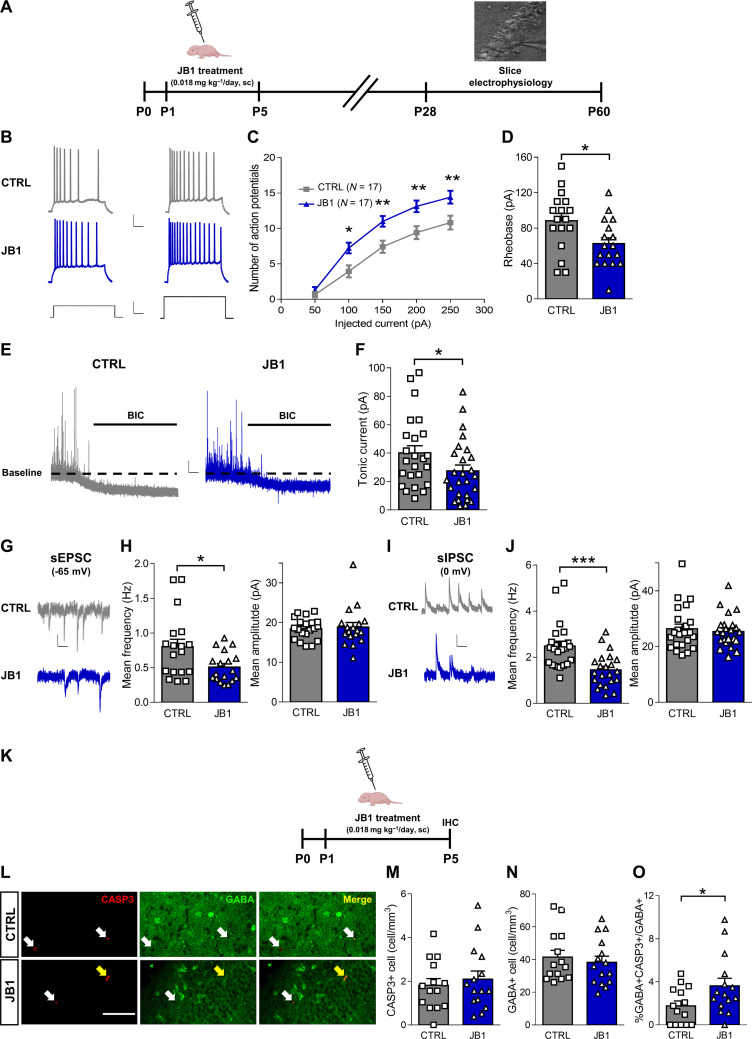
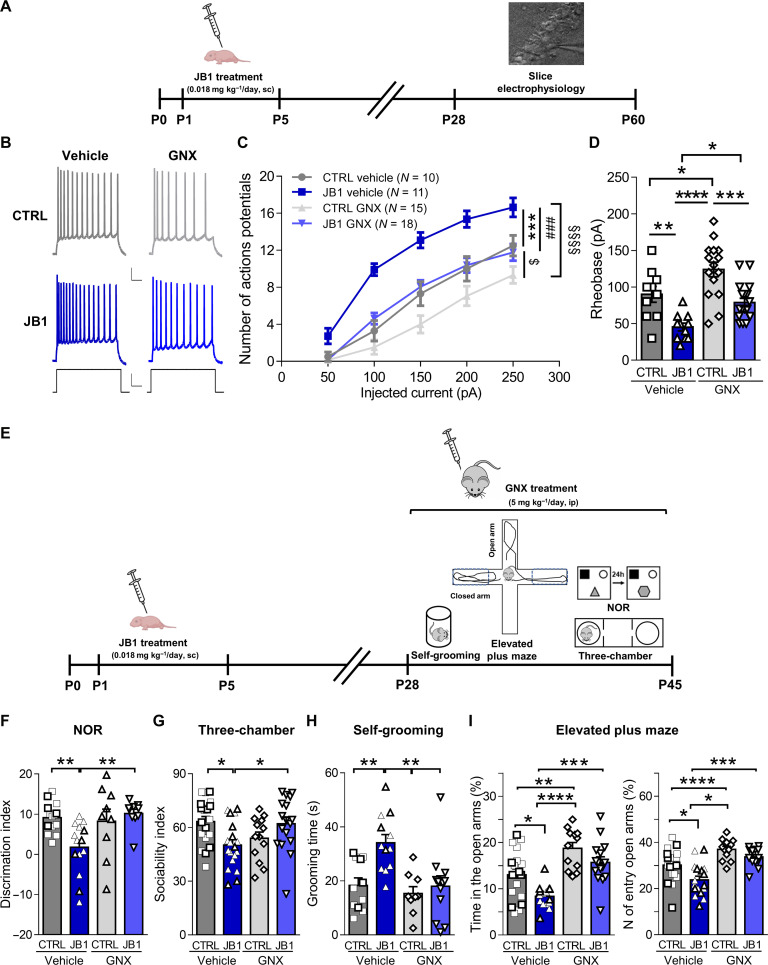
Besides recent advances in neonatal care, preterm newborns still develop sex-biased behavioral alterations. Preterms fail to receive placental insulin-like growth factor-1 (IGF-1), a major fetal growth hormone in utero, and low IGF-1 serum levels correlate with preterm poor neurodevelopmental outcomes. Here, we mimicked IGF-1 deficiency of preterm newborns in mice by perinatal administration of an IGF-1 receptor antagonist. This resulted in sex-biased brain microstructural, functional, and behavioral alterations, resembling those of ex-preterm children, which we characterized performing parallel mouse/human behavioral tests. Pharmacological enhancement of GABAergic tonic inhibition by the U.S. Food and Drug Administration-approved drug ganaxolone rescued functional/behavioral alterations in mice. Establishing an unprecedented mouse model of prematurity, our work dissects the mechanisms at the core of abnormal behaviors and identifies a readily translatable therapeutic strategy for preterm brain disorders.


Figures

Fig. 1.
Fig. 1.. Systemic IGF-1R inhibition in mouse pups leads to acute phospho-proteomic changes associated with neuropsychiatric disorders.
(A) Experimental protocol with pharmacological treatment and timing of the phospho-proteomic experiment utilizing mass spectrometry. (B) Volcano plot showing the phosphorylated/dephosphorylated phosphorylation sites differentially expressed between JB1-treated (N = 10 animals) and control (vehicle-treated; N = 8 animals) pup littermates euthanized 1 hour after the last treatment at P5. Blue and red dots represent significantly dephosphorylated and hyperphosphorylated phosphorylation sites, respectively. s0 = 0.1 and FDR = 0.05. (C) Kinase Enrichment Analysis of significantly dephosphorylated (left) and hyperphosphorylated (right) phospho-proteins, corresponding to differentially expressed phosphorylation sites shown in (B). Bars represent the mean rank of the top 20 phospho-proteins based on multiple library databases (color-coded above). The kinases related to IGF-1 signaling are underlined in red. (D) Gene Ontology (GO) analysis for the differentially dephosphorylated (left) or hyperphosphorylated (right) significantly expressed proteins corresponding to differentially expressed phosphorylation sites shown in (B). The color bar on the right indicates −log10FDR for the statistically significant (FDR < 0.05) top 20 (hierarchy for fold enrichment) enriched biological processes. The terms related to synapses or RNA processes are underlined in red. (E) Enrichment for neuropsychiatric disorder risk genes (identified with SFARI gene archive) in the dephosphorylated (top) and hyperphosphorylated (bottom) protein datasets shown in (B). Hypergeometric test, *P < 0.05, **P < 0.01, ***P < 0.001, ****P < 0.0001. (F) Table showing high confidence, syndromic neuropsychiatric disease genes (category 1S of the SFARI gene archive) present in significantly dephosphorylated and hyperphosprylated proteins in (B). ADHD, attention-deficit/hyperactivity disorder; ASD, autism spectrum disorder; BD, bipolar disorder; EPS, epilepsy; ID, intellectual disability; NDD/DD, neurodevelopmental disorder/developmental disorder; SCZ, schizophrenia. Schematic cartoons by BioRender.com.
Fig. 2.
Fig. 2.. Early postnatal IGF-1R inhibition leads to behavioral alterations.
(A) Experimental protocol. (B) Example of a fraction of the recordings of ultrasonic vocalizations (USVs) emitted by P6 pups. (C) Quantification of the mean ± SEM (bars) and single animal cases (symbols) of the number of USV calls in the experiments as in (B). Two-tailed Student’s t test, t = 2.221, *P < 0.05. (D) Quantification of the mean ± SEM and single animal cases of the number of P9 responsive pups and their latency to first paw withdrawal after placement on a hot plate. Left, Fisher’s exact test, ****P < 0.0001. Right, two-tailed Student’s t test, t = 3.713, **P < 0.01. (E) Quantification of the mean ± SEM and single animal cases of the stranger preference index and reunion index during the mouse strange situation test. Mann-Whitney test, U = 41.0 (left), U = 48.0 (right) *P < 0.05. (F) Quantification of the mean ± SEM and single animal cases of the correct alternations. Two-tailed Student’s t test, t = 2.309, *P < 0.05. (G) Quantification of the mean ± SEM and single animal cases of the discrimination index. Two-tailed Student’s t test, t = 2.285, *P < 0.05. (H) Quantification of the mean ± SEM and single animal cases of the discrimination index. Two-tailed Student’s t test, t = 2.398, *P < 0.05. (I) Quantification of the mean ± SEM and single animal cases of the sociability index and social novelty index. Left, two-tailed Student’s t test, t = 3.006, **P < 0.01. (J) Quantification of the mean ± SEM and single animal cases of the grooming time. Mann-Whitney test, U = 36.0, *P < 0.05. For all experiments, the analyzed animals for each experimental group were derived from three to eight independent litters. Schematic cartoons by BioRender.com.
Fig. 3.
Fig. 3.. Early postnatal IGF-1R inhibition leads to brain anatomical microstructural and functional changes.
(A) Experimental protocol. (B) Corpus-callosum TEM images from P45 mice. Scale bar, 1 μm. (C) Average myelinated-axon density in the view field. Two-tailed Student’s t test, t = 3.210, **P < 0.01. (D) Scatte plot of the G ratio versus axon diameter. Fitted lines: linear regressions, R2: CTRL = 0.2080, JB1 = 0.2409. (E) Average G ratio for each animal. Two-tailed Student’s t test, t = 4.121, **P < 0.01. Three independent experiments. (F) Images of PV fluorescence in CA1-hippocampal slices from P45 mice. Scale bar, 60 μm. (G) Average density of PV interneurons in brain slices. (two to three slices per animal, four litters). Two-tailed Student’s t test, t = 2.918, *P < 0.05. (H) Images of PV fluorescence in mPFC slices, with indicated subregions (PrL, prelimbic; IL, infralimbic; white dotted lines) from P45 mice. Scale bar, 100 μm. (I) Average density of PV interneurons in brain slices (two to three slices per animal, five litters). Two-tailed Student’s t test; left, t = 3.027, **P < 0.01; right, t = 2.243, *P < 0.05. (J) Images of SST and Hoechst fluorescence in CA1-hippocampal slices from P45 mice. Scale bar, 60 μm. (K) Average density of SST interneurons in brain slices (two to three slices per animal, three litters). Two-tailed Student’s t test, t = 2.499, *P < 0.05. (L) Images of SST fluorescence in mPFC slices, with indicated subregions, from P45 mice. Scale bar, 60 μm. (M) Average density of SST interneurons in brain slices (two to three slices per animal, three litters). Left, two-tailed Student’s t test, t = 3.465, **P < 0.01. (N) Experimental protocol. (O) EEG traces from P>45 mice. Scale bars, 0.1 mV, 5000 ms. (P) Average normalized EEG power spectra ± SEM for low and high frequencies of mice recorded at P45–60 (N = 8 JB1, N = 8 CTRL). (Q) High-/low-frequency (H/L) ratio. Five litters. Mann-Whitney test, U = 10.00, *P < 0.05. For (C), (E), (G), (I), (K), (M), and (Q), bars represent the average ± SEM, and symbols represent single data points for each animal. Schematic cartoons by BioRender.com.
Fig. 4.
Fig. 4.. Early postnatal IGF-1R inhibition leads to increased intrinsic excitability, decreased synaptic transmission, reduced GABAergic-tonic inhibition in CA1 pyramidal neurons, and increased apoptosis of GABAergic interneurons.
(A) Experimental protocol. (B) Current-clamp traces of membrane potential changes (top) in response to depolarizing current-steps (150 pA left, 250 pA right; bottom) in CA1-hippocampal pyramidal neurons (P>40 mice). Scale bars, traces: 20 mV, 100 ms; stimuli: 150 pA, 100 ms. (C) Average action-potential numbers (±SEM) elicited by current steps. In parentheses: number of recorded cells (eight CTRL–nine JB1 littermates, five litters). Two-way ANOVA RM, Ftreatment(1,32) = 9.590, P < 0.01, Sidak post hoc test, *P < 0.05, **P < 0.01. (D) Average Rheobase of recorded cells (eight CTRL–nine JB1 littermates, five litters). Two-tailed Student’s t test, t = 2.466, *P < 0.05. (E) Voltage-clamp traces of bicuculline-induced (bar) tonic currents in CA1-hippocampal pyramidal neurons (P>35 mice). Scale bars, 15 pA, 500 ms. (F) Amplitude averages of tonic currents for recorded cells (11 CTRL–11 JB1 littermates, four litters). Mann-Whitney test, U = 210.0, *P < 0.05. (G) Voltage-clamp traces of sEPSCs (−65 mV) in CA1-hippocampal pyramidal neurons (P>40 mice). Scale bars, 10 pA, 250 ms. (H) sEPSC frequency and amplitude averages of recorded cells (nine CTRL–eight JB1 littermates, four litters). Left, Mann-Whitney test, U = 98.0, *P < 0.05. (I) Voltage-clamp traces of sIPSCs (0 mV) in CA1-hippocampal pyramidal neurons (P>35 mice). Scale bar, 10 pA, 250 ms. (J) sIPSC frequency and amplitude averages for recorded neurons (12 CTRL–11 JB1 littermates, four litters). Left, Mann-Whitney test, U = 96.00, ***P < 0.001. (K) Experimental protocol. (L) Caspase-3 (CASP3) and GABA fluorescence in CA1-hippocampal slices from P5 littermates. Scale bar, 60 μm. White arrows: CASP3+ cells. Yellow arrows: CASP3+/GABA+ cells. (M) Average density of CASP3+ cells (two to three slices per animal, four litters). (N) Average density of GABA+ cells (two to three slices per animal, four litters). (O) Average density of CASP3+/GABA+ cells normalized on total GABA+ cells (two to three slices per animal, four litters). Two-tailed Student’s t test, t = 2.150, *P < 0.05. For (D), (F), (H), (J), (M), (N), and (O), bars represent average ± SEM, and symbols represent data for each recorded cell/animal. Schematic cartoons by BioRender.com.
Fig. 5.
Fig. 5.. PAM of extrasynaptic GABAARs rescues pyramidal neuron excitability and behavioral alterations in adolescent JB1 mice.
(A) Experimental protocol. (B) Current-clamp recordings of membrane potential changes in response to a 250-pA depolarizing current step in CA1-hippocampal pyramidal neurons in the presence of ganaxolone (GNX, 1 μm) or vehicle (DMSO) in the recording solution in brain slices from P>35 male mice. Scale bars, traces: 20 mV, 100 ms; stimuli: 150 pA, 100 ms. (C) Average action potential numbers (±SEM) elicited by depolarizing current steps. In parentheses: number of recorded cells from five CTRL and seven JB1 littermates (five litters). Two-way ANOVA RM, Ftreatment(3,50) = 16.10, P < 0.0001, Tukey’s post hoc test. CTRL-vehicle versus JB1-vehicle: ***P < 0.001; JB1-vehicle versus JB1-GNX: ###P < 0.001; CTRL-GNX versus JB1-vehicle: §§§§P < 0.0001; CTRL-GNX versus JB1-GNX: $P < 0.05. (D) Average Rheobase of all recorded cells from five CTRL and seven JB1-treated mice (five litters). Two-way ANOVA, Ftreatment(1,52) = 17.82, P < 0.0001, Tukey’s post hoc test, *P < 0.05, **P < 0.01, ***P < 0.001, ****P < 0.0001. (E) Experimental protocol. (F to I) Mean ± SEM and single-animal cases of the discrimination and sociability indexes in the NOR and three-chamber tests, the self-grooming time, the percentage of time spent in the open arms, and the percentage number of entries in the EPM in male mice previously treated with JB1 or vehicle (CTRL) as pups and treated as adolescents with ganaxolone (GNX) or vehicle. For all the panels, two-way ANOVA, Tukey’s post hoc test, *P < 0.05, **P < 0.01 ***P < 0.001, ****P < 0.0001. NOR: Finteraction(1,43) = 7.059, P < 0.05. Three-chamber: Finteraction(1,63) = 10.30, P < 0.01. Self-grooming: Finteraction(1,40) = 8,774, P < 0.01. EPM: time, Ftreatment(1,56) = 31.72, P < 0.0001; entries, Ftreatment(1,57) = 28.97, P < 0.0001. Single data points with thinner borders represent data from the experiment in fig. S7C (F), fig. S7E (G), fig. S7G (H), and fig. S8, B and C (I). Schematic cartoons by BioRender.com.

Similar articles

Cited by

References

    1. Volpe J. J., Brain injury in premature infants: A complex amalgam of destructive and developmental disturbances. Lancet Neurol. 8, 110–124 (2009). - PMC - PubMed
    1. Fernandez-Baizan C., Alcantara-Canabal L., Solis G., Mendez M., The association between perinatal and neonatal variables and neuropsychological development in very and extremely low-birth-weight preterm children at the beginning of primary school. Appl. Neuropsychol. Child 10, 348–358 (2021). - PubMed
    1. Penn A. A., Gressens P., Fleiss B., Back S. A., Gallo V., Controversies in preterm brain injury. Neurobiol. Dis. 92, 90–101 (2016). - PMC - PubMed
    1. Johnson S., Hollis C., Kochhar P., Hennessy E., Wolke D., Marlow N., Psychiatric disorders in extremely preterm children: Longitudinal finding at age 11 years in the EPICure study. J. Am. Acad. Child Adolesc. Psychiatry 49, 453–463.e1 (2010). - PubMed
    1. Leviton A., Fichorova R. N., O’Shea T. M., Kuban K., Paneth N., Dammann O., Allred E. N., Two-hit model of brain damage in the very preterm newborn: Small for gestational age and postnatal systemic inflammation. Pediatr. Res. 73, 362–370 (2013). - PMC - PubMed

Publication types

Substances