. 2024 May:246:105755.
doi: 10.1016/j.cognition.2024.105755. Epub 2024 Feb 29.

A predictive coding model of the N400

Affiliations

A predictive coding model of the N400

Samer Nour Eddine et al. Cognition. 2024 May.

Abstract

The N400 event-related component has been widely used to investigate the neural mechanisms underlying real-time language comprehension. However, despite decades of research, there is still no unifying theory that can explain both its temporal dynamics and functional properties. In this work, we show that predictive coding - a biologically plausible algorithm for approximating Bayesian inference - offers a promising framework for characterizing the N400. Using an implemented predictive coding computational model, we demonstrate how the N400 can be formalized as the lexico-semantic prediction error produced as the brain infers meaning from the linguistic form of incoming words. We show that the magnitude of lexico-semantic prediction error mirrors the functional sensitivity of the N400 to various lexical variables, priming, contextual effects, as well as their higher-order interactions. We further show that the dynamics of the predictive coding algorithm provides a natural explanation for the temporal dynamics of the N400, and a biologically plausible link to neural activity. Together, these findings directly situate the N400 within the broader context of predictive coding research. More generally, they raise the possibility that the brain may use the same computational mechanism for inference across linguistic and non-linguistic domains.

Keywords: Bayesian inference; Language comprehension; Orthographic; Prediction; Prediction error; Semantic.


Conflict of interest statement

Declaration of competing interest The authors declare no conflict of interest.

Figures
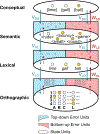
Figure 1 –
Figure 1 –. Predictive coding model architecture.
State units at three levels of linguistic representation (Orthographic, Lexical and Semantic) and at the highest conceptual layer are depicted as small circles within the large ovals. Error units at each of the three levels of linguistic representation are depicted as small circles within the half arcs. Dotted arrows indicate one-to-one connections between error and state units at the same level of representation. Solid arrows indicate many-to-many connections between error and state units across levels of representation. These many-to-many connections were specified using hand-coded weight matrices: W (feedforward) and V (feedback). VLO/WOL: Connections between the lexical and orthographic level; VSL/WLS: Connections between the semantic and lexical level; VDS/WSD: Connections between conceptual and semantic level. We schematically depict the activity pattern of the model’s state units after it has settled on the representation of the item, ball. Different shades of yellow are used to indicate each state unit’s strength of activity. At the Orthographic level, four state units are activated: B in the first position, A in the second position, and L in the final two positions. At the Lexical level, the unit corresponding to ball is mostly strongly activated, and its orthographic neighbor gall is partly activated because it shares three letters with ball. At the Semantic level, the units corresponding to the semantic features of ball (<bouncy>, etc.) are shown with different levels of activation. At the highest Conceptual layer, the unit corresponding to the representation of ball is most strongly activated. Because the model has settled, activity within error units at all levels is minimal.
Figure 2 –
Figure 2 –. Schematic illustration of the generative feedback connections for two words in the model’s lexicon.
Each circle indicates a representational node, and the blue arrows indicate feedback connections between layers. Note that, for simplification, this diagram does not distinguish between state and error units. In the model itself, however, the feedback connections linked higher-level state units with lower-level error units, see Figure 1. To specify the frequency of each lexical item, we modified the connection strengths of its unique set of feedback connections. This is depicted schematically using arrow thickness. For example, the arrows are thicker for ball than gall because ball is more frequent. Although each lexical item has its own unique set of connections, these connections can terminate on shared nodes. For example, the lexical-orthographic feedback connections for ball and gall both terminate on the same A2, L3, and L4 nodes, and the semantic-lexical feedback connections for the semantic features, <round>, <game>, <small> and <bouncy>, all terminate on the same lexical node, ball. In the model itself, this resulted in each lexical item having a particular “orthographic neighborhood size” and a particular “semantic richness”. For example, ball and gall are orthographic neighbors, and the semantic richness of the word ball is greater than gall because the former lexical item is connected to more semantic features (4 vs. 2). For the purpose of our simulations, we defined each lexical item’s orthographic neighborhood size as the number of lexical units with which it shared 3 letters. We defined “semantically rich” items as those that were connected to 18 features, and “non-rich” items as those that were connected to 9 features.
Figure 3 -
Figure 3 -. Predictive coding algorithm.
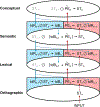
Schematic illustration of the predictive coding algorithm operating on the nthnth iteration, following the presentation of bottom-up orthographic input. As in Figure 1, at each layer, the large ovals contain state units, the red half-arcs contain bottom-up error units, and the blue half-arcs contain top-down error units. Each variable’s subscript indicates the iteration on which it was computed. Solid arrows indicate the linear transformation of a variable through the V and W matrices. Dotted arrows indicate the copying of a variable. The same three steps occur in sequence at each level of representation: (1) State units are updated, based on (a) the top-down bias computed at the same level on the previous iteration, and (b) the prediction error computed at the level below on the same iteration STnSTn-1tdBn-1+1L, and their values are copied to the top-down and bottom-up error units at the same level. (2) Bottom-up error units compute prediction error (PEn) through elementwise division (STntdRn) and pass this prediction error up to state units at the level above by transforming its dimensionality Ln=WPEn, and top-down error units compute top-down bias tdBn and copy this top-down bias to state units at the same level so that it is ready to update the state units on the subsequent [n+1]th iteration); (3) State units generate top-down reconstructions of activity at the level below via linear transformation by the V (generative) matrix, i.e., VST=tdR, and pass these reconstructions down to the error units at the level below.
Figure 4 –
Figure 4 –. Effects of lexical variables on the time course of lexico-semantic prediction error.
In this and subsequent figures, in each plot, the x-axis shows the number of iterations after stimulus onset, and the y-axis shows the total lexico-semantic prediction error (PE) (arbitrary units), averaged across items within each condition. Because the standard errors are very small and thus barely visible, we opted not to include them in the plots. A. High vs. Low Orthographic Neighborhood size (ONsize), based on a median split across 512 critical words. High ONsize words elicited a significantly larger lexico-semantic prediction error than Low ONsize words. B. High vs. Low ONsize, based on a median split across 400 pseudoword items. High ONsize pseudowords elicited a significantly larger lexico-semantic prediction error than Low ONsize pseudowords. C. High vs. Low Frequency, based on a median split across 512 critical words. Low frequency items elicited a significantly larger lexico-semantic prediction error than high frequency items. D. Rich vs. Non-rich (lexical items connected to 18 vs. 9 semantic features). Rich items elicited a significantly larger lexico-semantic prediction error than Non-rich items.
Figure 5 –
Figure 5 –. Effects of word-pair priming on the time course of lexico-semantic prediction error.
A. Effect of repetition priming. B. Effect of semantic priming: Unrelated (zero semantic features shared between prime and target) vs. Related (eight semantic features shared between prime and target).
Figure 6 –
Figure 6 –. Effects of Lexical Probability and Constraint on the time course of lexico-semantic prediction error.
A. Effect of lexical probability: Lexico-semantic prediction error decreased with increasing lexical probability. B. Effect of Constraint. Lexico-semantic prediction error was equally large to high constraint unexpected (HighConstr. Unexp.) and low constraint unexpected (Low Constr. Unexp.) inputs, relative to the expected inputs (High Constr. Exp).
Figure 7 –
Figure 7 –. Effects of anticipatory semantic overlap on the time course of lexico-semantic prediction error.
A. In the high constraint condition (in which the model was pre-activated with 99% probability), lexico-semantic prediction error was largest to the unexpected unrelated words (Unexp. Unrelated), smaller to the unexpected semantically overlapping words (Unexp. Overlap) and smallest to the expected words. B. In the medium constraint condition (in which the model was pre-activated with 50% probability), lexico-semantic prediction error also decreased across the three conditions. However, as indicated using arrows/shading, in this medium constraint condition, the difference in prediction error produced by the unexpected unrelated and the unexpected semantically overlapping words was smaller than this difference in the high constraint condition.
Figure 8 –
Figure 8 –. Effect of anticipatory orthographic overlap on the time course of lexico-semantic prediction error.
A. Effect of anticipatory orthographic overlap on words. Lexico-semantic prediction error was largest to the Unexpected unrelated words (CLAW, Unrel. Word), smaller to the unexpected orthographically overlapping words (DISH, Overlap. Word) and smallest to expected words (WISH, Exp. Word). B. Effect of anticipatory orthographic overlap on pseudowords. Lexico-semantic prediction error was largest to the Unexpected unrelated pseudowords (*CLAF, Unrel. Pseudo.), smaller to the unexpected orthographically overlapping pseudowords (*WUSH, Overlap Pseudo.) and smallest to expected words (WISH, Exp. Word).
Figure 9 –
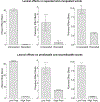
Figure 9 –. Interaction between lexical variables and repetition priming (top row), and lexical probability (bottom row).
In all bar charts, the y-axis shows the average estimate of the slope (i.e., the beta value) obtained by regressing ONsize, Frequency and Richness on the lexico-semantic prediction error. Error bars indicate ±1 standard error of the mean. The effects of all three lexical variables on the magnitude of lexico-semantic prediction error were reduced in the repeated (vs. non-repeated) conditions, and in the high (vs. low) probability conditions. The full time courses of all effects on the simulated N400 are shown in Supplementary Materials Figure 4.

Similar articles

Cited by

References

    1. Aitchison L, & Lengyel M (2017). With or without you: predictive coding and Bayesian inference in the brain. Current Opinion in Neurobiology, 46, 219–227. doi: 10.1016/j.conb.2017.08.010 - DOI - PMC - PubMed
    1. Amsel BD (2011). Tracking real-time neural activation of conceptual knowledge using single-trial event-related potentials. Neuropsychologia, 49(5), 970–983. doi: 10.1016/j.neuropsychologia.2011.01.003 - DOI - PubMed
    1. Baggio G, & Hagoort P (2011). The balance between memory and unification in semantics: A dynamic account of the N400. Language and Cognitive Processes, 26(9), 1338–1367. doi: 10.1080/01690965.2010.542671 - DOI
    1. Barr DJ, Levy R, Scheepers C, & Tily HJ (2013). Random effects structure for confirmatory hypothesis testing: Keep it maximal. Journal of Memory and Language, 68(3), 255–278. doi: 10.1016/j.jml.2012.11.001 - DOI - PMC - PubMed
    1. Bastos AM, Usrey WM, Adams RA, Mangun GR, Fries P, & Friston KJ (2012). Canonical microcircuits for predictive coding. Neuron, 76(4), 695–711. doi: 10.1016/j.neuron.2012.10.038 - DOI - PMC - PubMed

Publication types

LinkOut - more resources