

Pregnane X receptor knockout mitigates weight gain and hepatic metabolic dysregulation in female C57BL/6 J mice on a long-term high-fat diet
- PMID: 38428309
- PMCID: PMC10983615
- DOI: 10.1016/j.biopha.2024.116341
Pregnane X receptor knockout mitigates weight gain and hepatic metabolic dysregulation in female C57BL/6 J mice on a long-term high-fat diet
Abstract
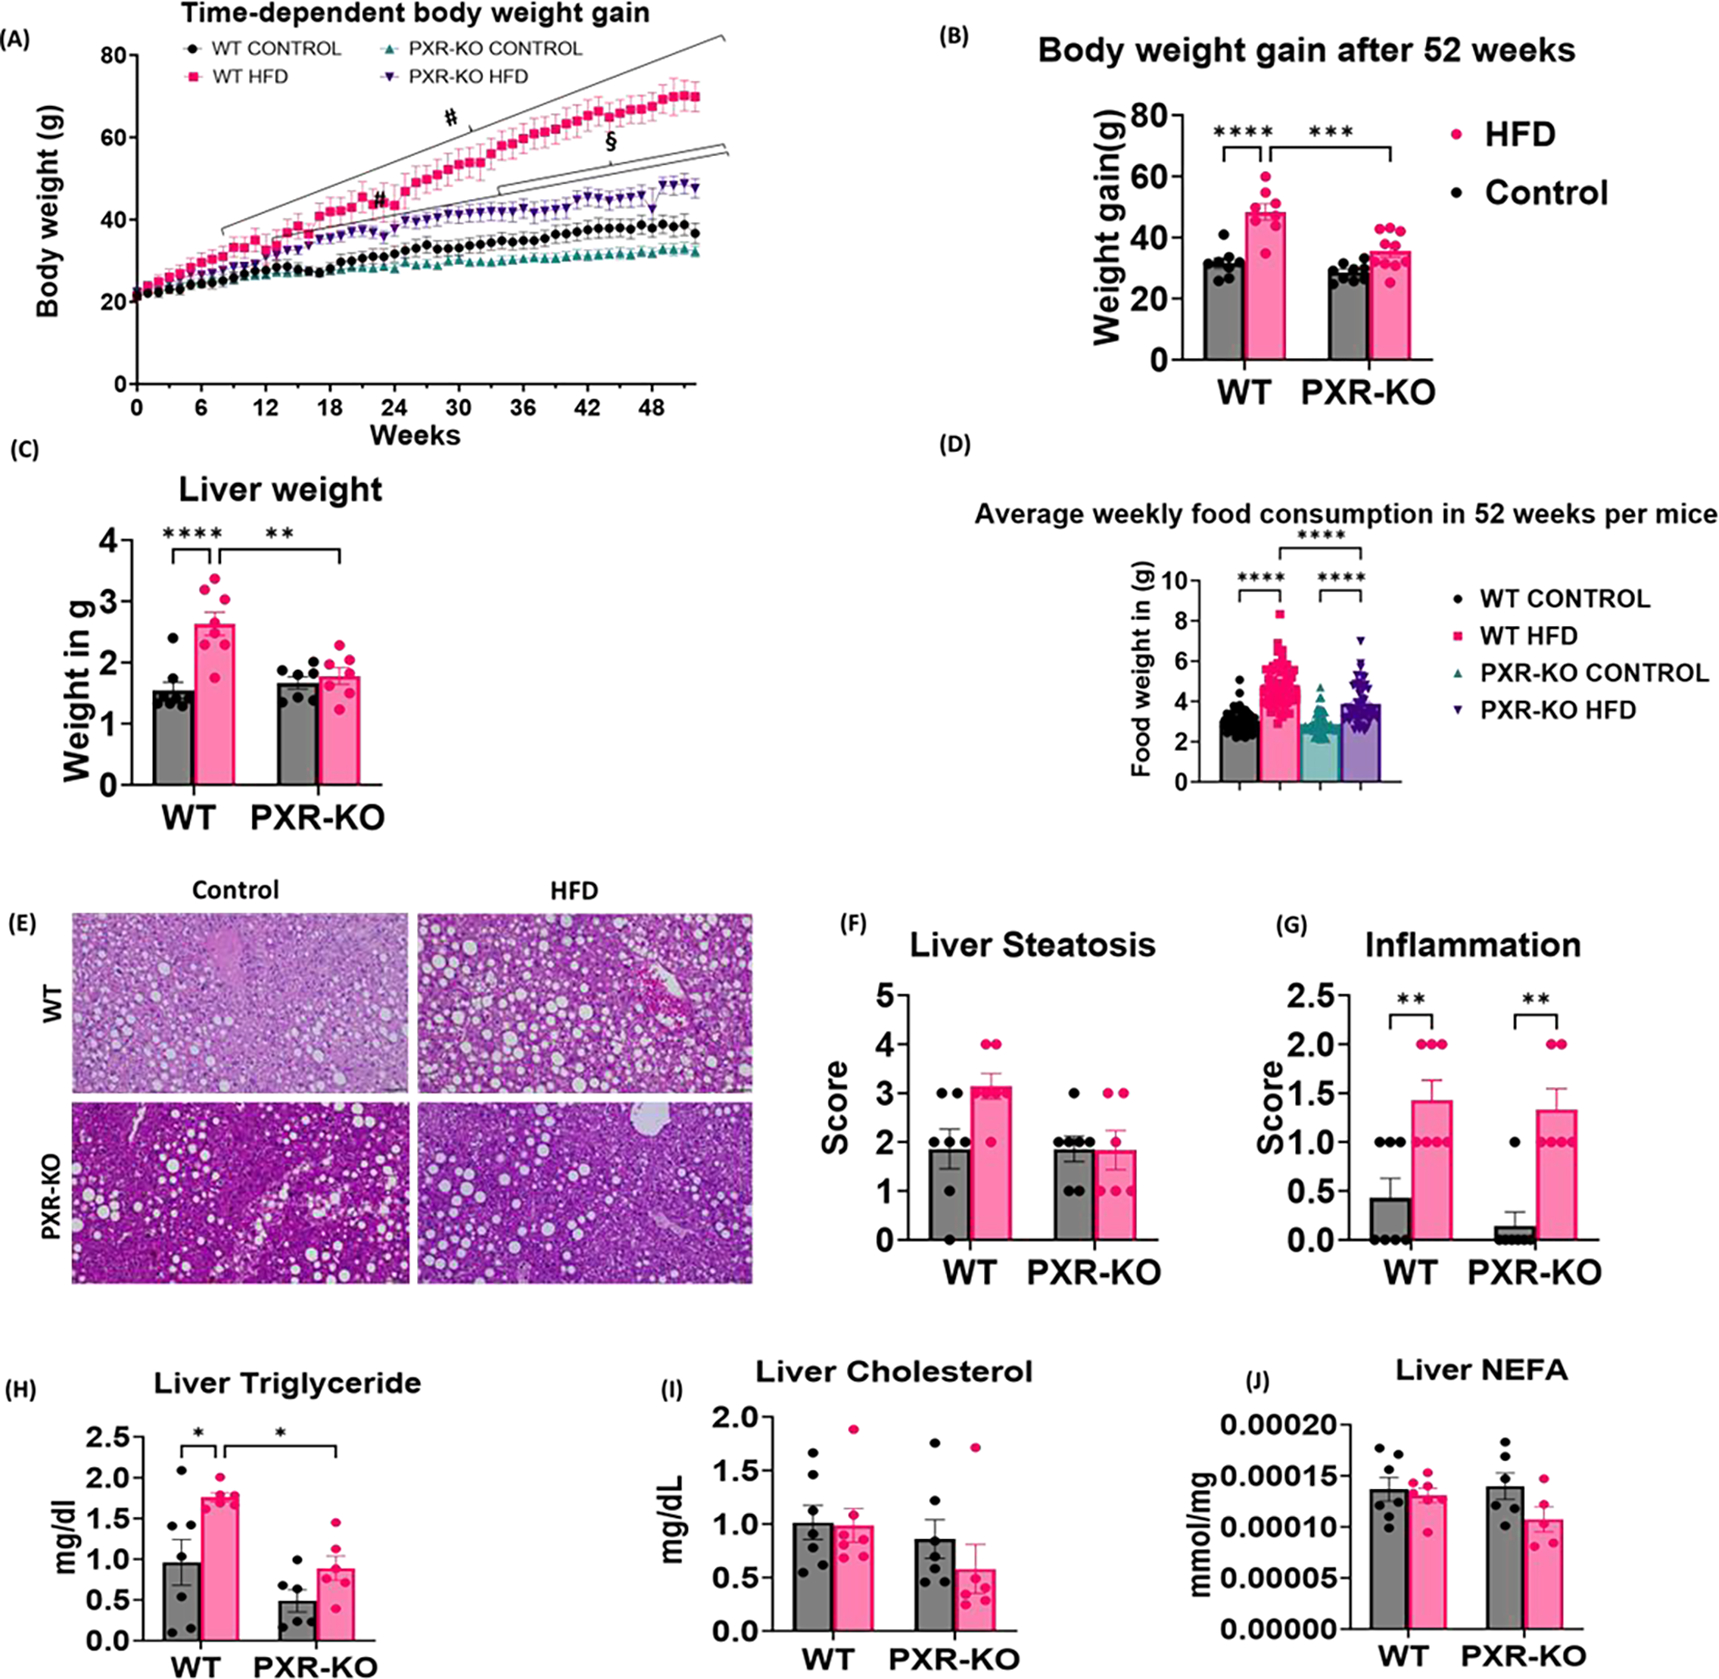
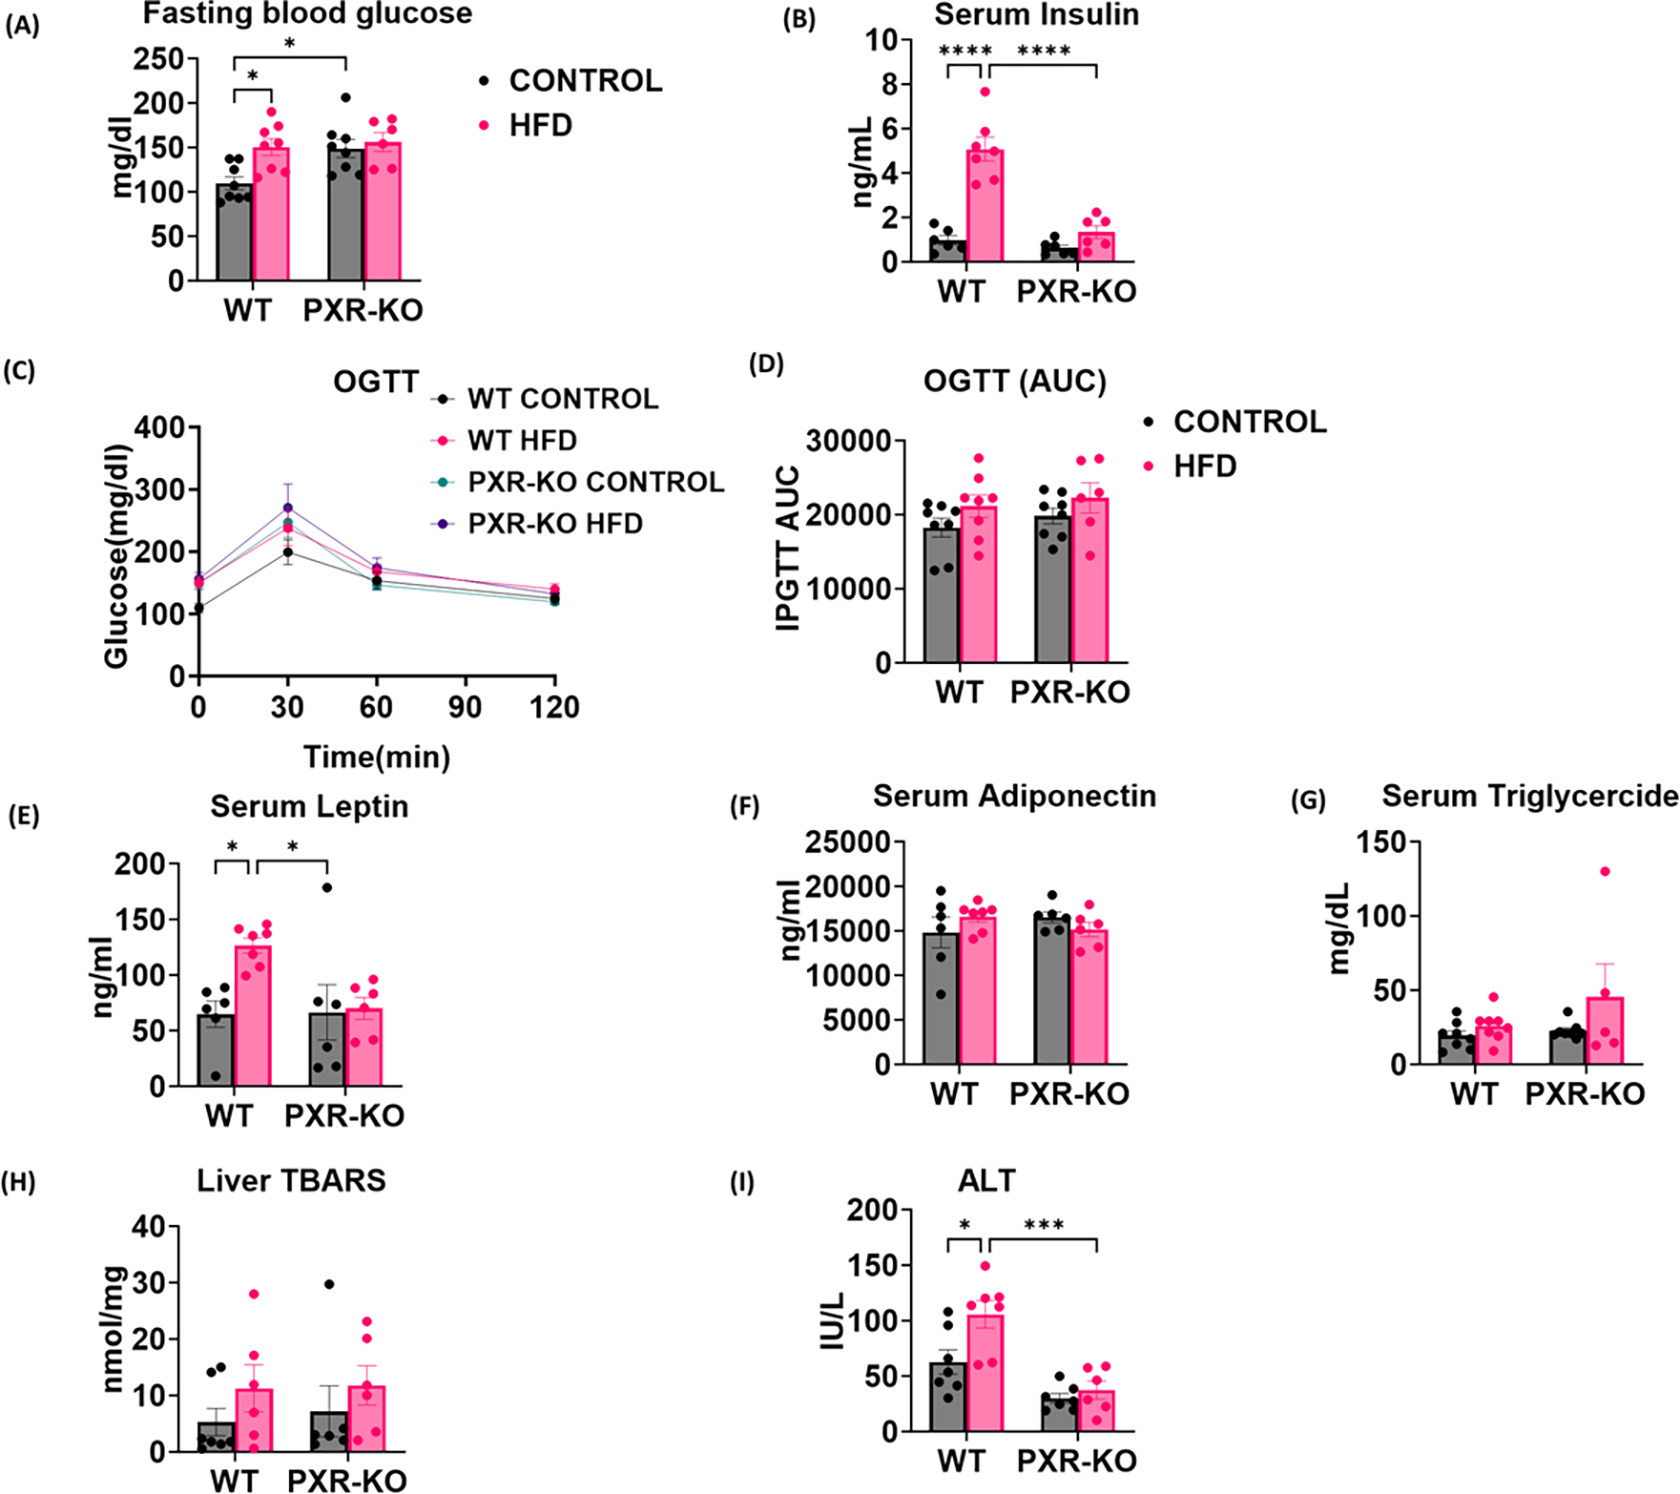
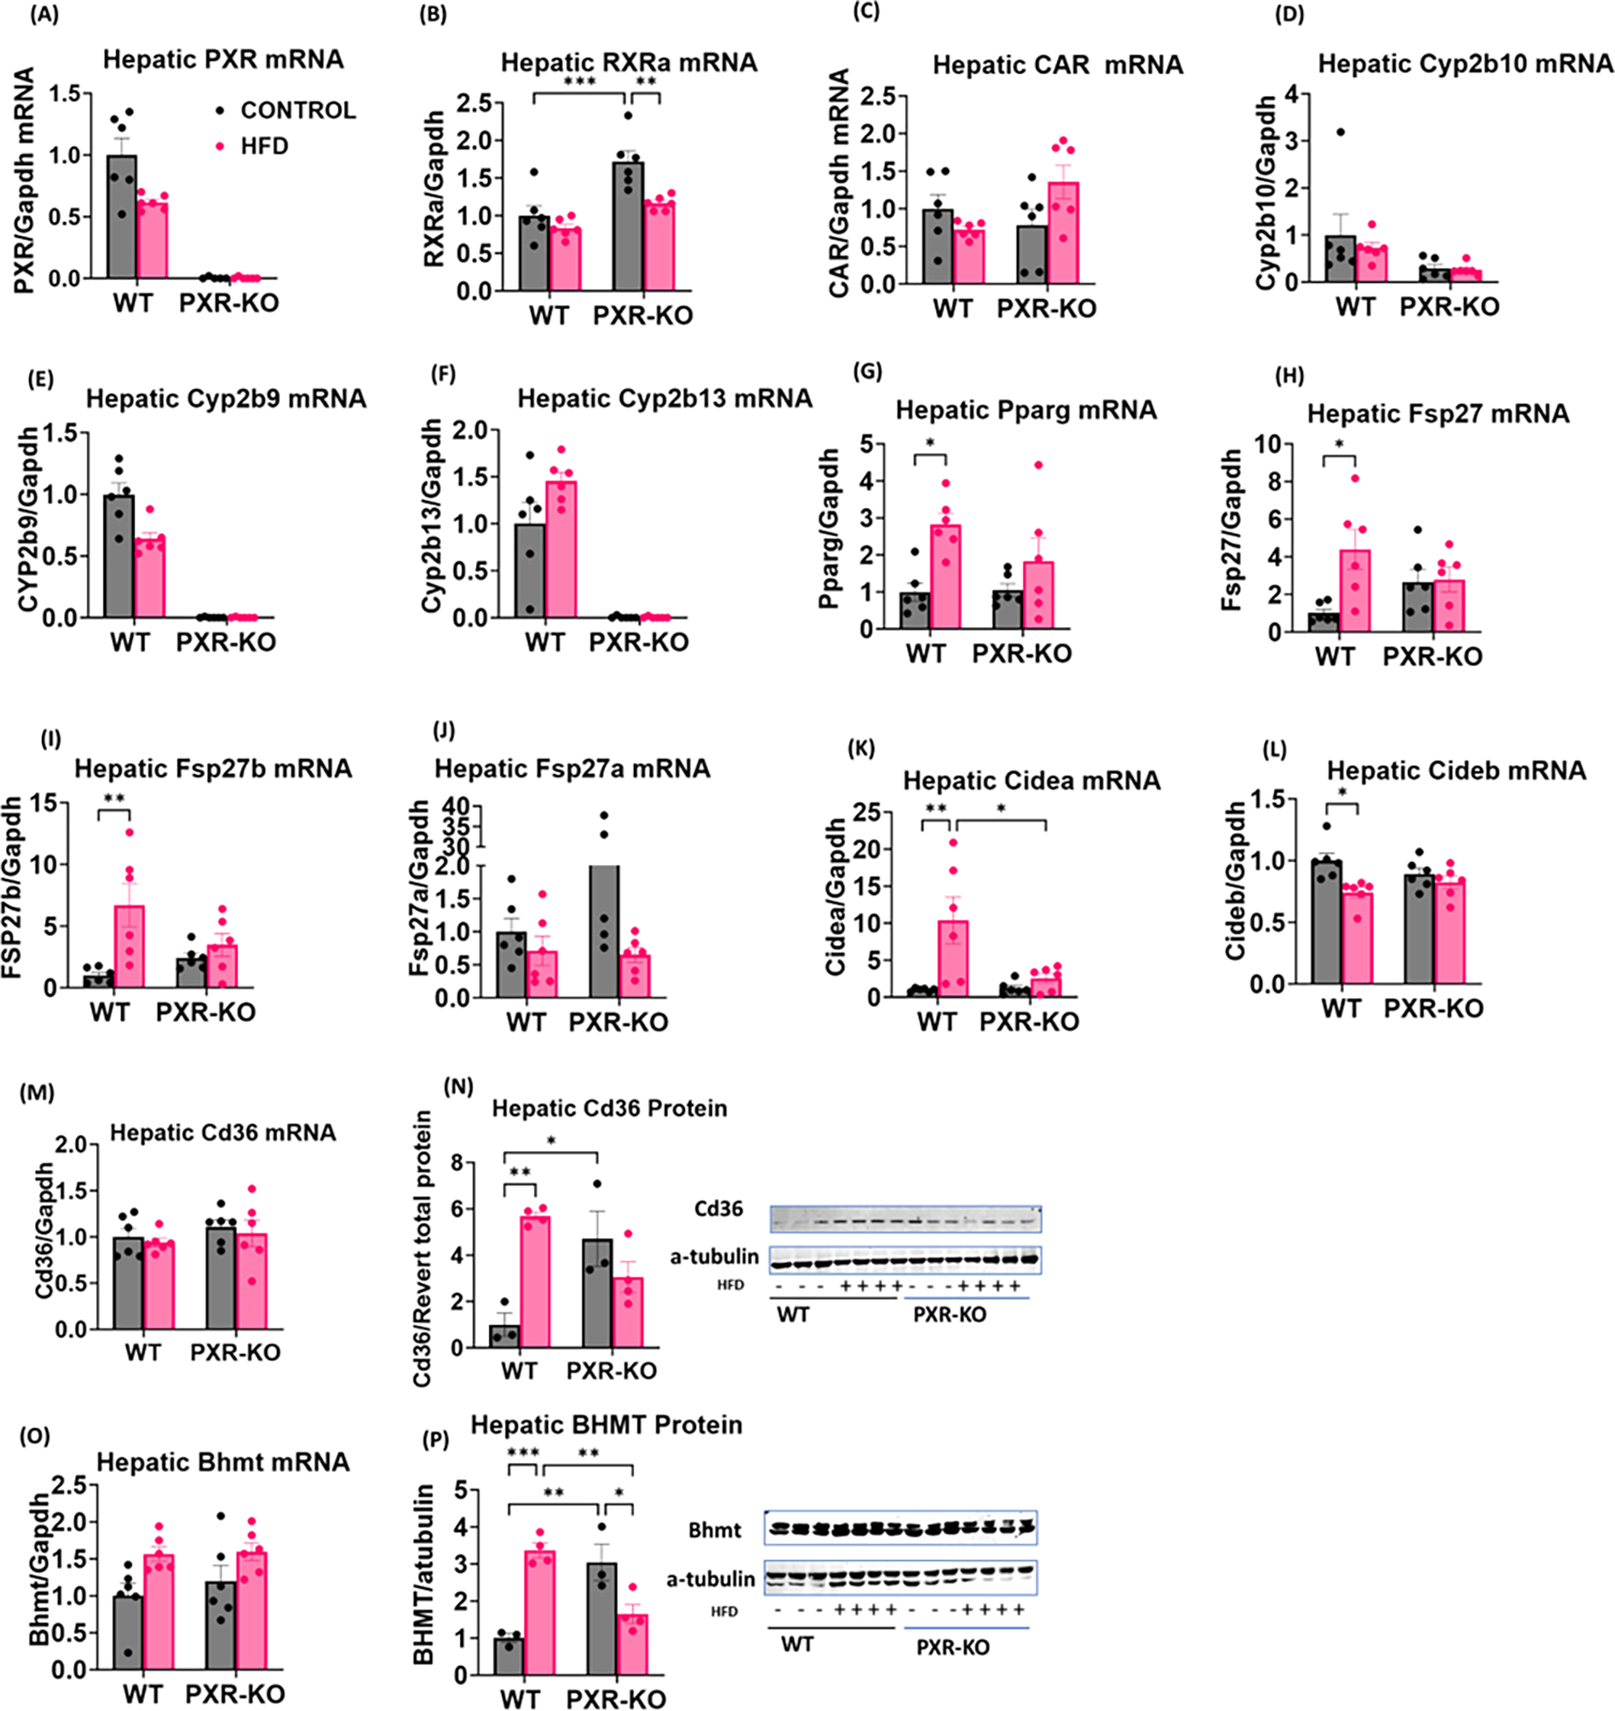
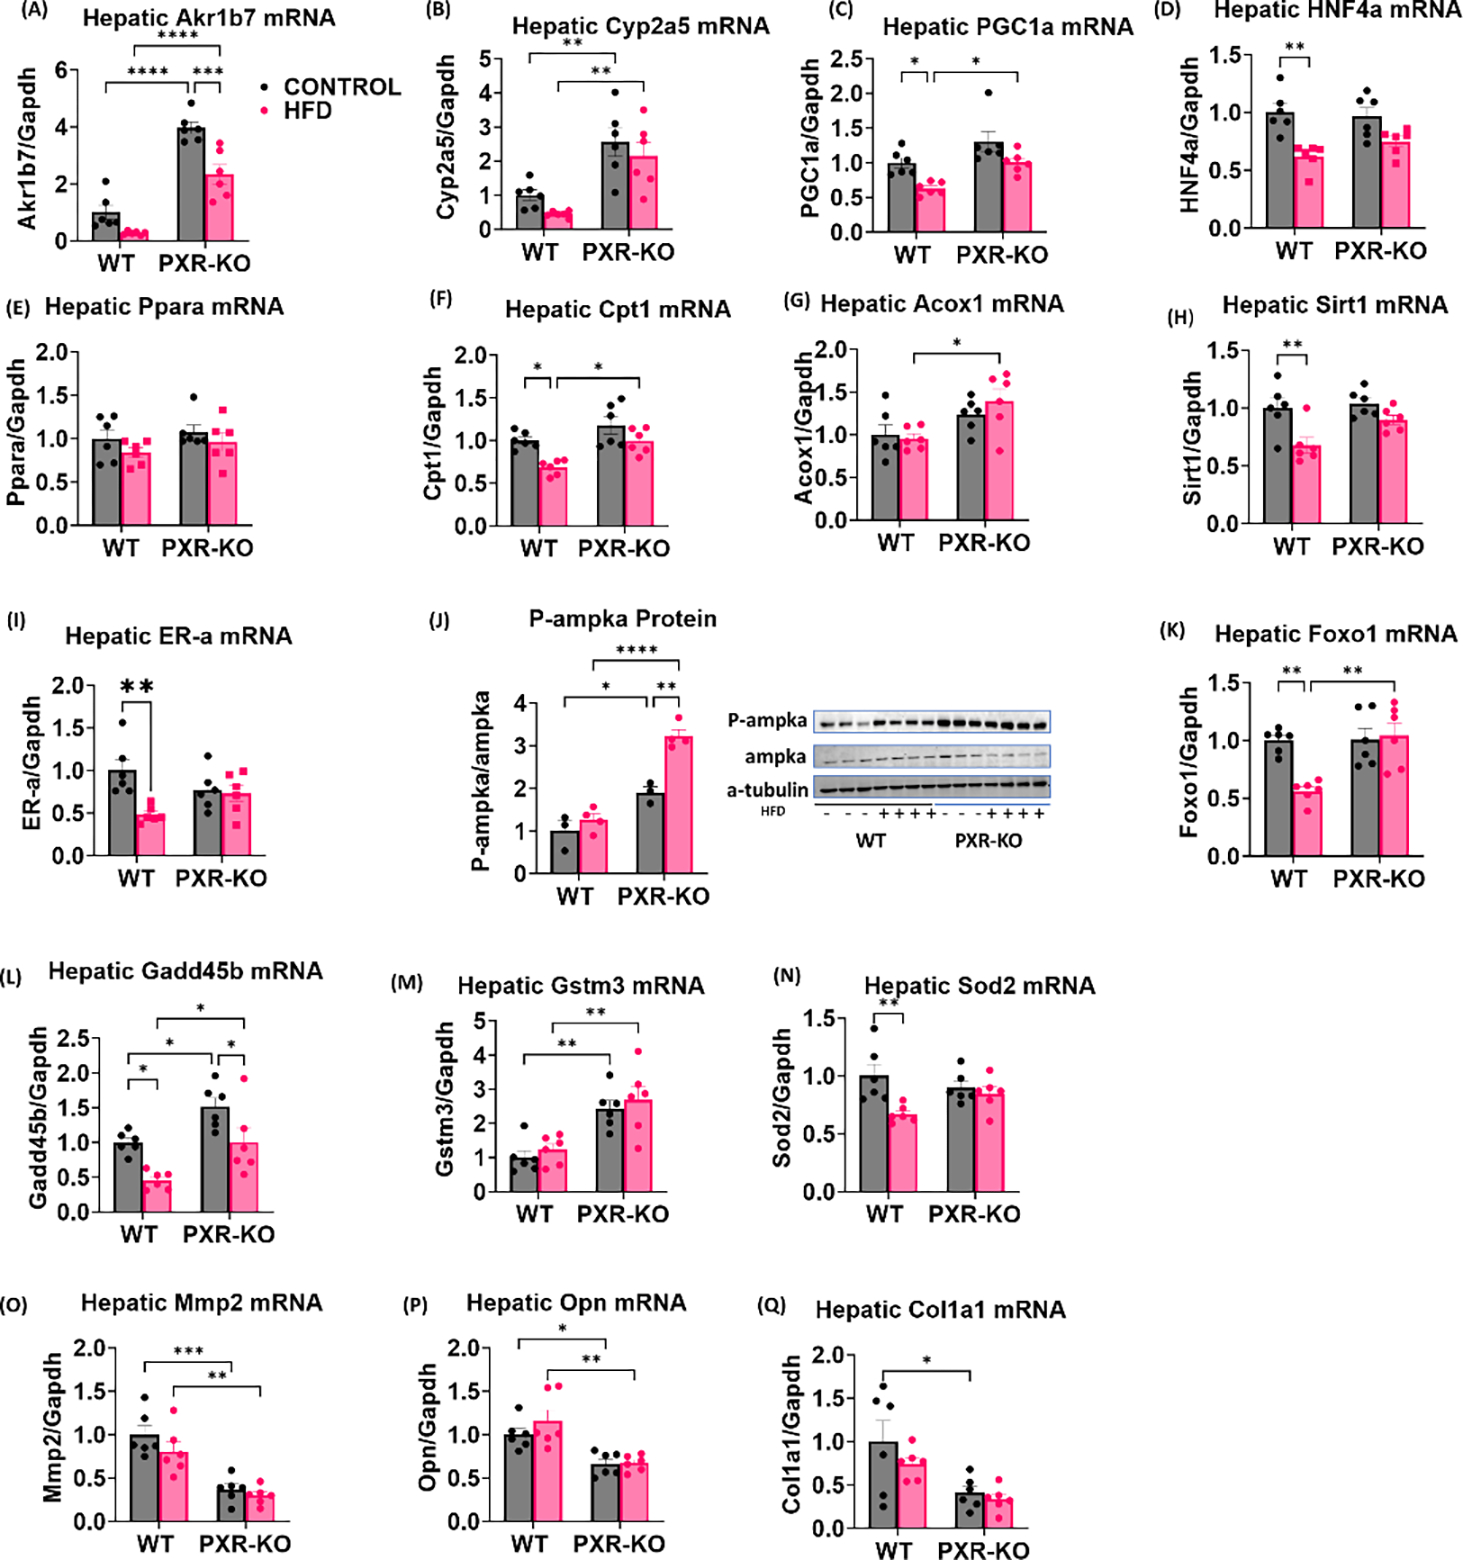
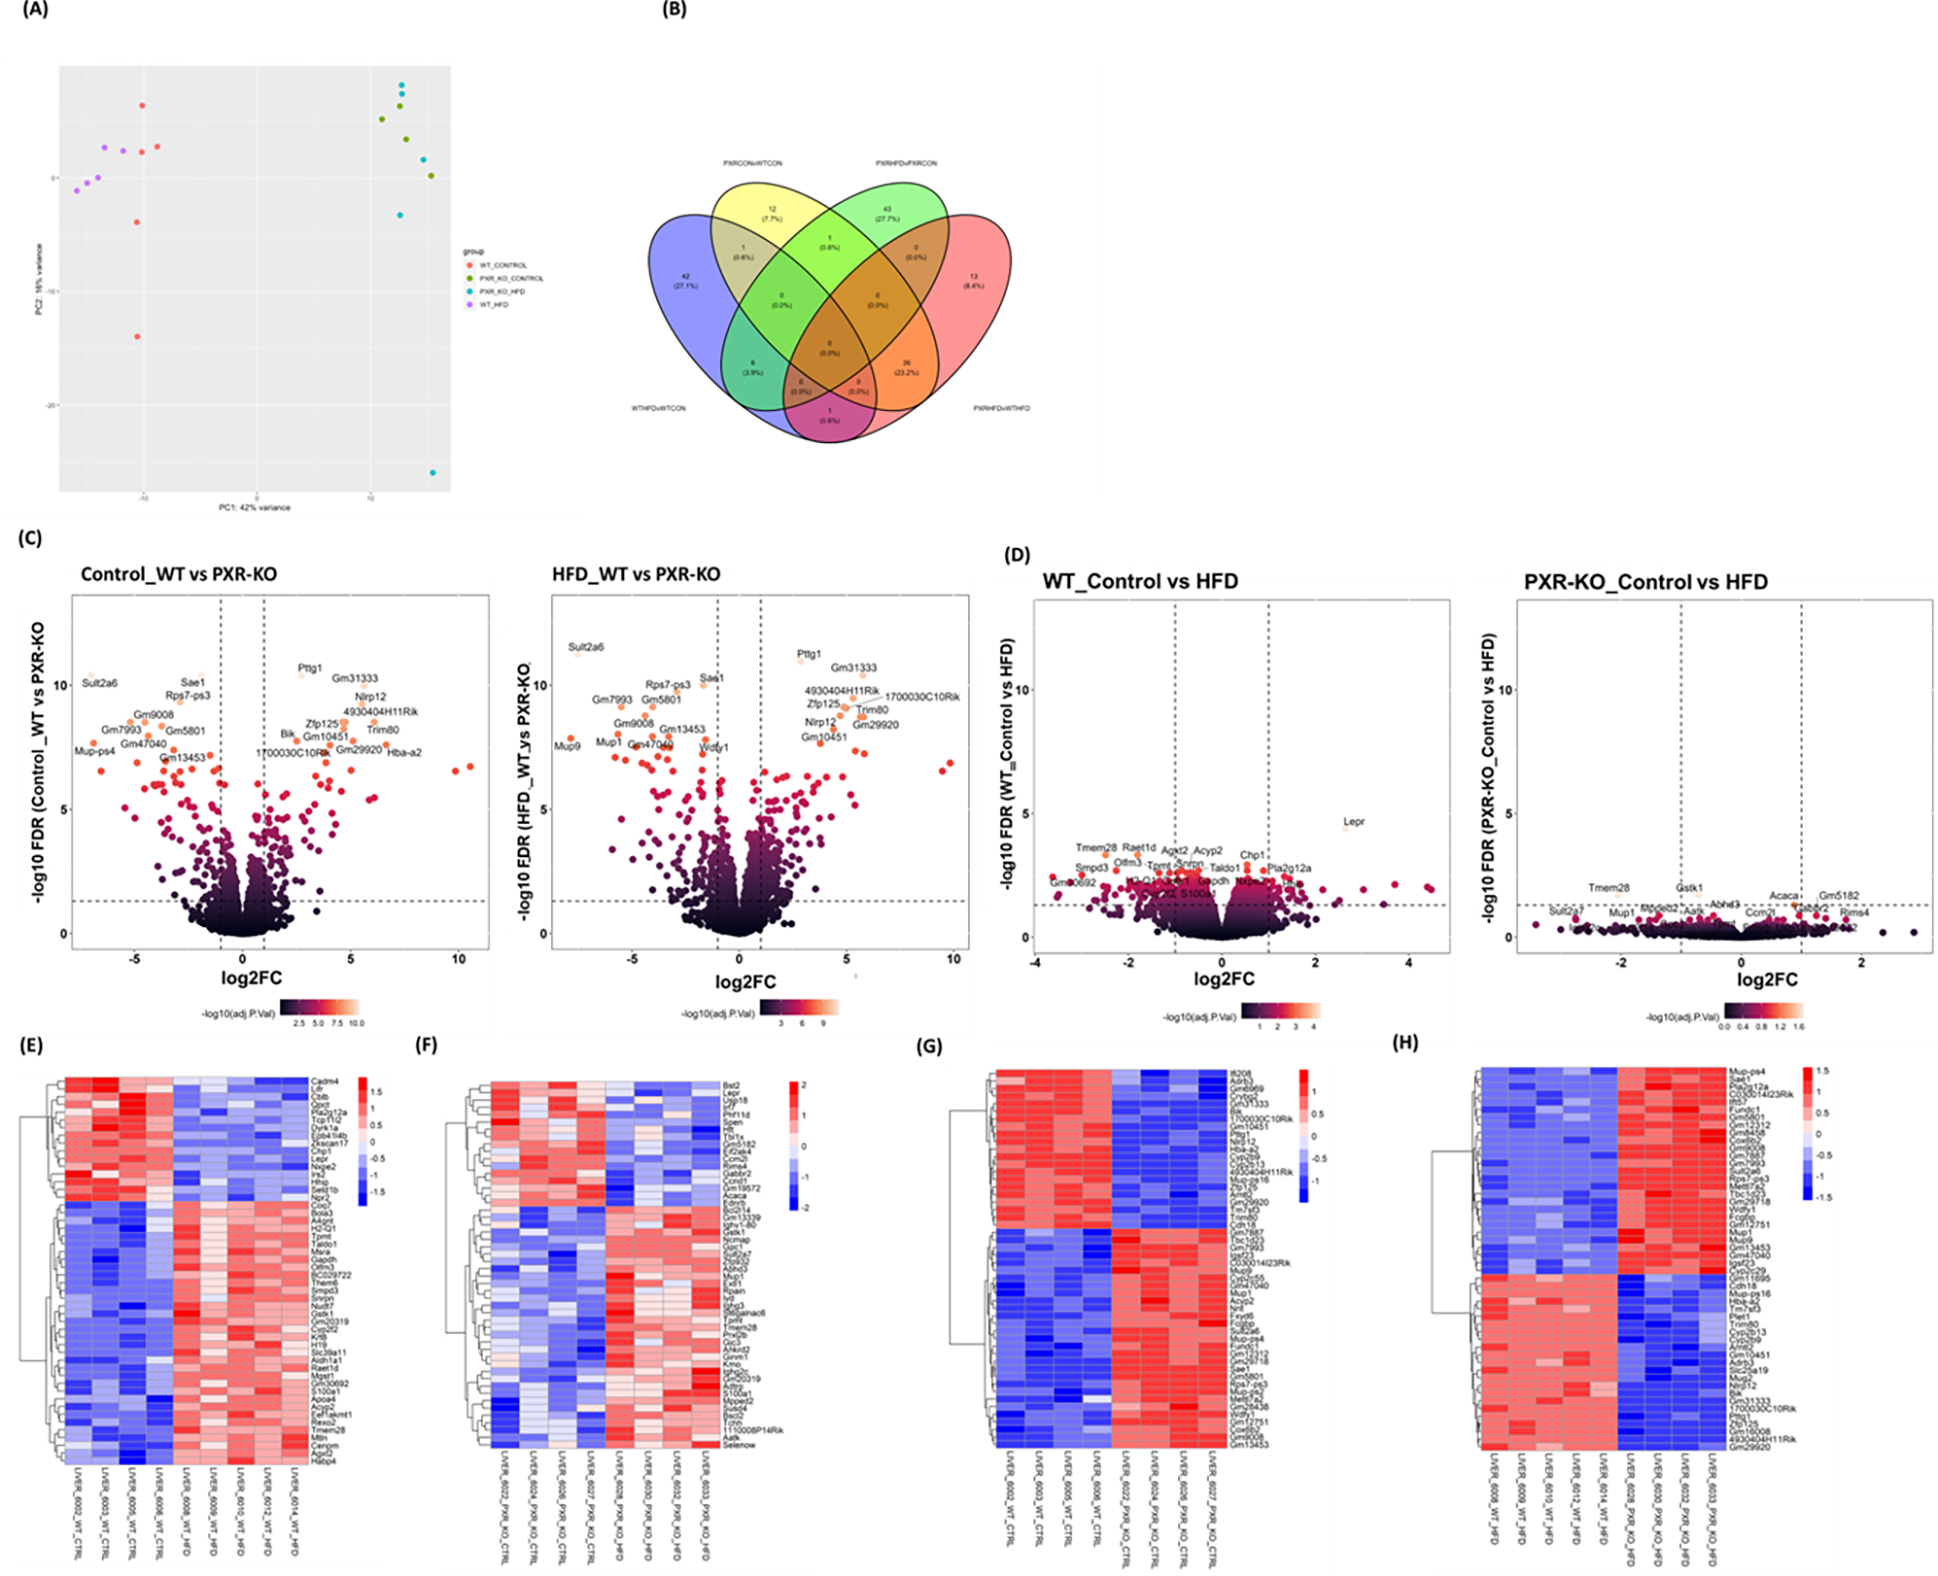
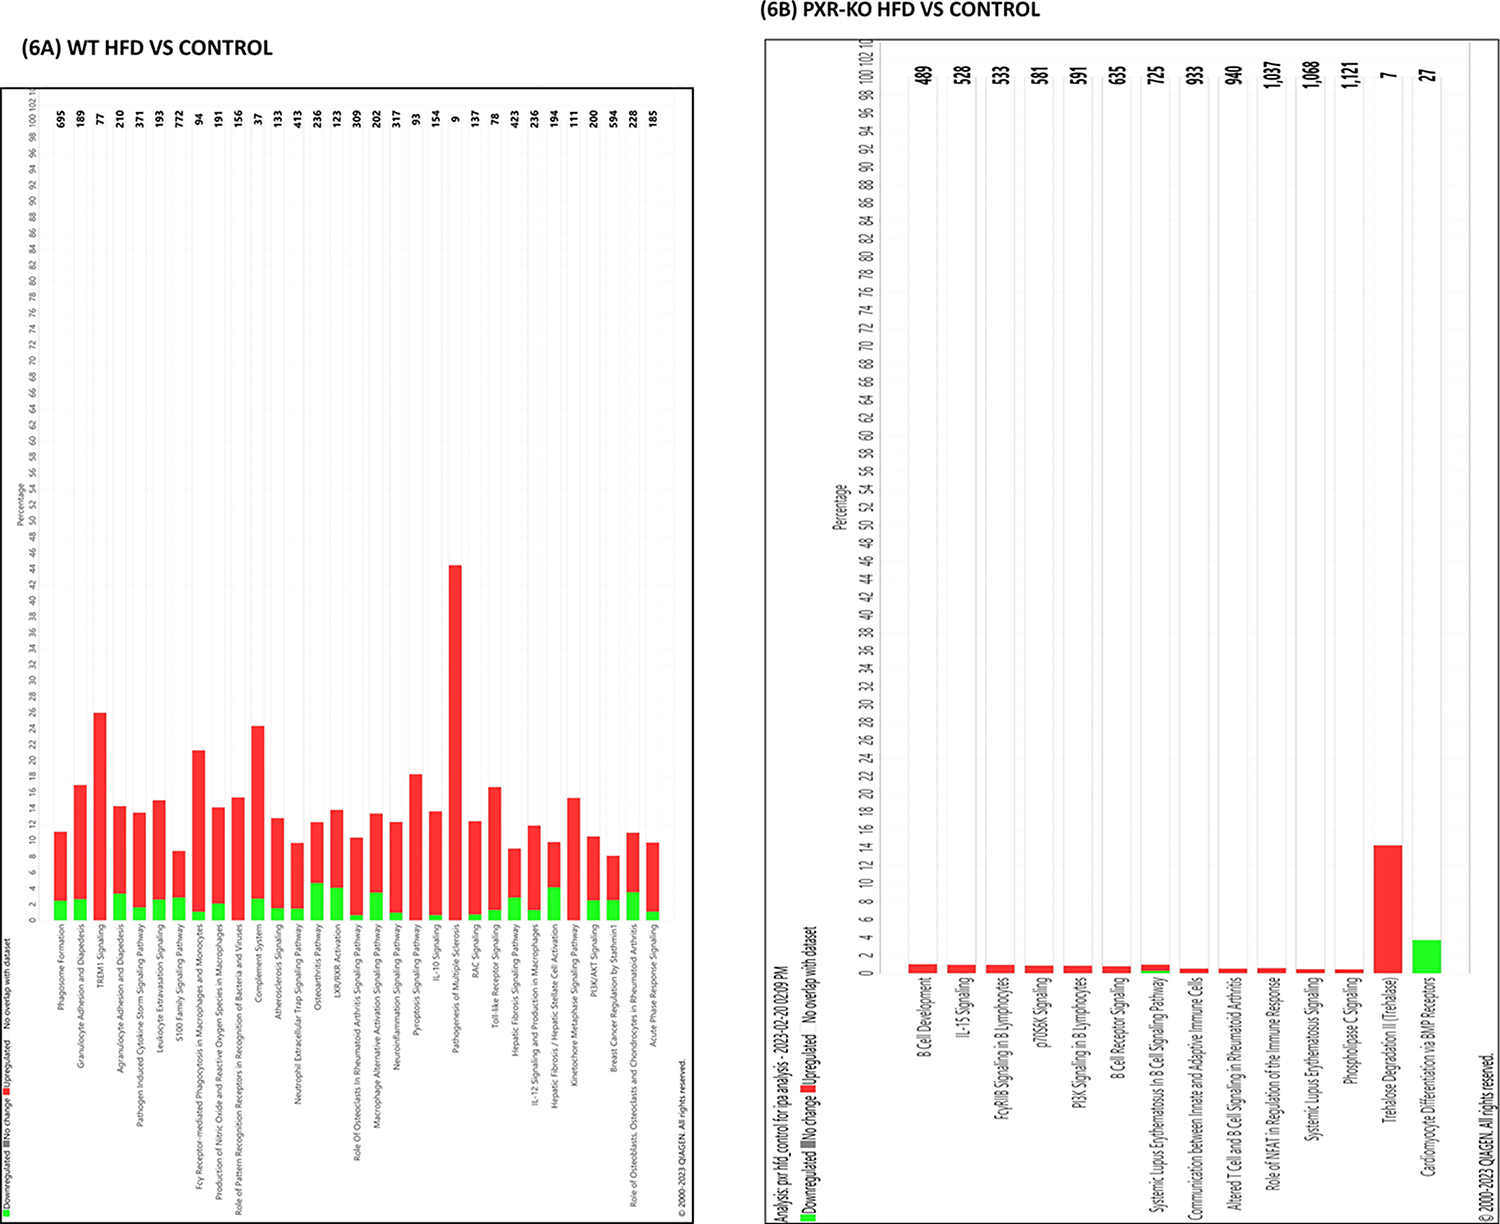
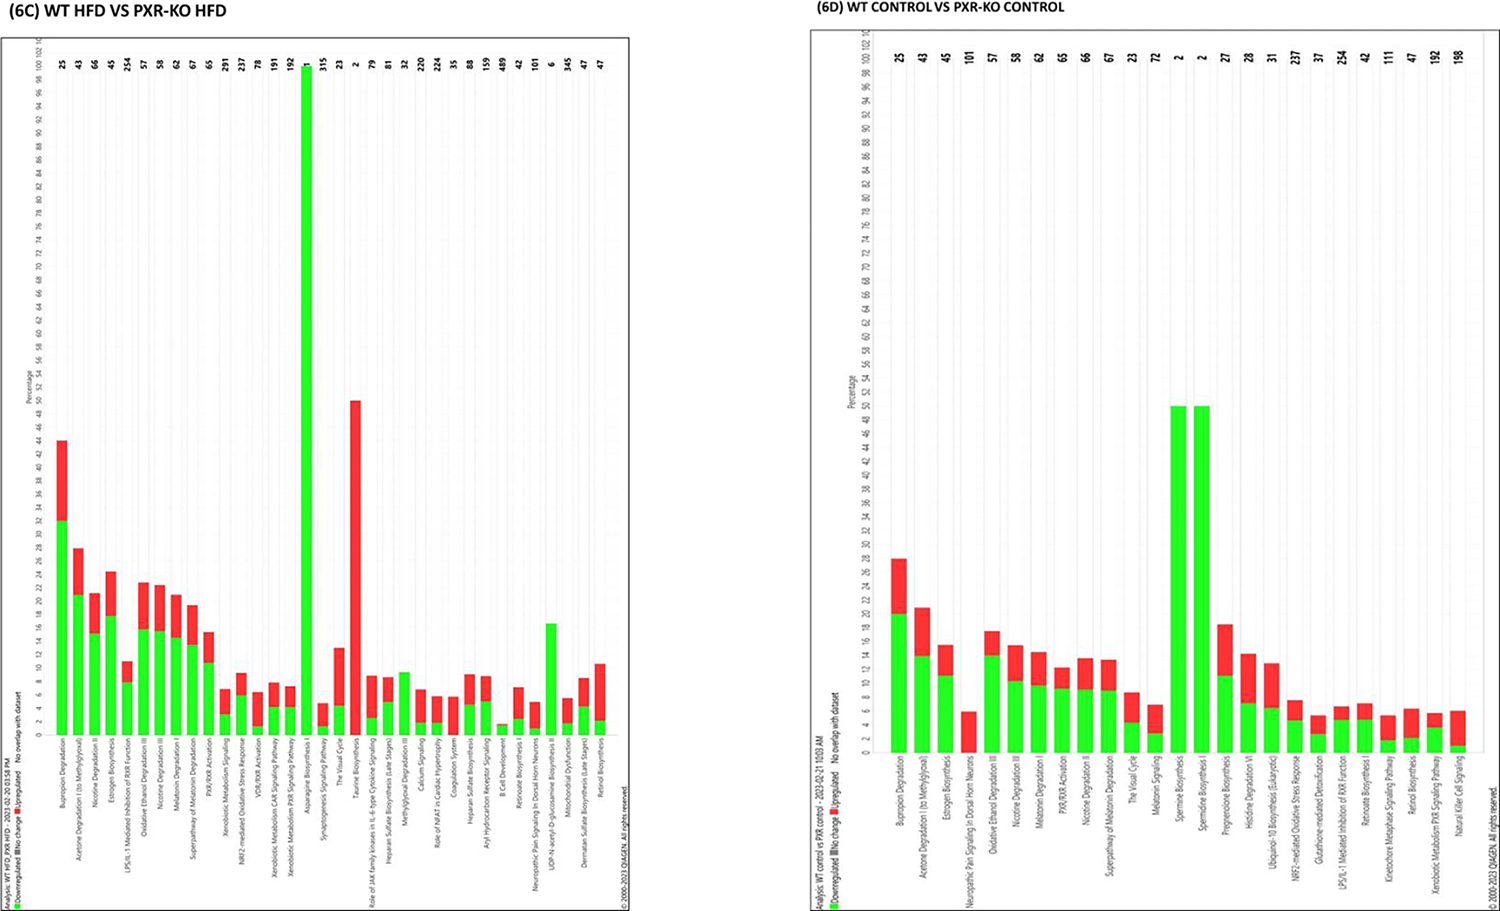
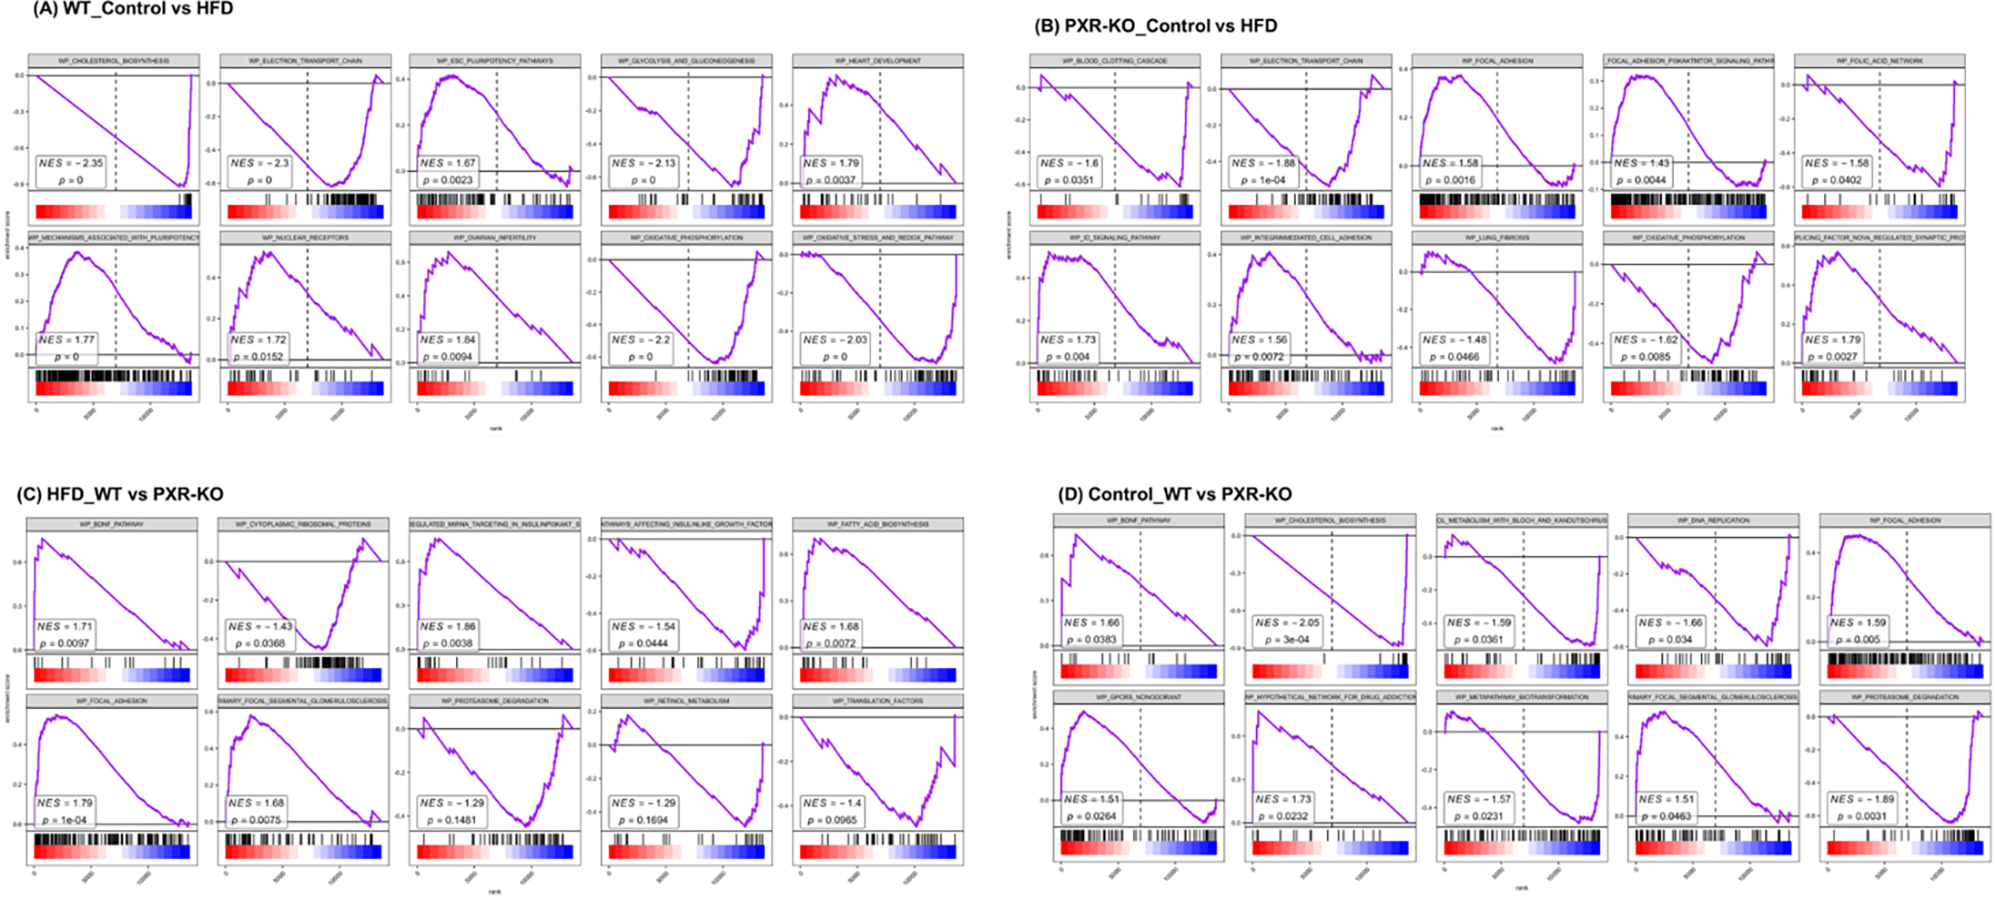
Obesity is a significant risk factor for several chronic diseases. However, pre-menopausal females are protected against high-fat diet (HFD)-induced obesity and its adverse effects. The pregnane X receptor (PXR, NR1I2), a xenobiotic-sensing nuclear receptor, promotes short-term obesity-associated liver disease only in male mice but not in females. Therefore, the current study investigated the metabolic and pathophysiological effects of a long-term 52-week HFD in female wild-type (WT) and PXR-KO mice and characterized the PXR-dependent molecular pathways involved. After 52 weeks of HFD ingestion, the body and liver weights and several markers of hepatotoxicity were significantly higher in WT mice than in their PXR-KO counterparts. The HFD-induced liver injury in WT female mice was also associated with upregulation of the hepatic mRNA levels of peroxisome proliferator-activated receptor gamma (Pparg), its target genes, fat-specific protein 27 (Fsp27), and the liver-specific Fsp27b involved in lipid accumulation, apoptosis, and inflammation. Notably, PXR-KO mice displayed elevated hepatic Cyp2a5 (anti-obesity gene), aldo-keto reductase 1b7 (Akr1b7), glutathione-S-transferase M3 (Gstm3) (antioxidant gene), and AMP-activated protein kinase (AMPK) levels, contributing to protection against long-term HFD-induced obesity and inflammation. RNA sequencing analysis revealed a general blunting of the transcriptomic response to HFD in PXR-KO compared to WT mice. Pathway enrichment analysis demonstrated enrichment by HFD for several pathways, including oxidative stress and redox pathway, cholesterol biosynthesis, and glycolysis/gluconeogenesis in WT but not PXR-KO mice. In conclusion, this study provides new insights into the molecular mechanisms by which PXR deficiency protects against long-term HFD-induced severe obesity and its adverse effects in female mice.
Keywords: Female; High-fat diet; Long-term diet; MAFLD; Obesity; Pregnane-X receptor.
Copyright © 2024 The Authors. Published by Elsevier Masson SAS.. All rights reserved.
Conflict of interest statement
Declaration of Competing Interest The authors declare the following financial interests/personal relationships, which may be considered as potential competing interests: Maxwell.A Gyamfi, Ph.D. reports financial support was provided by National Institutes of Health. The other authors declare that they have no competing financial interests or personal relationships that could have appeared to influence the work reported in this paper.
Figures
Similar articles
-
Pregnane X receptor exacerbates nonalcoholic fatty liver disease accompanied by obesity- and inflammation-prone gut microbiome signature.Biochem Pharmacol. 2021 Nov;193:114698. doi: 10.1016/j.bcp.2021.114698. Epub 2021 Jul 23. Biochem Pharmacol. 2021. PMID: 34303710 Free PMC article.
-
Pregnane X receptor (PXR) deficiency improves high fat diet-induced obesity via induction of fibroblast growth factor 15 (FGF15) expression.Biochem Pharmacol. 2017 Oct 15;142:194-203. doi: 10.1016/j.bcp.2017.07.019. Epub 2017 Jul 27. Biochem Pharmacol. 2017. PMID: 28756207
-
Molecular targets of PXR-dependent ethanol-induced hepatotoxicity in female mice.Biochem Pharmacol. 2024 Oct;228:116416. doi: 10.1016/j.bcp.2024.116416. Epub 2024 Jul 8. Biochem Pharmacol. 2024. PMID: 38986717
-
Insights of direct and indirect regulation of PXR through phosphorylation in fatty liver disease.Mol Pharmacol. 2025 Feb;107(2):100014. doi: 10.1016/j.molpha.2024.100014. Epub 2024 Dec 19. Mol Pharmacol. 2025. PMID: 40023513 Review.
-
Pregnane X Receptor Signaling Pathway and Vitamin K: Molecular Mechanisms and Clinical Relevance in Human Health.Cells. 2024 Apr 14;13(8):681. doi: 10.3390/cells13080681. Cells. 2024. PMID: 38667296 Free PMC article. Review.
Cited by
-
Special correlation between diet and MASLD: positive or negative?Cell Biosci. 2025 Apr 12;15(1):44. doi: 10.1186/s13578-025-01382-1. Cell Biosci. 2025. PMID: 40221799 Free PMC article. Review.
-
The microbiome's influence on obesity: mechanisms and therapeutic potential.Sci China Life Sci. 2025 Mar;68(3):657-672. doi: 10.1007/s11427-024-2759-3. Epub 2024 Nov 28. Sci China Life Sci. 2025. PMID: 39617855 Review.
-
Physiological Functions and Pathological Roles of PXR.J Endocr Soc. 2025 Jul 12;9(9):bvaf119. doi: 10.1210/jendso/bvaf119. eCollection 2025 Sep. J Endocr Soc. 2025. PMID: 40726484 Free PMC article. Review.
References
-
- WHO., 2020. WHO. World Health Organization (WHO): Obesity and overweight. World Health Organization.
-
- CDC., 2021. Overweight & Obesity. CDC.
MeSH terms
Substances
Grants and funding
LinkOut - more resources
Full Text Sources
Molecular Biology Databases
Research Materials
