. 2024 Mar 11;42(3):444-463.e10.
doi: 10.1016/j.ccell.2024.02.001. Epub 2024 Feb 29.

Multi-omic profiling of follicular lymphoma reveals changes in tissue architecture and enhanced stromal remodeling in high-risk patients

Affiliations

Multi-omic profiling of follicular lymphoma reveals changes in tissue architecture and enhanced stromal remodeling in high-risk patients

Andrea J Radtke et al. Cancer Cell. .

Abstract

Follicular lymphoma (FL) is a generally incurable malignancy that evolves from developmentally blocked germinal center (GC) B cells. To promote survival and immune escape, tumor B cells undergo significant genetic changes and extensively remodel the lymphoid microenvironment. Dynamic interactions between tumor B cells and the tumor microenvironment (TME) are hypothesized to contribute to the broad spectrum of clinical behaviors observed among FL patients. Despite the urgent need, existing clinical tools do not reliably predict disease behavior. Using a multi-modal strategy, we examined cell-intrinsic and -extrinsic factors governing progression and therapeutic outcomes in FL patients enrolled onto a prospective clinical trial. By leveraging the strengths of each platform, we identify several tumor-specific features and microenvironmental patterns enriched in individuals who experience early relapse, the most high-risk FL patients. These features include stromal desmoplasia and changes to the follicular growth pattern present 20 months before first progression and first relapse.

Keywords: B cell lymphoma; RNA-seq; cancer-associated fibroblasts; human lymph node; immunology; integrated analysis; multi-omic single-cell atlas; spatial proteomics; tumor microenvironment; tumor progression.


Conflict of interest statement

Declaration of interests N.F. is the Chief Medical Officer of BostonGene, Corp., and all authors affiliated with BostonGene, Corp. were employees thereof at the time the study was performed. E.P., A.V., A.B., I.G., V.S., A. Sarachakov, P.O., N.K., and R.A. are inventors of patents related to this work. A.L.S. is an employee and shareholder of AstraZeneca. The follicular lymphoma samples collection conducted at NIAID, NIH, was an investigator-initiated project funded by NIAID, NIH.

Figures

Figure 1.
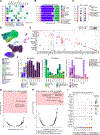
Figure 1.. Construction of LN atlases using multiple omics and imaging technologies.
(A) Tissues were profiled from non-FL and FL LNs. Schematic shows enlarged and stylized follicles. (B) Paired samples from normal and FL patients were profiled using multiple assays. Normal LNs were examined only by single cell technologies (scRNA-seq and IBEX). Tissue microenvironment (TME), multiplex immunofluorescence (MxIF). (C) Schematic depicting IBEX imaging technique. (D) Protein biomarkers targeted with IBEX or MxIF (*) grouped by cell type. (E) Comparison of information provided by each technology for each cohort. Resolution provided as an estimate only and based on analyses described in this work. See also Figure S1 and Tables S1–S2.
Figure 2.
Figure 2.. Cellular composition and gene expression patterns of normal and FL samples.
(A) Genomic alteration landscape. Each line provides the detected mutations and fusions (cyan - missense mutation, green - nonsense mutation, violet – frame shift mutation, pink box - fusions) patients annotated based on progression status. (B) Cell composition reconstruction from bulk RNA-seq data. (C) BCR calling from RNA-seq. Bubble corresponds to a unique or group of similar CDR3 sequences from heavy immunoglobulin genes. Size of circle corresponds to clonotype abundance. Bulk RNA-seq (bulk), scRNA-seq (scRNA) here and throughout. (D) UMAP plot of 36,212 single cells from all samples. (E) Expression of selected markers used for cell annotation of scRNA-seq clusters. Plasma cells (PCs), pDCs, Exhausted (Ex), and Cytotoxic (Cyt). (F) scRNA-seq frequencies of indicated cell types from each patient. (G) Gene set enrichment analysis of B cells from early relapsers (*) compared to all other samples plotted as enrichment score on the x-axis compared to the −log10 of the adjusted p-value on the y-axis. The pink box shows a cutoff of adjusted p-value < 0.05 calculated using mSigDB (described in STAR Methods). Each point represents a gene set, with top scoring gene sets labeled. (H) Same as G but only comparing B cells from early relapsers to other FL samples. (I) Dynamic expression of individual genes associated with Huet gene signature. See also Figure S2 and Tables S1–S4.
Figure 3.
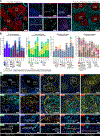
Figure 3.. Spatial survey of complex tissues using IBEX.
(A) Representative IBEX images of selected markers, scale bar 30 μm. Vimentin (Vim), Desmin (Des), Collagen IV (Coll IV). Row 3: Cell segmentation and cell typing plots for the same region. IBEX images of myeloid (Row 4) or stromal (Row 5) markers (left), segments and masks of immunofluorescence (IF) signal (middle), and tessellation masks of populations (right). (B) Heatmap of normalized mean marker expression used to define cell populations. 37 clusters were identified using cell segmentation. (C) UMAP plot of 0.9×10⁶ cells from all samples, colored by cell populations identified by IBEX. Quantification of B (D) or T cell (E) subpopulations obtained from IBEX and normalized by area imaged per sample. (F) Heatmap of the normalized mean marker expression of biomarkers for myeloid cell phenotyping by tessellation masks. (G) Quantification of myeloid subpopulations obtained from IBEX where cells are expressed as tessellation square counts per sample. (H) Heatmap of the normalized mean marker expression of biomarkers for stromal cell phenotyping by tessellation masks. (I) Quantification of stromal subpopulations obtained from IBEX where cells are expressed as tessellation square counts per sample. See Figures S3–S4 and Tables S2 and S5.
Figure 4.
Figure 4.. Cellular composition and histological patterns of secondary and neoplastic follicles.
(A) IBEX images depicting differences in the shape and cellular composition of B cell follicles from FL patients, scale bars 200 μm or 50 μm (blue and magenta insets). Tingible body macrophages (TGB, arrowheads). (B) Quantification of major B, T, myeloid, and stromal cells found within B cell follicles, obtained from IBEX and normalized by area imaged per sample. (C) IBEX images depicting histological patterns shared among early relapsers. Scale bar is 100 μm, 50 μm (Inset 1), and 25 μm (Insets 2 and 3). See also Figure S5.
Figure 5.
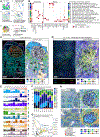
Figure 5.. Cellular communities are shared across normal LNs but distinct in tumors.
(A) Proximity community cluster analysis to identify cell-cell interactions using cell segments and masks (myeloid and stromal cells). (B) Left: heatmap showing the relative content of cell types identified in each proximity community cluster. Right: heatmap showing the proportion of myeloid and stromal masks in proximity radius of specified cell community. Each community (one single row) contains both segmented cells from the left heat map and masks for cell types from the right heat map. (C-D) IBEX images depicting follicles in non-FL (C) and FL LN (D) with corresponding community plots pseudo-colored as indicated, scale bar 100 μm. (E) Bar plots showing most abundant proximity communities identified by IBEX for the whole imaged section. (F) Proportion of proximity communities identified by IBEX in the B cell follicles, reflective of whole tissue section. (G) Distribution of B cell follicle communities across all normal and FL samples based on principal component analysis (PCA). Each symbol represents a follicle from indicated sample, rLN1 (n = 13 follicles). (H) Community plots from indicated patients. Insets show enlarged images of B cell follicle communities. See also Figure S5 and Table S2.
Figure 6.
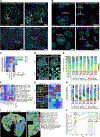
Figure 6.. Comparison of spatial patterns and cellular communities between IBEX and MxIF images.
(A) Comparison of IBEX and MxIF images for indicated patients. Scale bar (Left, CD21 panels 50 μm; Right, CD8 panels 100 μm). (B) Confocal images from MxIF samples. Scale bar 200 μm. (C) Heatmap showing follicle types for all samples. (D) Follicle composition in representative IBEX and MxIF images, CD21 (cyan), scale bar 1 mm. Bottom row: Follicles color-coded based on types described in C. (E) Follicle composition of IBEX and MxIF imaged samples. Each bar is a representative tissue section analyzed from an individual sample. (F) Heatmap of mean mask percentages per tessellation square of markers used to detect tessellation community clusters. (G) IBEX and MxIF images with corresponding tessellation masks showing community clusters (25 μm). White lines (right) indicate borders of community clusters shown in adjacent plots (left). (H) Tessellation community plots showing correspondence between IBEX and MxIF images. Each bar is a representative tissue section analyzed from an individual sample. (I) Tessellation community maps from one representative FL sample. (J) Percent similarity of IBEX and MxIF community composition depending on the area of tissue imaged and analyzed. Dots indicate the size of the IBEX region of interest. See also Figure S6 and Tables S2 and S6.
Figure 7.
Figure 7.. Data integration reveals extent of stromal under-sampling and remodeling in FL TME.
(A) Percentage of major cell populations measured by bulk RNA-seq (Bulk RNA), scRNA-seq (scRNA), and IBEX. (B) Heatmap showing the estimated number of cells to be profiled by scRNA-seq to identify a cluster (cell phenotype) originally identified by IBEX. (C) Heatmap showing correlations between expression of fibroblast gene signatures measured by bulk RNA-seq with proximity community clusters described in Figure 5. (D) Heatmap showing correlations between cytokine gene signatures measured by bulk RNA-seq and proximity community clusters described in Figure 5. (E) UMAP of 36,212 single cells from all samples pseudo-colored for CCR5 (blue) and CCL5 (red) gene expression in the indicated cell types. (F) UMAP of 36,212 single cells from all samples pseudo-colored for CCR5 (blue) and CCL4 (red) gene expression. (G) UMAP of 36,212 single cells from all samples pseudo-colored for CXCR5 (blue) and CXCL13 (red) gene expression. (H) IBEX images demonstrating CXCL13+ FDCs and FRCs. Scale bar is 100 μm (large) and 20 μm (small). (I) IBEX and MxIF images of ECM expansion in one patient sample. See also Figure S7 and Tables S2, S7–S8.
Figure 8.
Figure 8.. Changes in follicle composition and increased stromal remodeling in high-risk FL patients
(A) Follicle composition based on Cell DIVE-IBEX images and classifications in B. (B) Heatmap of follicle types based on indicated parameters. (C) Follicle composition for all samples. No follicles: FL-13 (*). (D) Proportion of follicle type 4 for all samples with FL-5 analyzed with early relapsers. (E) Time (months) from biopsy to relapse for indicated patients. (F) Heatmap of mean mask percentages per tessellation square for immune panel. (G) Tessellation community plots for communities in F. Graphs depicting the proportion of M1 (H) and M2 (I) tessellation communities by group. (J) Heatmap of mean mask percentages per tessellation square for stromal panel. (K) Tessellation community plots for communities in J. Graphs depicting the proportion of B1 (L) and S3 (M) tessellation communities by group. See also Figure S1, S8, and Tables S1–S2. (N) Description and statistical analysis of significant generalized linear model distinguishing early relapsers from other FL patients. (O) Communities ranked by the number of times they appear in a significant model (determined by the intercept p-value being < 0.1). (P) Distribution of samples based on the proportion of S4 and S1 communities in K. For all dotplots, data represented as mean ± SEM. Each symbol is a representative tissue section analyzed from an individual sample (n = 29). (D and N) ANOVA (Krustal-Wallis test) with Benjamini-Hochberg method for false discovery rate (FDR) to correct p-values for multiple comparisons. See also Figure S8 and Tables S1 and S6.

References

    1. Snyder MP, Lin S, Posgai A, Atkinson M, Regev A, Rood J, Rozenblatt-Rosen O, Gaffney L, Hupalowska A, Satija R, et al. (2019). The human body at cellular resolution: the NIH Human Biomolecular Atlas Program. Nature 574, 187–192. 10.1038/s41586-019-1629-x. - DOI - PMC - PubMed
    1. Jain S, Pei L, Spraggins JM, Angelo M, Carson JP, Gehlenborg N, Ginty F, Gonçalves JP, Hagood JS, Hickey JW, et al. (2023). Advances and prospects for the Human BioMolecular Atlas Program (HuBMAP). Nature Cell Biology 25, 1089–1100. 10.1038/s41556-023-01194-w. - DOI - PMC - PubMed
    1. Regev A, Teichmann SA, Lander ES, Amit I, Benoist C, Birney E, Bodenmiller B, Campbell P, Carninci P, Clatworthy M, et al. (2017). The Human Cell Atlas. Elife 6. 10.7554/eLife.27041. - DOI - PMC - PubMed
    1. Rozenblatt-Rosen O, Regev A, Oberdoerffer P, Nawy T, Hupalowska A, Rood JE, Ashenberg O, Cerami E, Coffey RJ, Demir E, et al. (2020). The Human Tumor Atlas Network: Charting Tumor Transitions across Space and Time at Single-Cell Resolution. Cell 181, 236–249. 10.1016/j.cell.2020.03.053. - DOI - PMC - PubMed
    1. Börner K, Teichmann SA, Quardokus EM, Gee JC, Browne K, Osumi-Sutherland D, Herr BW, Bueckle A, Paul H, Haniffa M, et al. (2021). Anatomical structures, cell types and biomarkers of the Human Reference Atlas. Nature Cell Biology 23, 1117–1128. 10.1038/s41556-021-00788-6. - DOI - PMC - PubMed

LinkOut - more resources