. 2024 Mar 13;4(3):100511.
doi: 10.1016/j.xgen.2024.100511. Epub 2024 Feb 29.

Genomic evolution shapes prostate cancer disease type

Affiliations

Genomic evolution shapes prostate cancer disease type

Dan J Woodcock et al. Cell Genom. .

Abstract

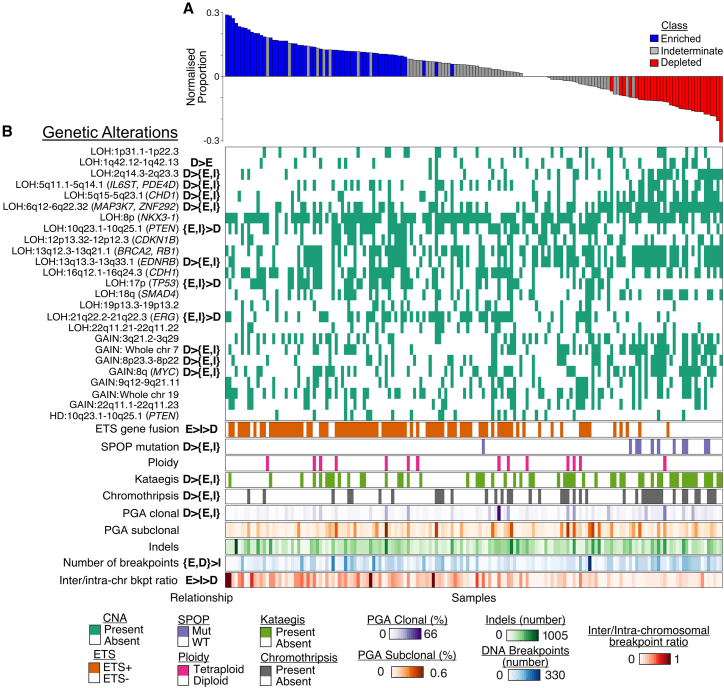
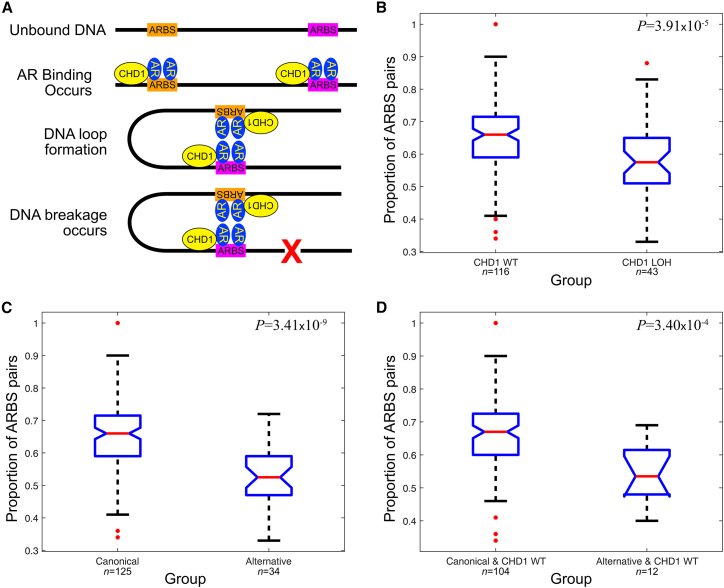
The development of cancer is an evolutionary process involving the sequential acquisition of genetic alterations that disrupt normal biological processes, enabling tumor cells to rapidly proliferate and eventually invade and metastasize to other tissues. We investigated the genomic evolution of prostate cancer through the application of three separate classification methods, each designed to investigate a different aspect of tumor evolution. Integrating the results revealed the existence of two distinct types of prostate cancer that arise from divergent evolutionary trajectories, designated as the Canonical and Alternative evolutionary disease types. We therefore propose the evotype model for prostate cancer evolution wherein Alternative-evotype tumors diverge from those of the Canonical-evotype through the stochastic accumulation of genetic alterations associated with disruptions to androgen receptor DNA binding. Our model unifies many previous molecular observations, providing a powerful new framework to investigate prostate cancer disease progression.

Keywords: AR binding; cancer evolution; evotype model; evotypes; ordering; prostate cancer.


Conflict of interest statement

Declaration of interests An international patent related to this work has been published under international publication no. WO 2023/047140 A1. R.A.E. has the following conflicts of interest to declare: she has received honoraria from GU-ASCO, Janssen, The University of Chicago, and Dana-Farber Cancer Institute USA as a speaker and educational honorarium from Bayer and Ipsen and is a member of the external expert committee to Astra Zeneca UK. She undertakes private practice as a sole trader at The Royal Marsden NHS Foundation Trust and 90 Sloane Street SW1X 9PQ and 280 Kings Road SW3 4NX, London, UK.

Figures

None
Graphical abstract
Figure 1
Figure 1
Co-occurrence of genetic alterations distinguishes three metaclusters After performing feature extraction, we calculated a discrimination score quantifying the relevance of each feature in predicting relapse (green heatmap). Fourteen features (red) were used as inputs for k-medoid clustering with 11 clusters. The medoids of each cluster were used as inputs to hierarchical clustering using all features, which revealed three main metaclusters, MC-A, MC-B1, and MC-B2, with different profiles as indicated by the dendrogram. The main heatmap shows the medoid feature values for the patients in each cluster, ordered by the hierarchical clustering (scale to right). The number of samples in each cluster is given below the corresponding cluster medoid. Metacluster colors are denoted by the text above the dendrogram.
Figure 2
Figure 2
Classification by proximity of DNA breakpoints to ARBSs reveals common genetic alterations (A) The proportion of DNA breakpoints within 20 kilobases (kb) of an ARBS for each patient, normalized by the number of proximal breakpoints expected by chance (vertical axis). Tumor samples are ordered according to this normalized proportion (horizontal axis). Classes were determined based on whether the tumor displayed more (Enriched) or fewer (Depleted) proximal breakpoints than expected or there was no statistical significance (Indeterminate). (B) Heatmaps of genomic features for each patient, ordered as above. Statistically significant relationships for the three classes are shown in the relationship column, where E, D, and I indicate the Enriched, Depleted, and Indeterminate classes, respectively. Braces indicate no relationship between the enclosed classes but that they both display significant differences to the remaining class. Relationships are ordered so the leftmost class(es) are those showing a significantly greater proportion of the corresponding genetic alteration. For Bernoulli variables, significance was determined with chi-squared test followed by a Fisher’s exact test for each pairwise relationship; for continuous variables, a Kruskal-Wallace test with Tukey’s honestly significant difference (HSD) was used (false discovery rate [FDR]-adjusted p < 0.05 for all tests).
Figure 3
Figure 3
Samples can be differentiated by order of genetic alterations Phylogenetic trees from individual tumors were used to estimate two ordering profiles using a Plackett-Luce (P-L) mixture model. Tumors were assigned to Ordering-I (top) or Ordering-II (bottom). Horizontal box and whisker plots (5th/25th/75th/95th percentiles) represent the spread of bootstrap estimates of the negative P-L coefficient (αi) for the ith genetic alteration (x axis). Here, the lower the value of αi, the earlier the genetic alteration is likely to occur. The y axis shows the proportion of samples in the mixture component in which the genetic alteration was observed. Colors of the box and whiskers denote the chromosome on which the aberration occurred. Genetic alterations were annotated if they were identified as an ETS fusion, occurred with a proportion above 0.25, or were identified in the earliest 5 events; these have chromosomal regions given, with notable driver genes in the region given in brackets where applicable. Other genetic alterations were not annotated and are displayed with reduced transparency.
Figure 4
Figure 4
Integrating results reveal multiple evolutionary trajectories converging to two disease types (A) A comparison of how tumors were classified in each of the three previous methods. Each side of the triangle corresponds to a classification method, wherein each bar in the triangle denotes a group identified by that method. Values at the intersections of each bar show the number of tumors that were consistent with both classes. Values outside the main triangle denote the total number of tumors in that class. Colors are those used in previous figures. (B) A schematic of the evotype model for prostate cancer evolution. (C) The prevalence of each genetic aberration in each evotype, as determined using the majority consensus of the three classifiers. Aberrations with significant differences between evotypes are colored by the evotype displaying the highest proportion (FDR-adjusted p < 0.05, Fisher’s exact test). (D) A surface plot showing the probability density of a tumor being assigned to the Canonical-evotype relative to the number of aberrations. Common modes of evolutionary progression follow regions of high density as the number of aberrations increases. Exemplars of such routes are indicated by black dashed lines. These are labeled according to their likely evotype, a behavioral descriptor, and notable driver genes affected by aberrations that are prevalent in the areas along the path to convergence (Figures S7 and S8).
Figure 5
Figure 5
Frequency of AR-induced DNA loops associated with DSBs is associated with CHD1 loss and evotype status (A) A simplified schematic of AR binding to ARBSs, where CHD1 protein is part of a complex that induces DNA loop formation and subsequent DSBs, denoted by the red X. (B) A notched box and whisker plot shows that adjacent proximal ARBS pairs that are required for DNA loops to form were observed less frequently in the vicinity of breakpoints in CHD1-deficient tumors than CHD1 wild-type tumors. (C) DSB-associated ARBS pairs occurred less frequently in tumors of the Alternative-evotype than the Canonical-evotype. (D) DSB-associated ARBS pairs occurred less frequently in CHD1 wild-type tumors of the Alternative-evotype than the Canonical-evotype. All p values were determined through a one-sided Mann-Whitney U test.
Figure 6
Figure 6
Utility of evotype model in survival analysis Kaplan-Meier plots for (A) the evotypes; (B) 20 tumors with greatest tumor mutational burden (high-TMB) against the remainder (low-TMB); (C) ISUP Gleason grade; (D) 10 tumors with highest TMB for each evotype (high-TMB Alternative and high-TMB Canonical) against the remainder (low-TMB combined); (E) the ISUP Gleason grade ≥3 tumors in the high-TMB evotype classes (Evo-TMB-Gleason high) and the remainder (Evo-TMB-Gleason low); (F) Alternative-evotype tumors in MC-A (MC-A/Alternative) and Canonical-evotype tumors in MC-B2 (MC-B2/Canonical) and the remainder (MC-B1/combined); and (G) ISUP Gleason grade ≥ 3 tumors of either MC-A/Alternative or MC-B2/Canonical (MC-A/B2-Gleason high combined) against the remainder (MC-A/B1/B2-Gleason low combined). For each comparison, we provide the hazard ratio (HR) and p value calculated with the Cox proportional hazard test; p values were adjusted for Gleason grade, TMB, and age at diagnosis if they were not used to create the sets used in the comparison (padj) and Harrell’s C-index. In (D) and (F), these values are given for the denoted class in comparison to the remainder only. Endpoint is time to biochemical recurrence.
Algorithm 1
Algorithm 1
Pseudocode for amalgamating weight matrices

References

    1. Nowell P.C. The clonal evolution of tumor cell populations. Science. 1976;194:23–28. - PubMed
    1. Fearon E.R., Vogelstein B. A genetic model for colorectal tumorigenesis. Cell. 1990;61:759–767. doi: 10.1016/0092-8674(90)90186-i. - DOI - PubMed
    1. Gerstung M., Jolly C., Leshchiner I., Dentro S.C., Gonzalez S., Rosebrock D., Mitchell T.J., Rubanova Y., Anur P., Yu K., et al. The evolutionary history of 2,658 cancers. Nature. 2020;578:122–128. doi: 10.1038/s41586-019-1907-7. - DOI - PMC - PubMed
    1. Nangalia J., Nice F.L., Wedge D.C., Godfrey A.L., Grinfeld J., Thakker C., Massie C.E., Baxter J., Sewell D., Silber Y., et al. DNMT3A mutations occur early or late in patients with myeloproliferative neoplasms and mutation order influences phenotype. Haematologica. 2015;100:e438–e442. doi: 10.3324/haematol.2015.129510. - DOI - PMC - PubMed
    1. Ortmann C.A., Kent D.G., Nangalia J., Silber Y., Wedge D.C., Grinfeld J., Baxter E.J., Massie C.E., Papaemmanuil E., Menon S., et al. Effect of mutation order on myeloproliferative neoplasms. N. Engl. J. Med. 2015;372:601–612. doi: 10.1056/NEJMoa1412098. - DOI - PMC - PubMed