. 2024 Mar 14;187(6):1402-1421.e21.
doi: 10.1016/j.cell.2024.02.002. Epub 2024 Feb 29.

Maternal inflammation regulates fetal emergency myelopoiesis

Affiliations

Maternal inflammation regulates fetal emergency myelopoiesis

Amélie Collins et al. Cell. .

Abstract

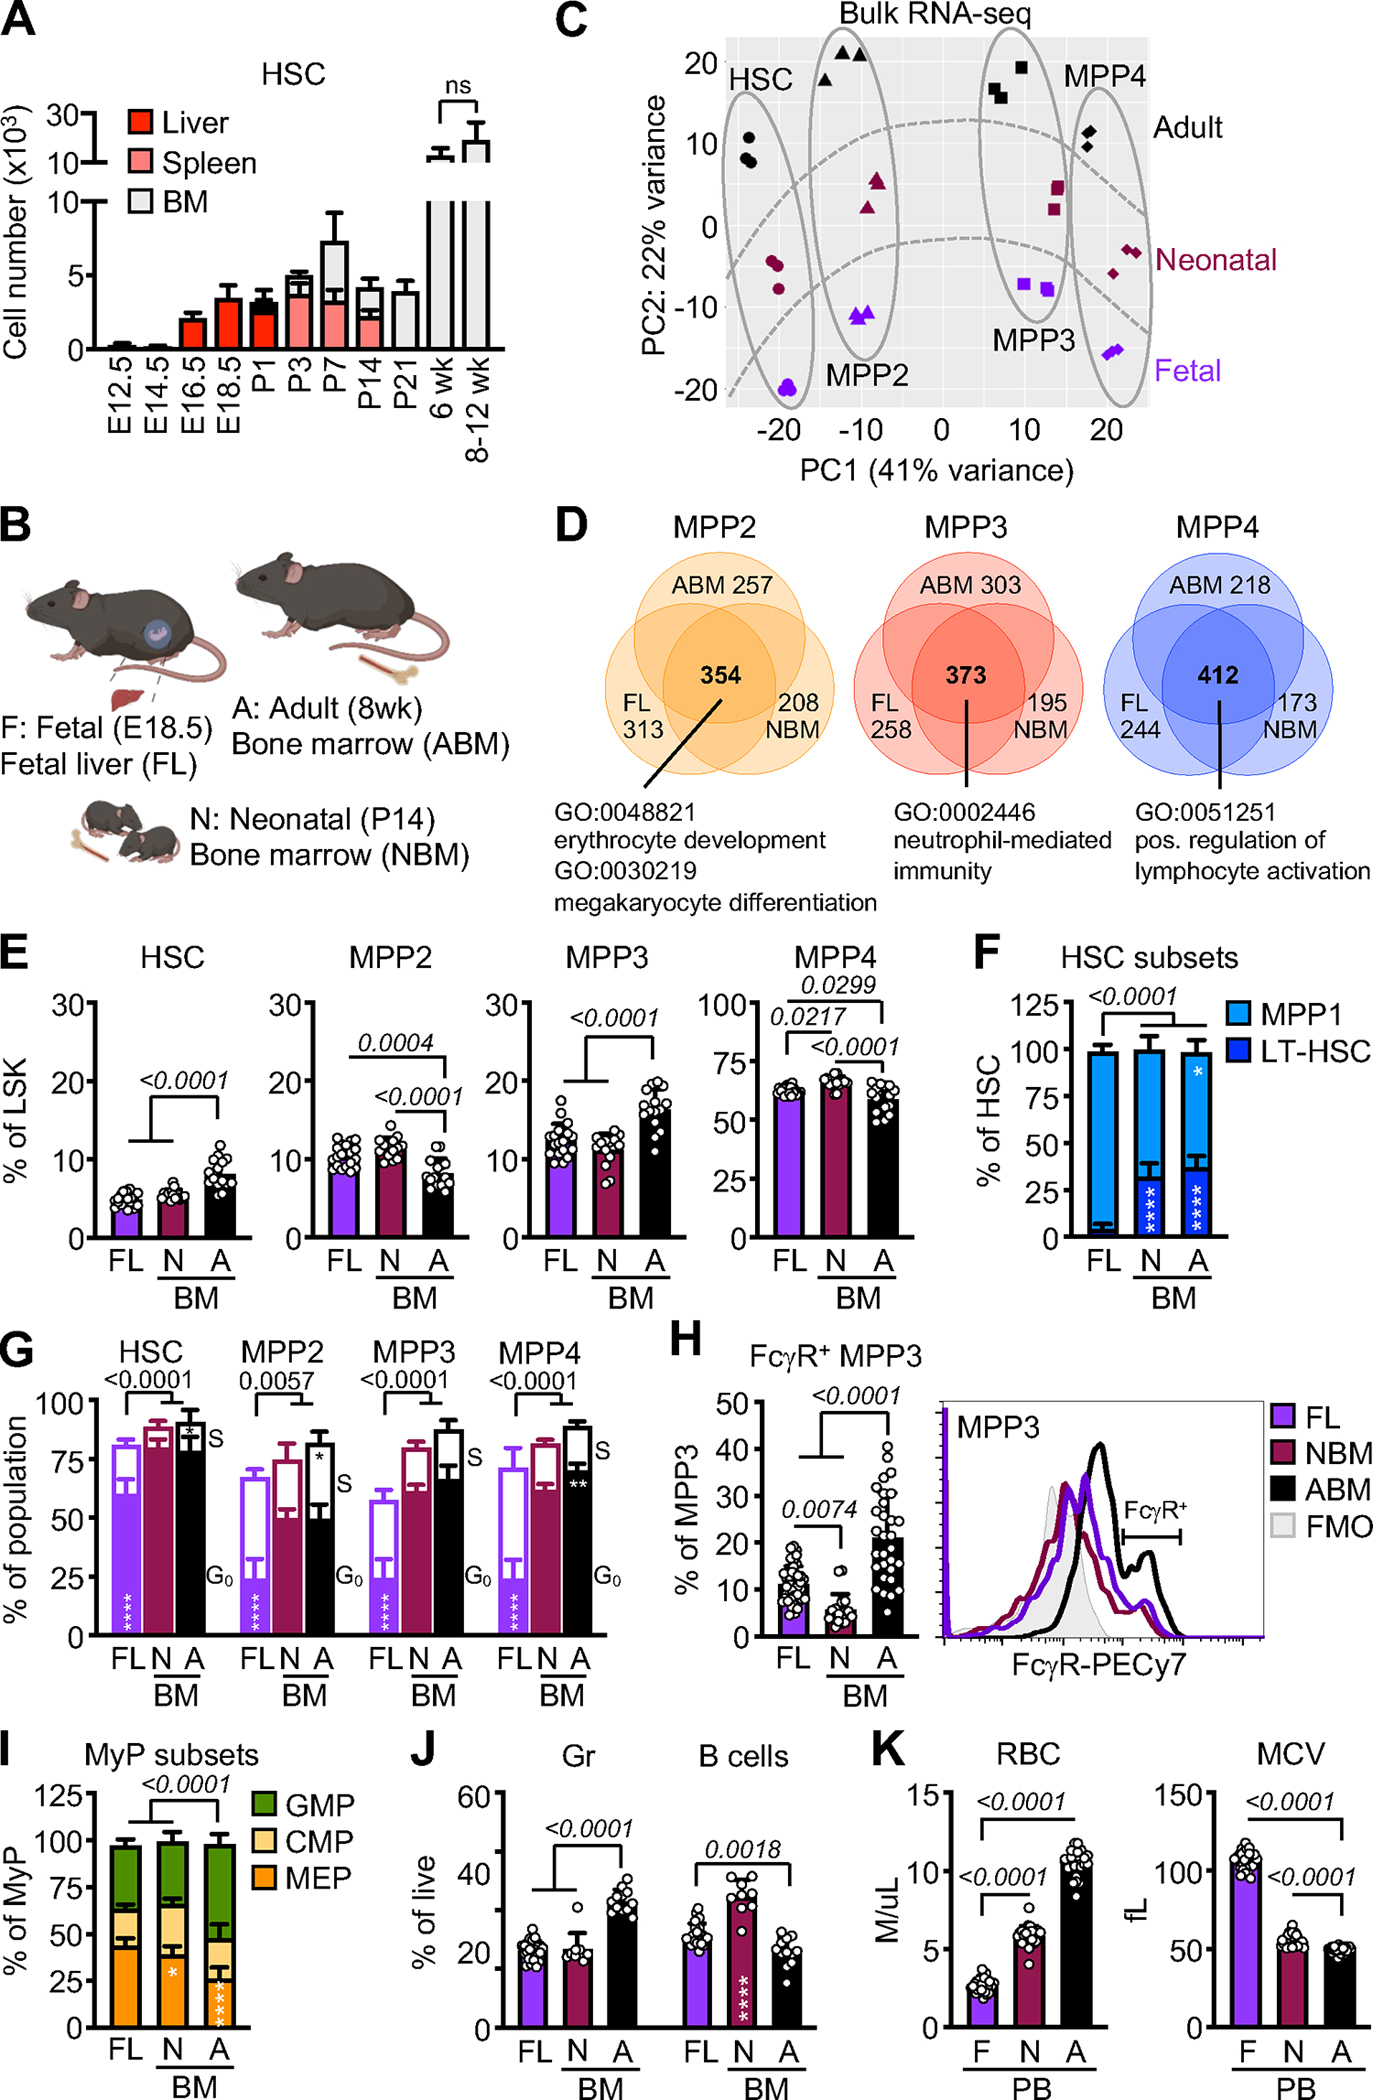
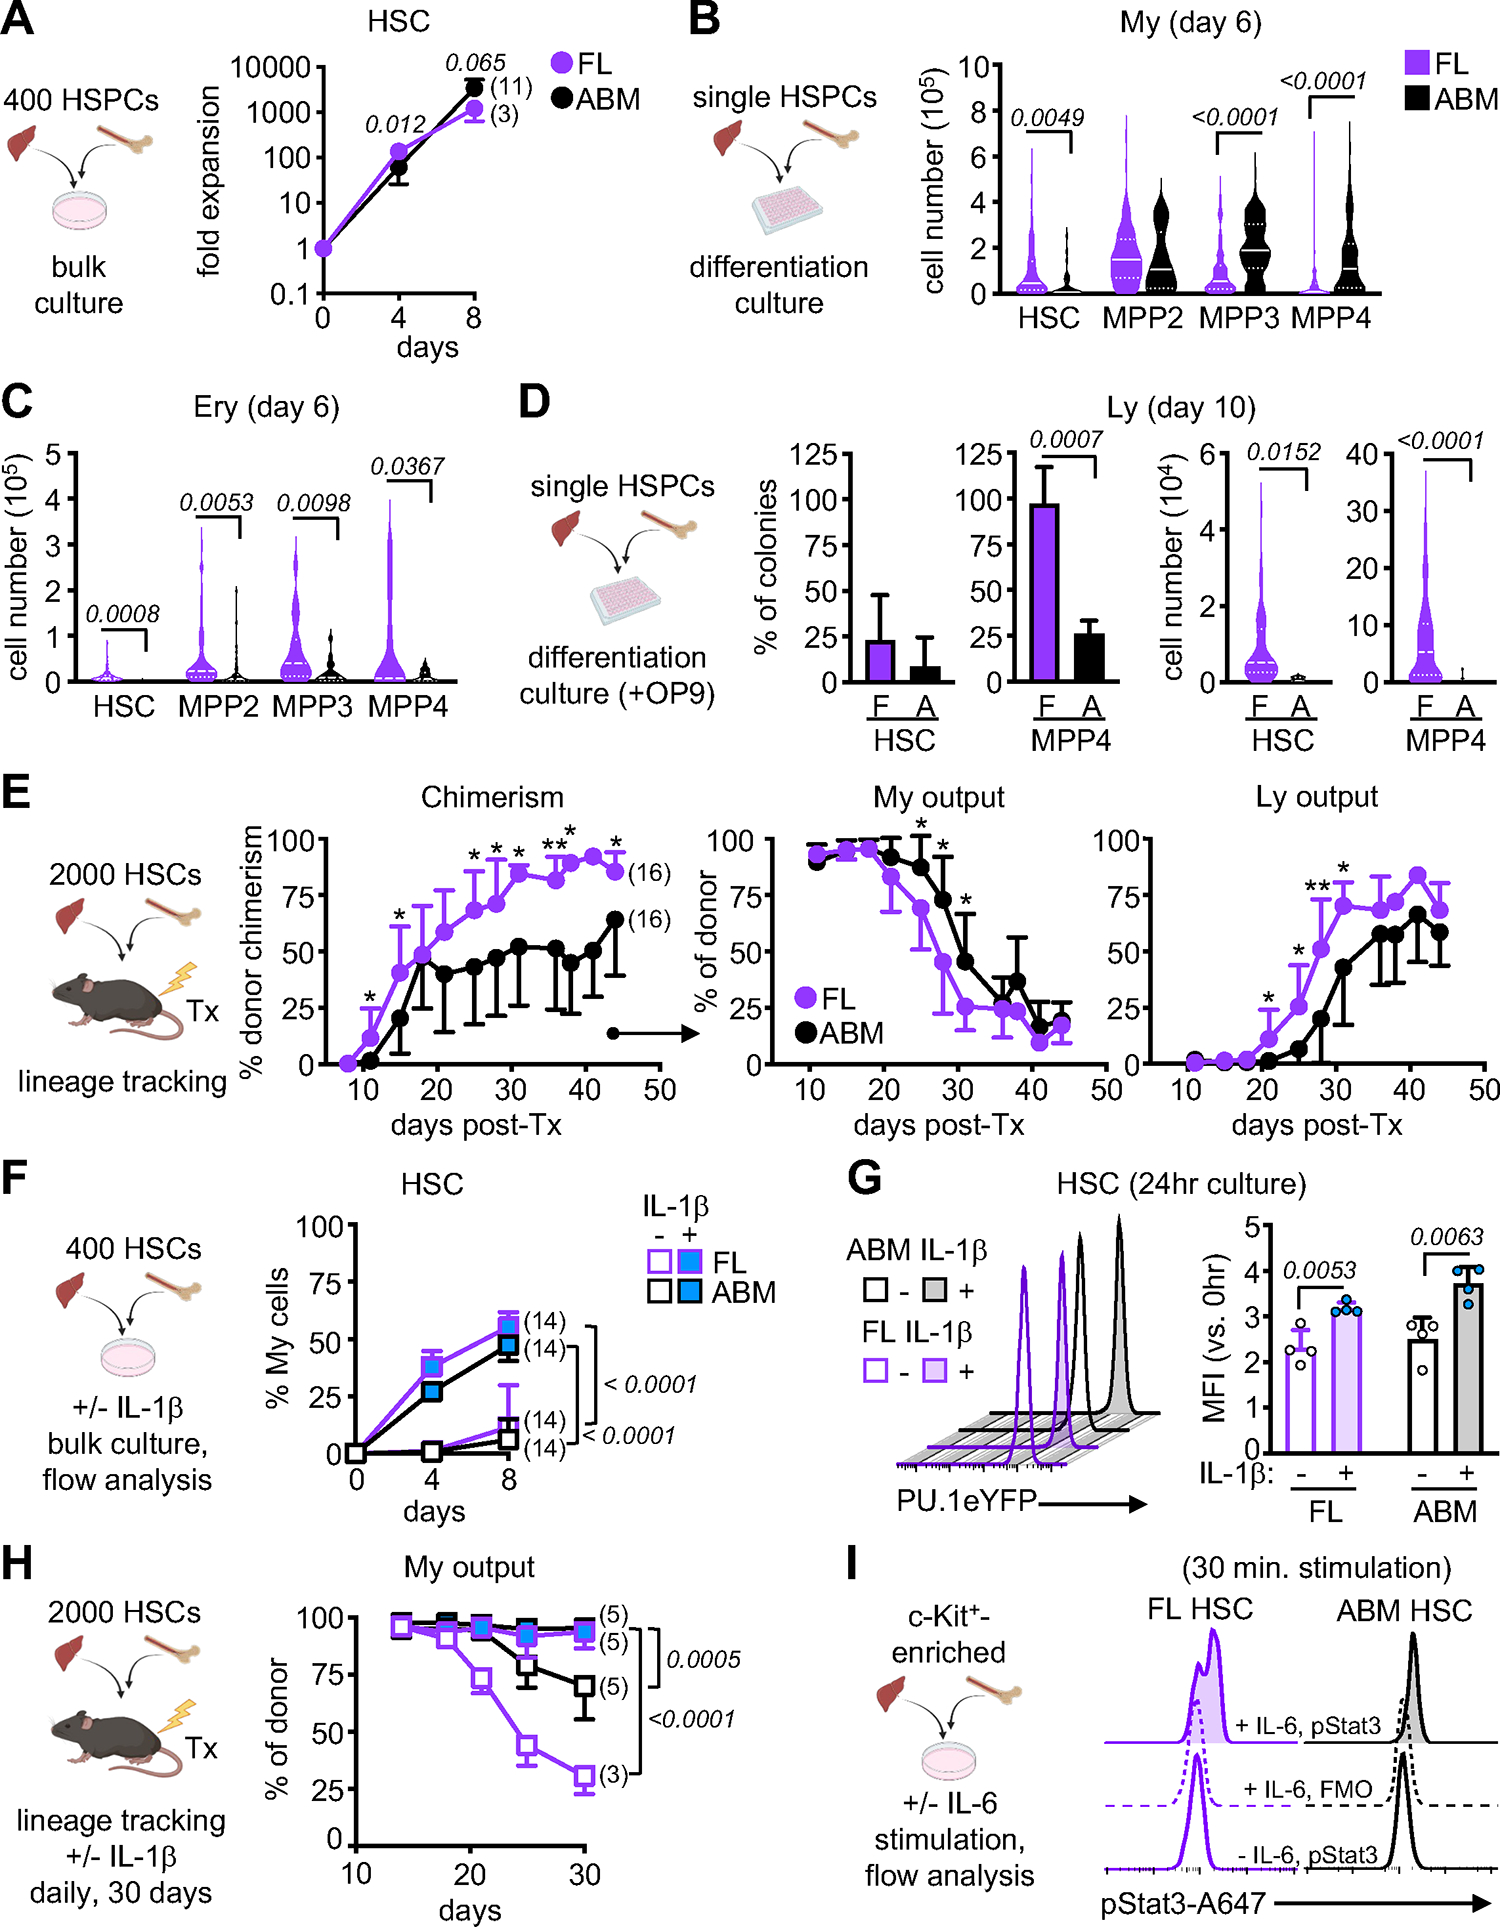
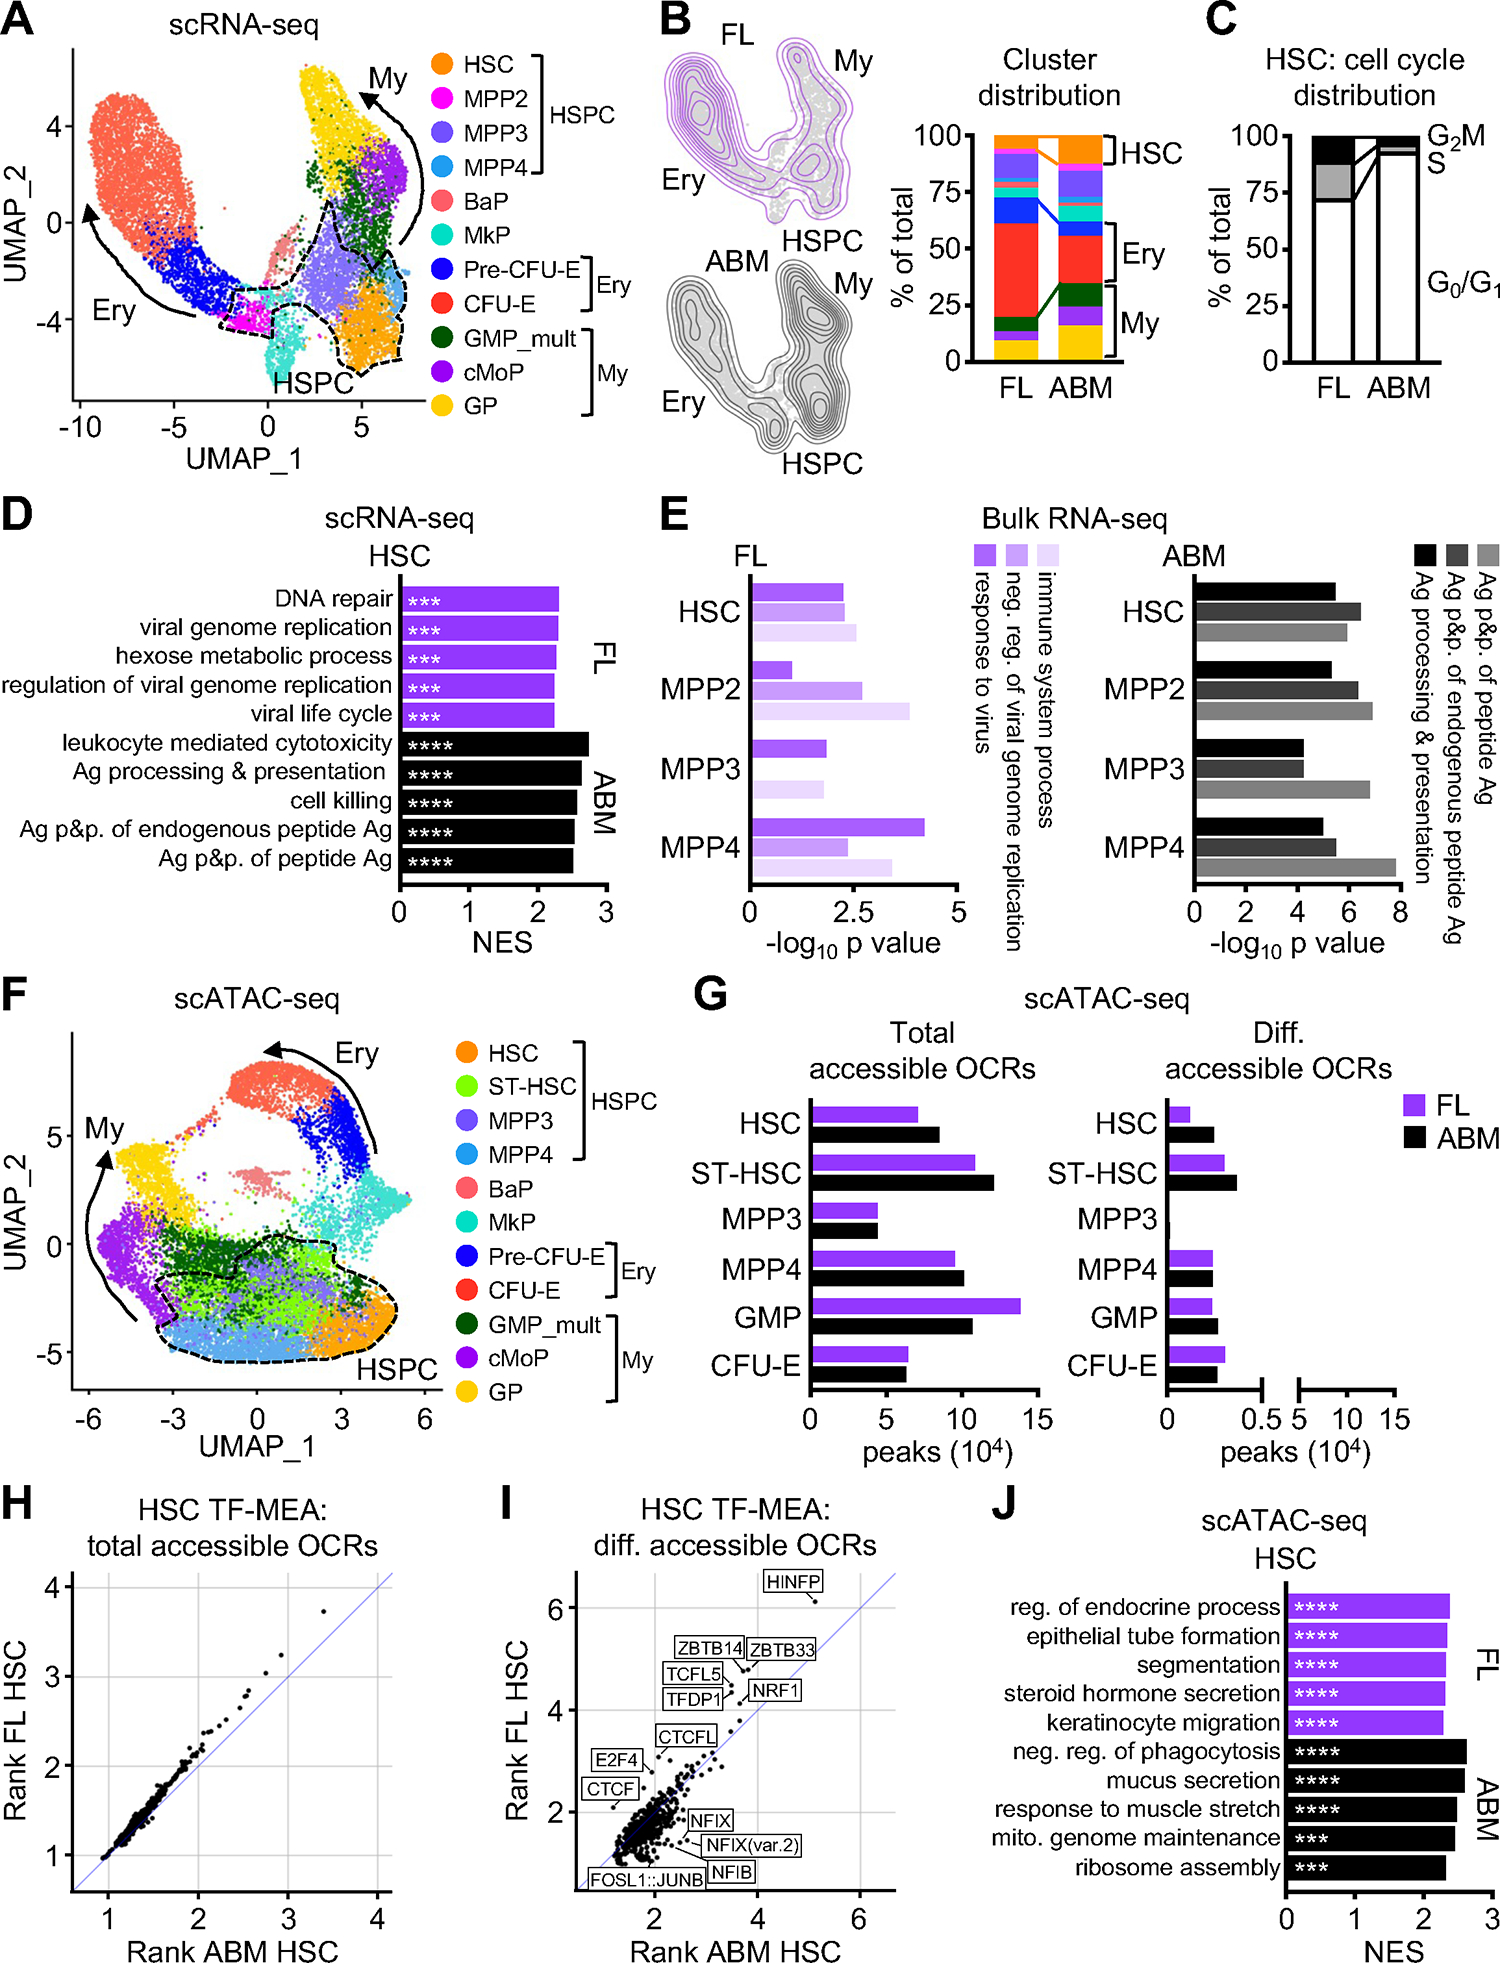
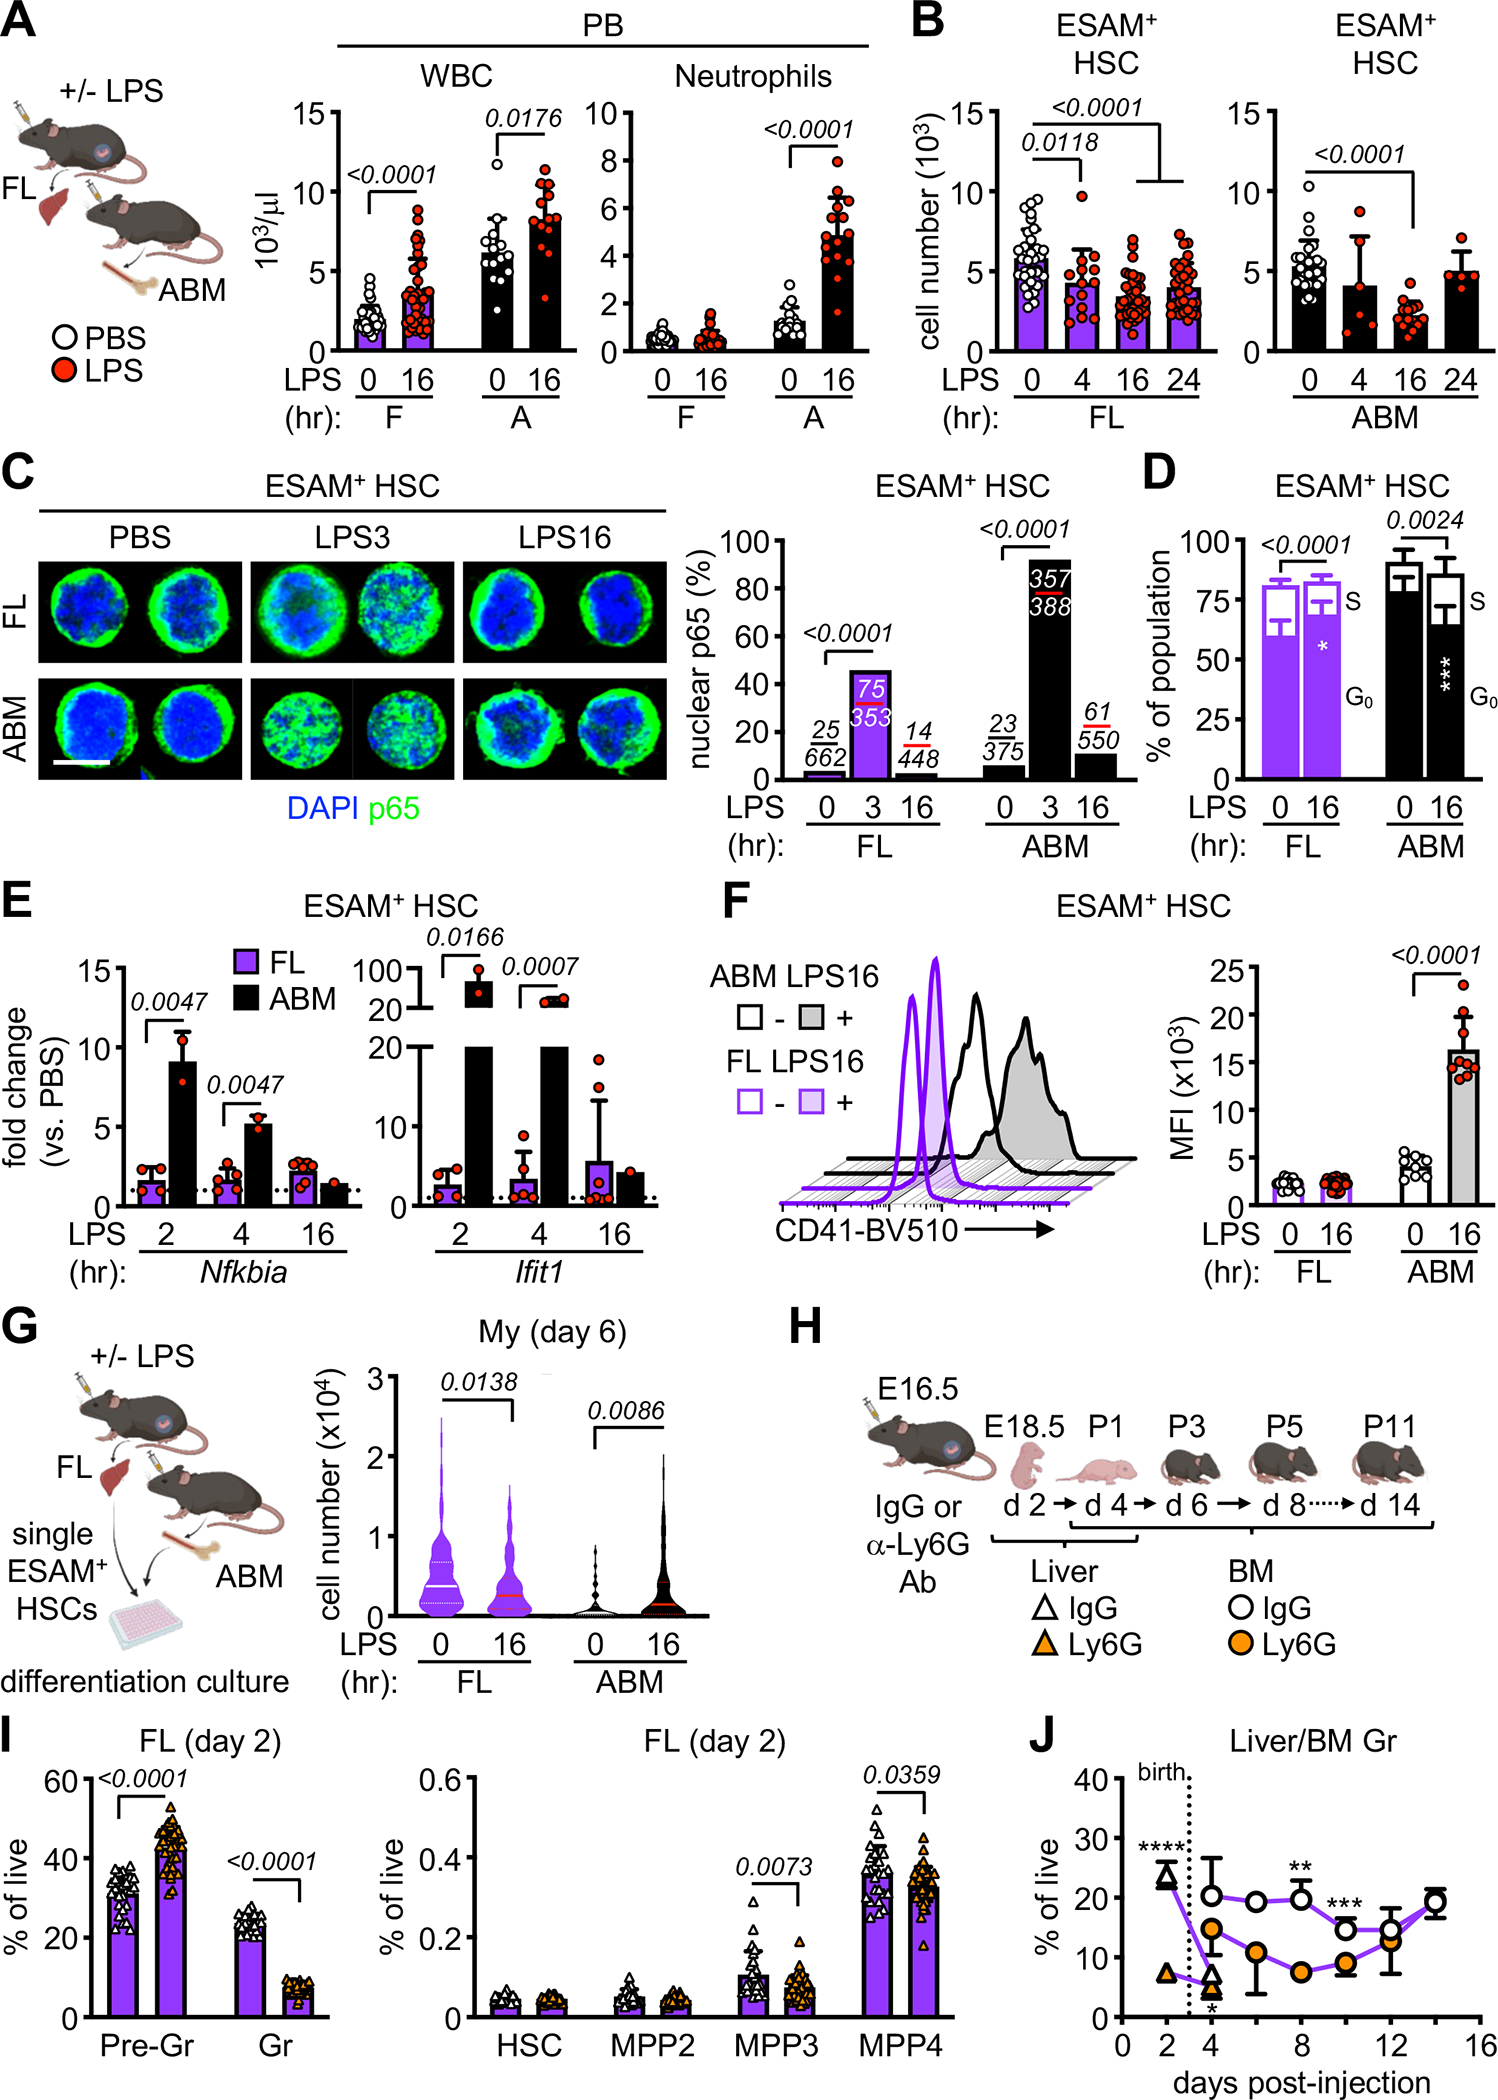
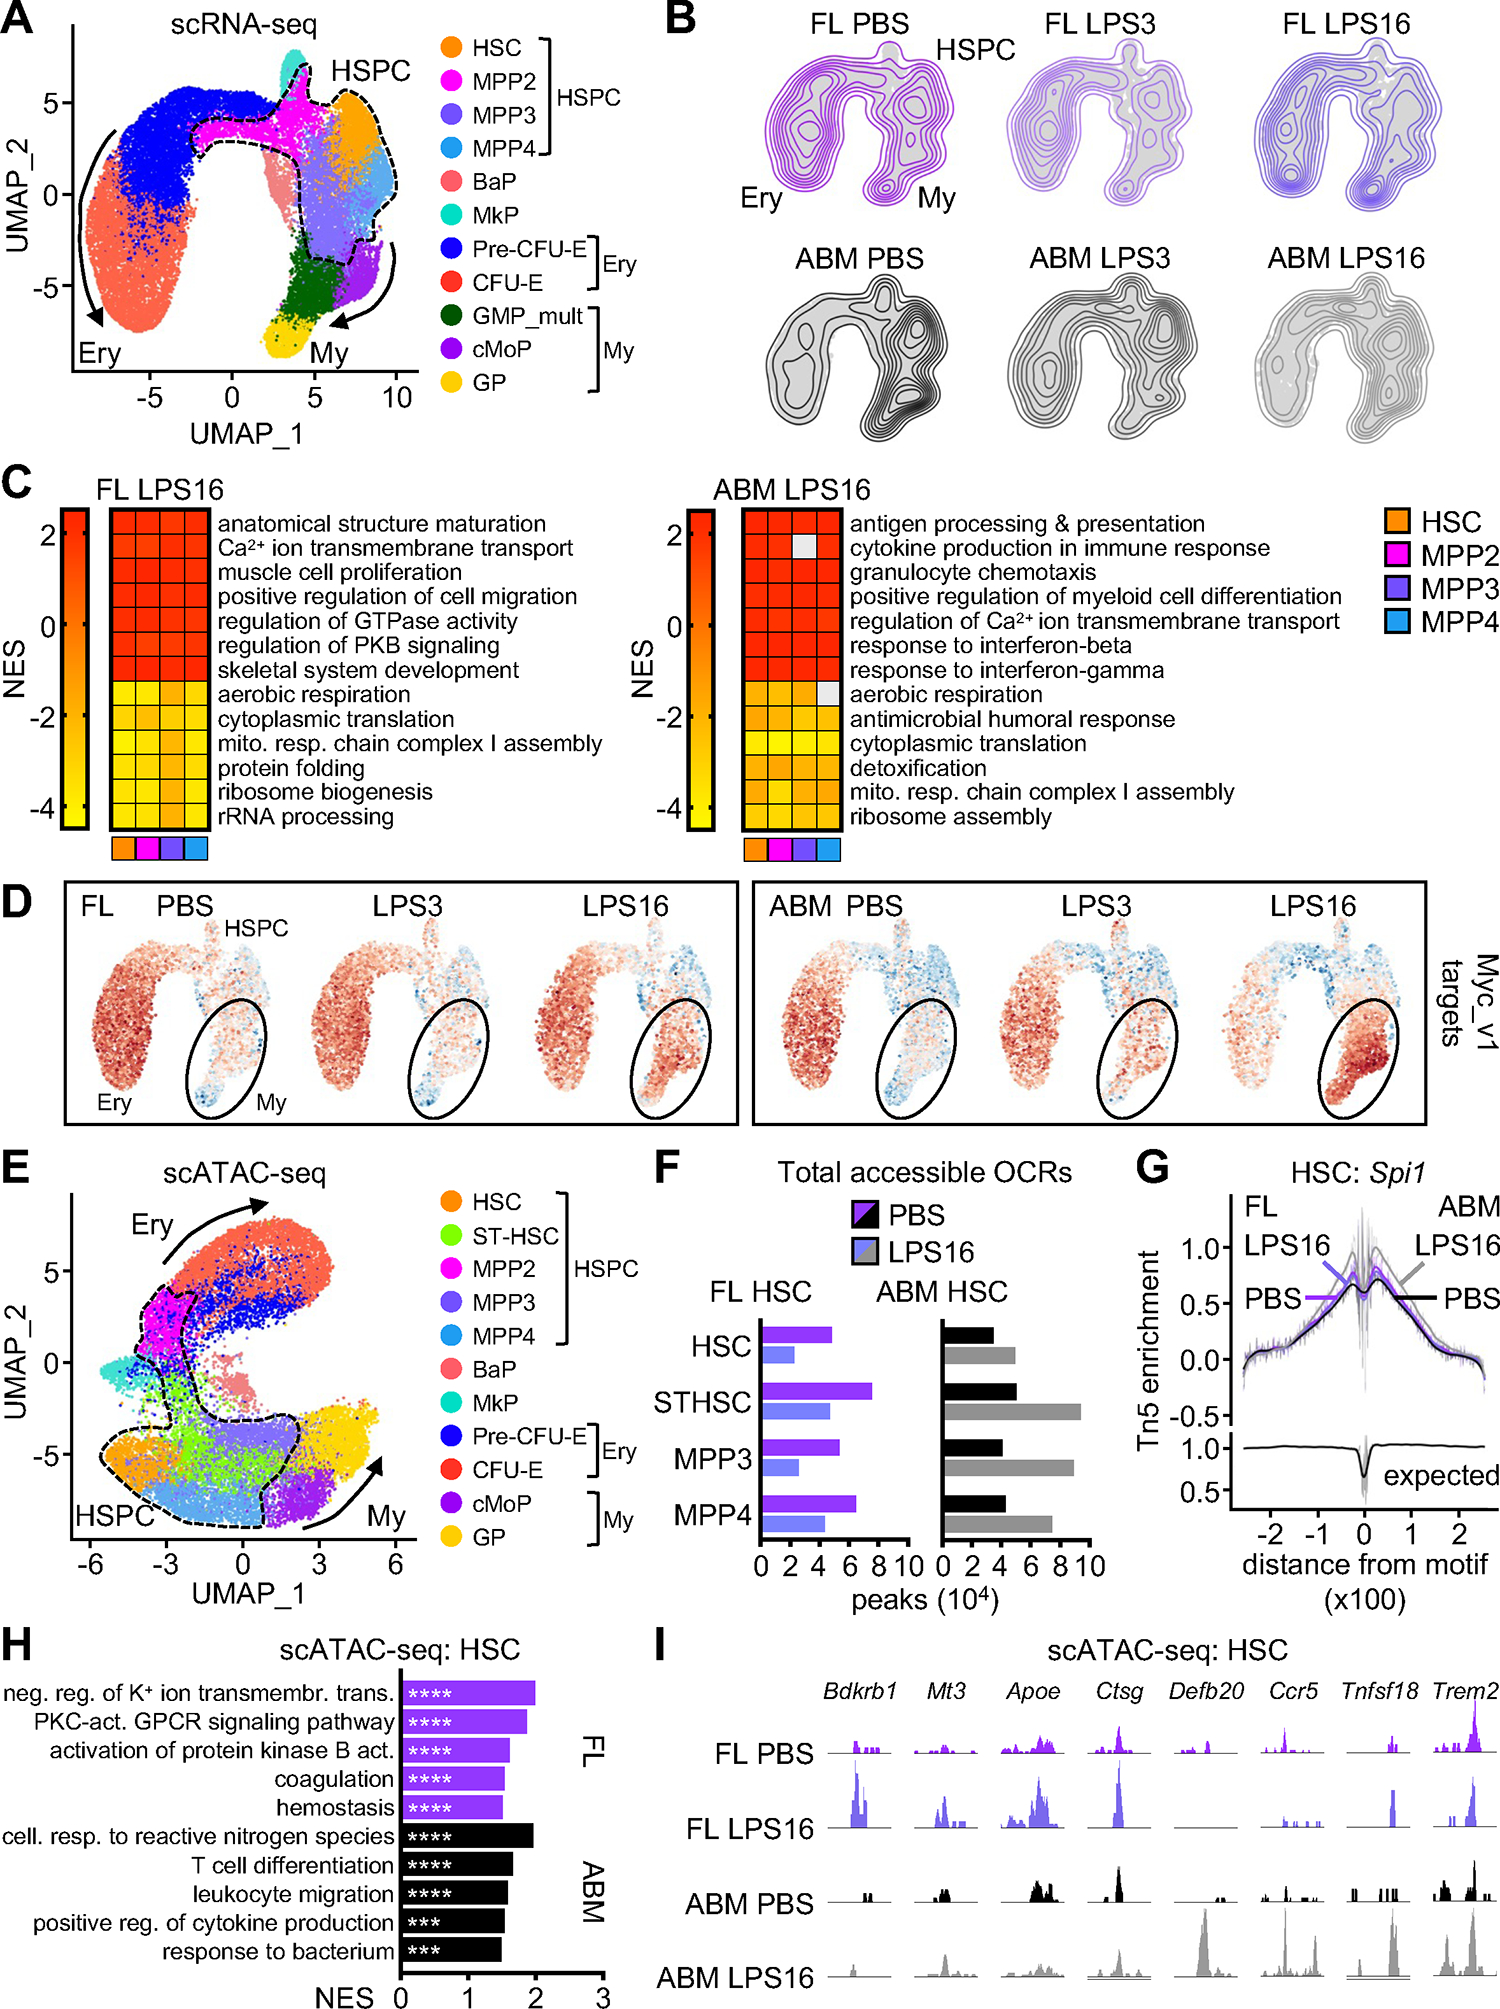
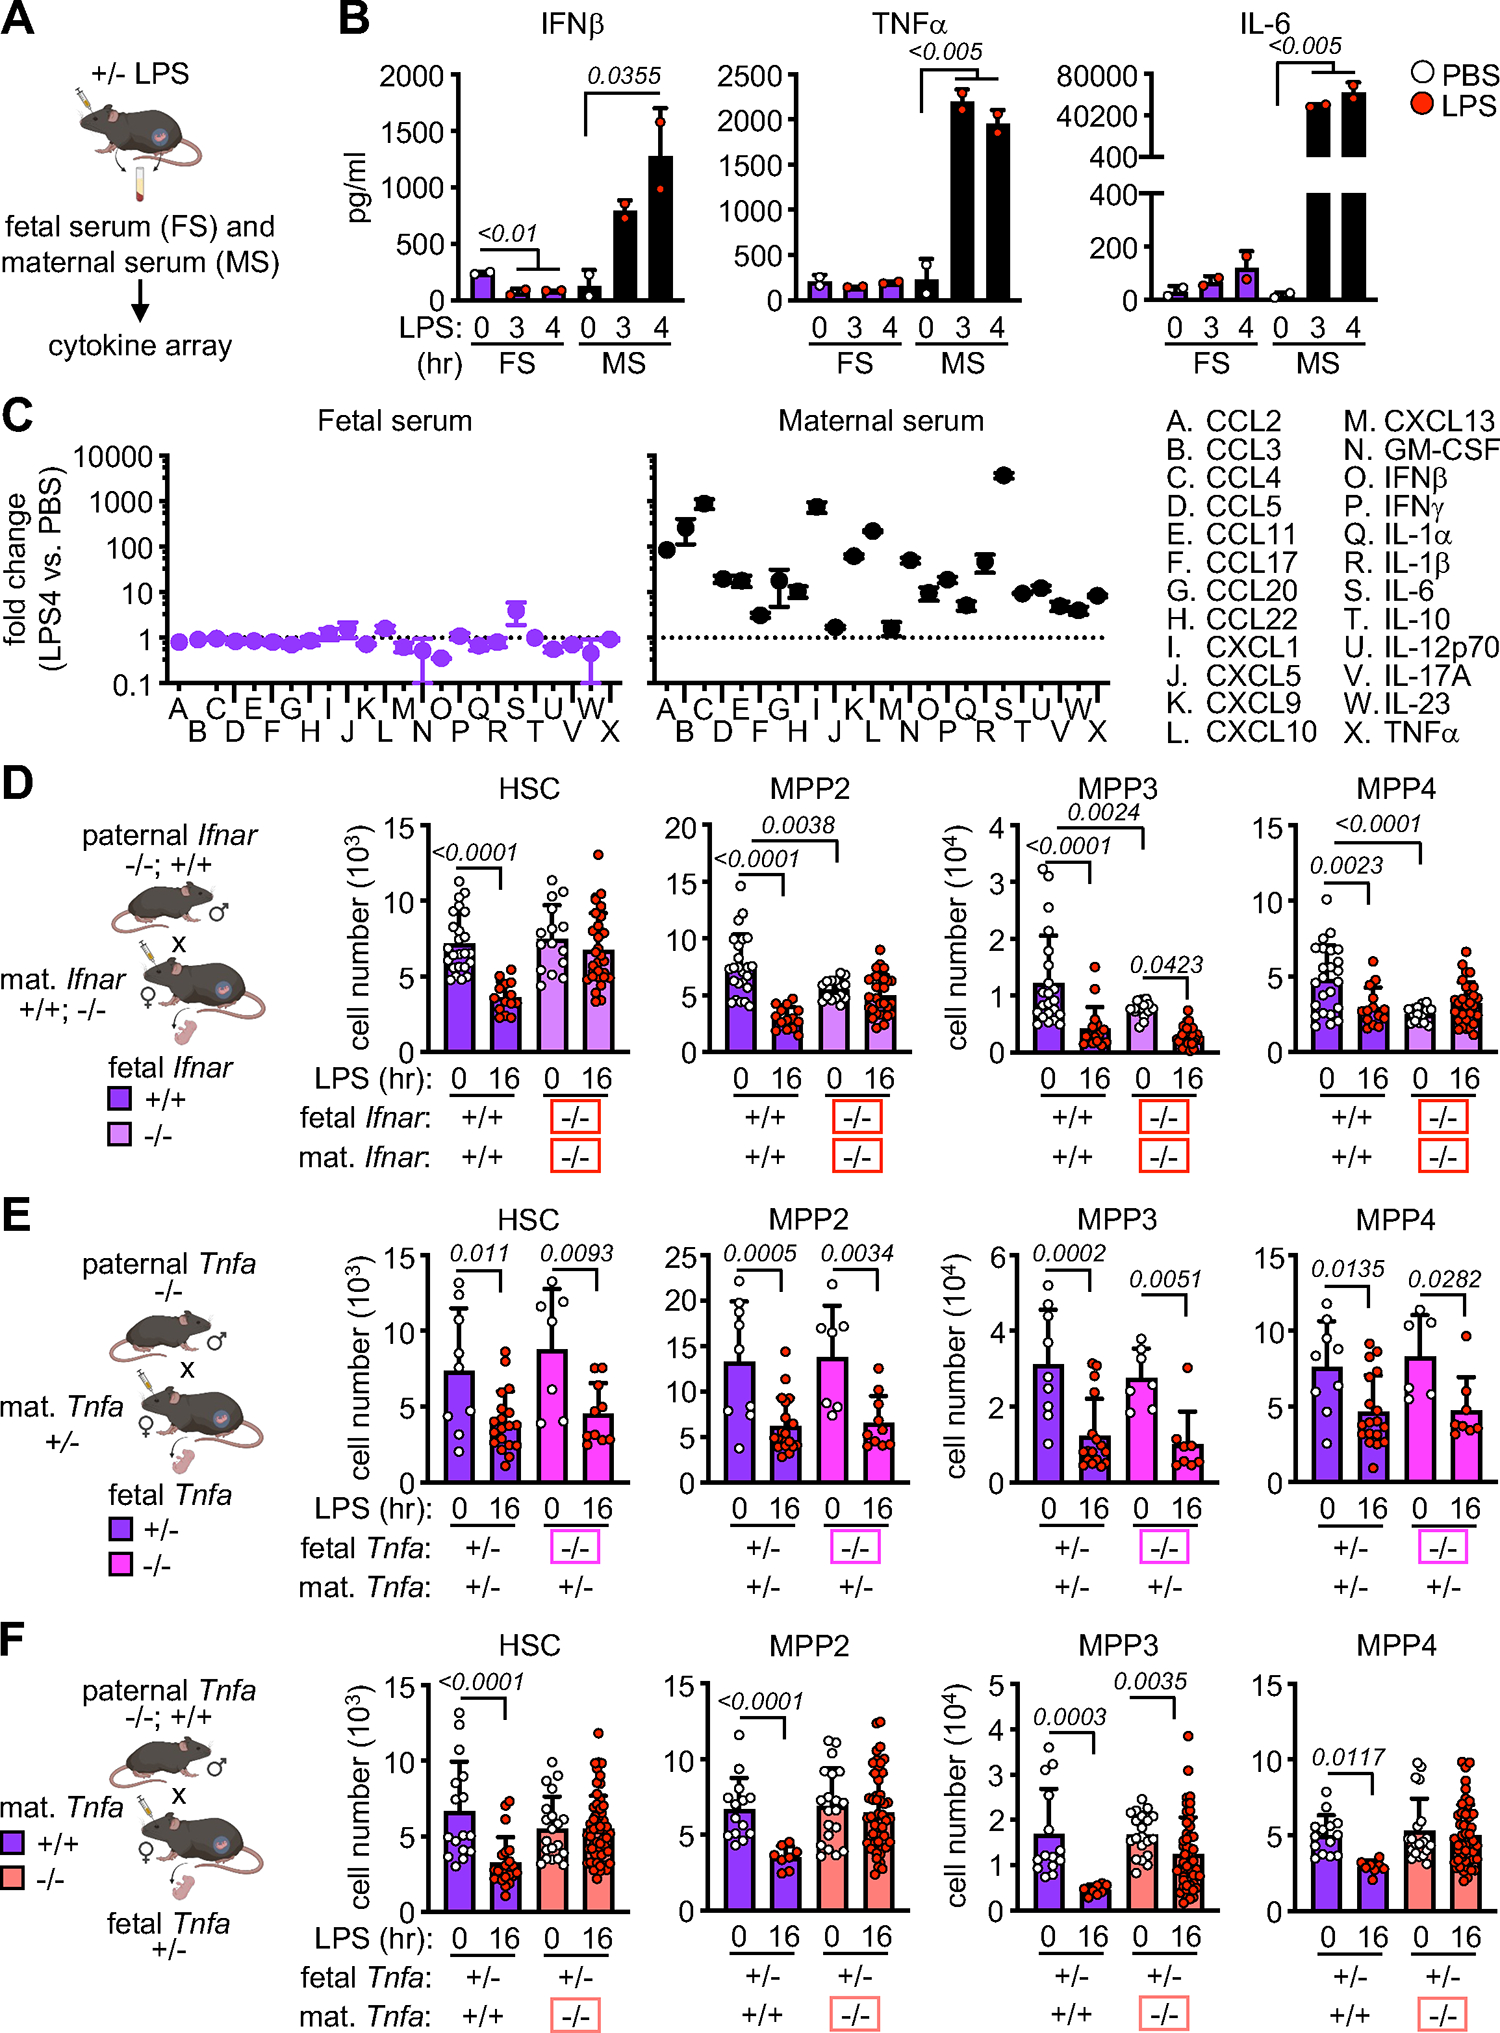
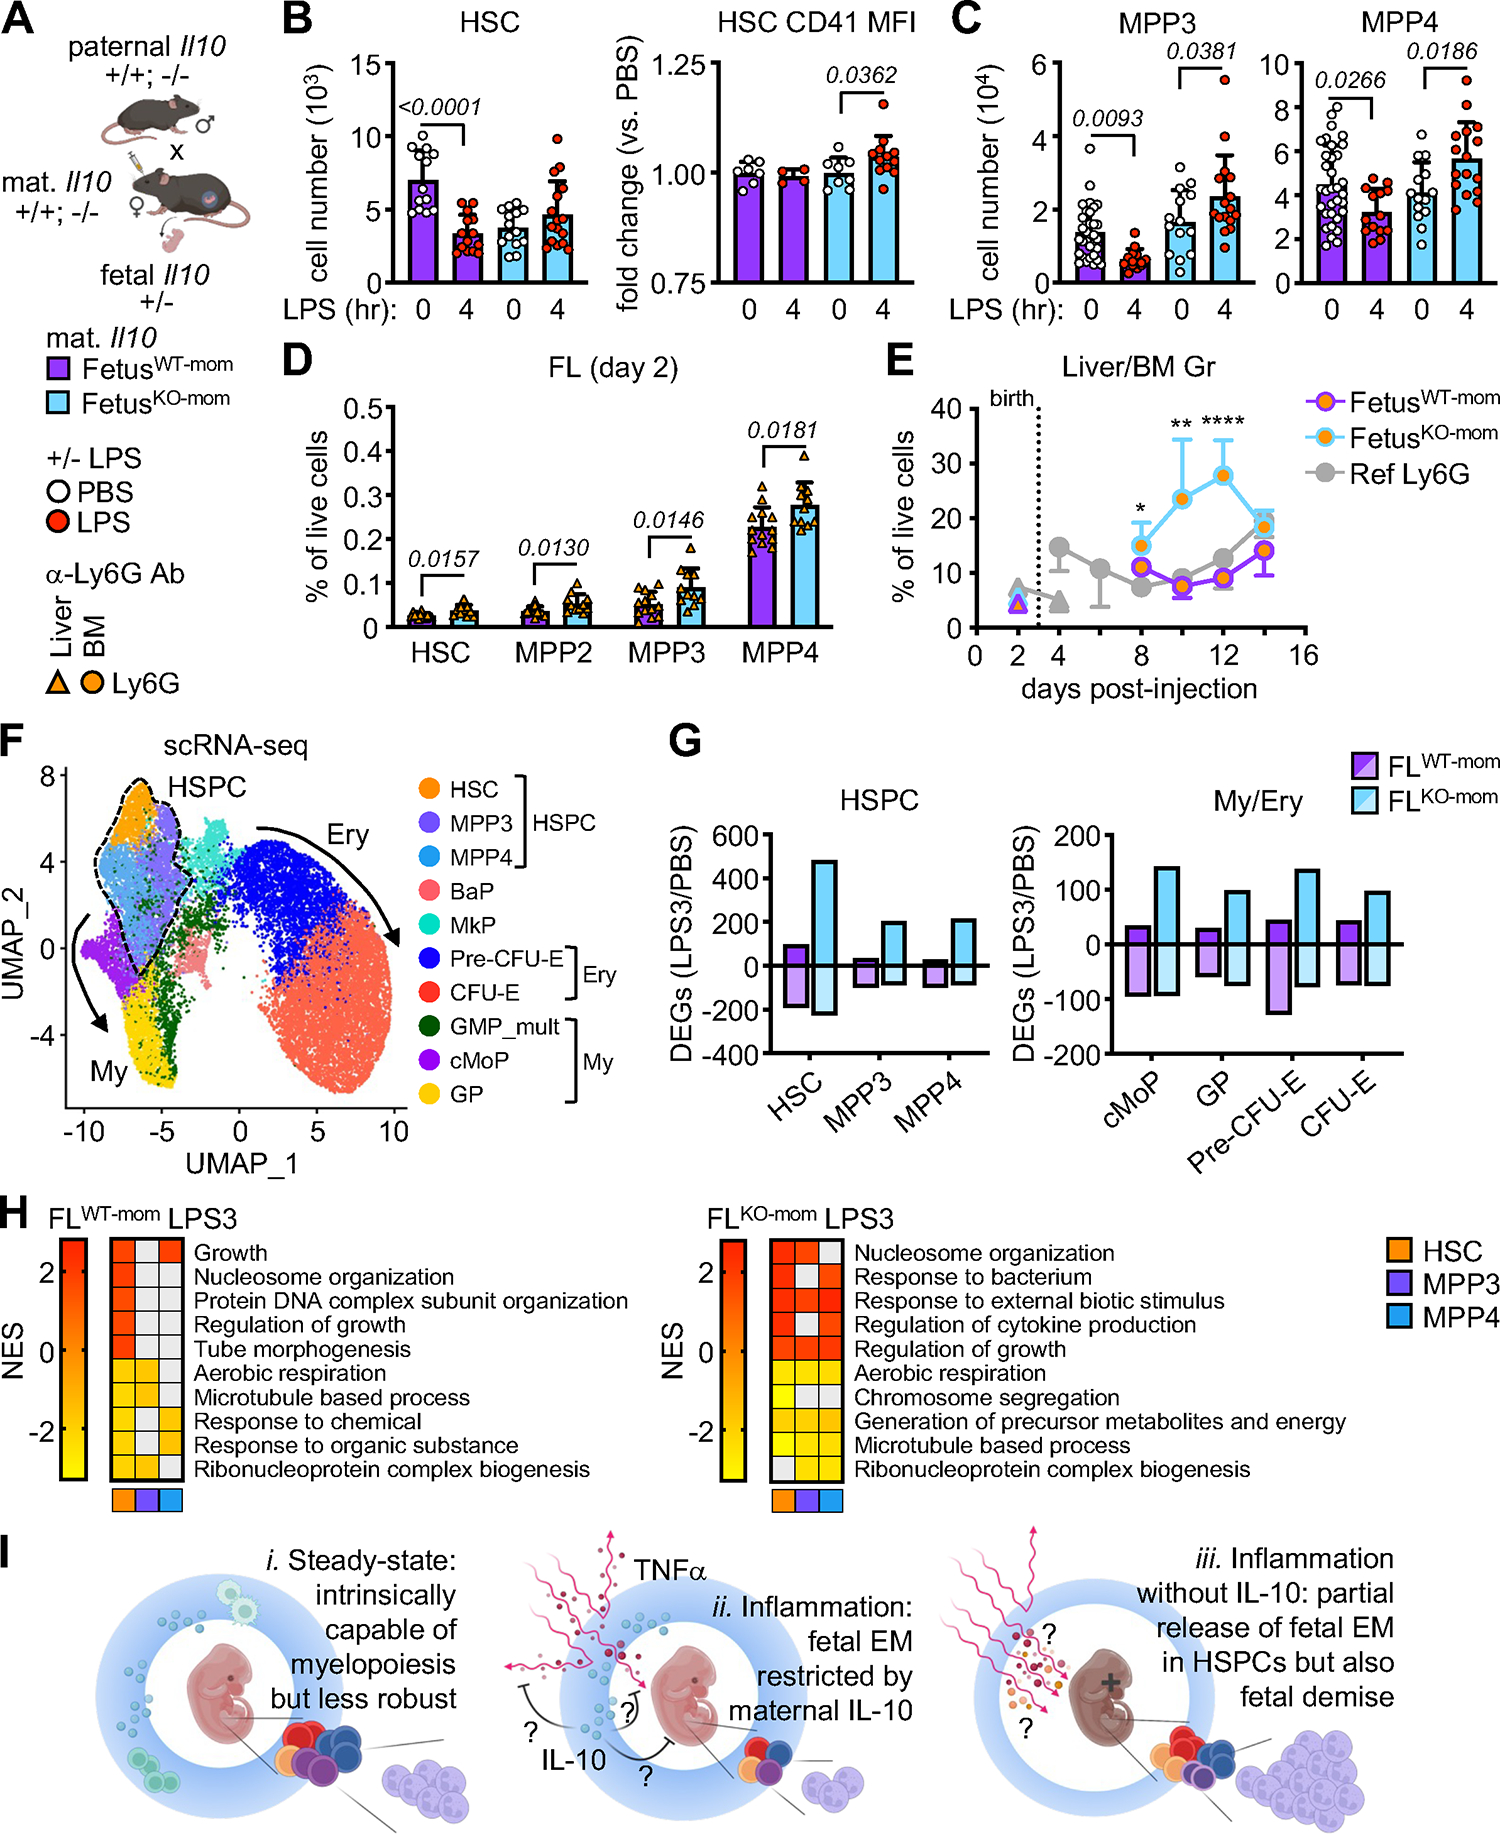
Neonates are highly susceptible to inflammation and infection. Here, we investigate how late fetal liver (FL) mouse hematopoietic stem and progenitor cells (HSPCs) respond to inflammation, testing the hypothesis that deficits in the engagement of emergency myelopoiesis (EM) pathways limit neutrophil output and contribute to perinatal neutropenia. We show that fetal HSPCs have limited production of myeloid cells at steady state and fail to activate a classical adult-like EM transcriptional program. Moreover, we find that fetal HSPCs can respond to EM-inducing inflammatory stimuli in vitro but are restricted by maternal anti-inflammatory factors, primarily interleukin-10 (IL-10), from activating EM pathways in utero. Accordingly, we demonstrate that the loss of maternal IL-10 restores EM activation in fetal HSPCs but at the cost of fetal demise. These results reveal the evolutionary trade-off inherent in maternal anti-inflammatory responses that maintain pregnancy but render the fetus unresponsive to EM activation signals and susceptible to infection.

Keywords: developmental hematopoiesis; emergency myelopoiesis; fetus; hematopoietic stem cells; interleukin-10; maternal-fetal crosstalk; multipotent progenitors; neonate; neutropenia.


Conflict of interest statement

Declaration of interests The authors declare no competing interests.

Figures

Figure 1.
Figure 1.. Conserved lineage hierarchy in fetal and neonatal HSPCs.
A) HSC number in liver, spleen, or bone marrow (BM) of fetuses (F): E12.5 (6), E14.5 (13), E16.5 (7), and E18.5 (8); neonates (N): P1 (4), P3 (4), P7 (9), P14 (5), and P21 (5); and adult (A) mice: 6wk (6) and 8–12wk (7); wk, week. Results are from the number of biological repeat (individual mice) from at least 2 independent experiments. B) Schematic of selected fetal liver (FL), neonatal BM (NBM), and adult BM (ABM) timepoints. C) Principal component analysis of bulk RNA-seq of FL, NBM, and ABM HSPC populations. Results are from 3 independent sets of pooled fetuses, neonate, and adult mice, with all HSPC populations in a given replicate coming from the same pool. D) Venn diagrams showing the number of unique and shared differentially enriched genes (DEG, log2 FC > 1, FDR < 0.05) found at all ages in each MPP population compared to HSCs. Selected gene ontology (GO) pathways found enriched in shared DEGs are shown below. E) Frequency of the indicated HSPC populations within FL, NBM, and ABM LSK cells (3 independent experiments). F) Frequency of MPP1 and long-term HSC (LT-HSC) within FL, NBM, and ABM HSCs (3 independent experiments). G) G0 and S phase distribution in HSPCs as measured in Fucci2 cell cycle reporter mice of indicated ages (5 independent experiments). H) Frequency of FcγR+ MPP3 (left) and representative FACS plot of FcγR staining (right) on FL, NBM, and ABM MPP3 (3 independent experiments). I) Frequency of GMPs, CMPs, and MEPs within the FL, NBM, and ABM myeloid progenitors (MyP, Lin/c-Kit+/Sca-1) compartment (3 independent experiments). J) Frequency of mature granulocytes (Gr) and B cells in FL, NBM, and ABM (3 independent experiments). K) Red blood cell (RBC) and mean corpuscular volume (MCV) from complete blood cell (CBC) counts of fetal (F), neonate (N) and adult (A) peripheral blood (PB), (5 independent experiments). Data are means ± S.D.; *padj ≤ 0.05; **padj ≤ 0.01; ****padj ≤ 0.0001. Circles represent biological replicates (individual mice). See also Figure S1.
Figure 2.
Figure 2.. Fetal HSPCs have limited myeloid output.
A) Schematic of bulk liquid culture and fold expansion of FL and ABM HSCs (3 independent experiments). B-C) Schematic of single cell differentiation culture of FL and ABM HSPCs with cellularity of myeloid (My) (B) or erythroid (Ery) (C) colonies at day 6 (5 independent experiments with a range of 11–163 colonies counted per population). Data are shown as violin plots with median and quartiles. D) Schematic of OP9-supported single cell differentiation culture of FL (F) and ABM (A) HSC and MPP4 (left) with proportion (middle) and cellularity (right) of lymphoid (Ly) colonies at day 10 (3 independent experiments with a range of 8–215 colonies counted per population). Cellularity data are shown as violin plots with median and quartiles. E) Schematic of lineage tracking transplantation (Tx) of FL and ABM HSCs in sub-lethally irradiated recipients with percent chimerism (left), and donor-derived myeloid (middle) and lymphoid (right) output in peripheral blood at the indicated days post-transplantation (4 independent experiments). F) Schematic of bulk liquid culture of FL or ABM HSCs with or without (+/−) IL-1β (25 ng/ml) and percent of FcγR+/Mac-1+ myeloid cells quantified by flow cytometry over time (3 independent experiments). G) Representative FACS histograms (left) and quantification (right) of YFP mean fluorescence intensity (MFI) of FL and ABM HSCs isolated from PU.1-eYFP reporter mice and cultured for 24 hours (hr) +/− IL-1β (4 independent experiments). H) Schematic of lineage tracking transplantation of FL and ABM HSCs in recipient mice injected daily +/− IL-1β (0.5 μg) with myeloid output in peripheral blood at the indicated times post-transplantation (1 independent experiment). I) Schematic of bulk liquid culture of FL or ABM HSCs +/− IL-6 (50 ng/ml) and representative FACS histograms of phospho-Stat3 fluorescence after 30 minutes (min) stimulation (2 independent experiments); FMO, fluorescence minus one. Mean MFI ± SD are: FL [−IL-6] 6466 ± 3538, [+IL-6/FMO] 6234 ± 3341, [+IL-6] 14843 ± 521; ABM [−IL-6] 7731 ± 3851, [+IL-6/FMO] 8136 ± 4758, [+IL-6] 14713 ± 4758. Data are means ± S.D. except for (B, C, and part of D); *padj ≤ 0.05; **padj ≤ 0.01. Number of biological replicates and transplanted mice are indicated either in parentheses or with individual circles. See also Figure S2.
Figure 3.
Figure 3.. Similar transcriptional landscape in fetal and adult HSPCs.
A) scRNA-seq UMAP of integrated FL and ABM Lin/c-Kit+ (LK) cells with clusters identified by marker genes. Results are from a set of pooled fetuses and adult mice and include 4,909 FL and 7,304 ABM LK cells. B) Density projection of cells on UMAPs (left) and distribution of clusters (right) from FL and ABM scRNA-seq. C) Cell cycle distribution in HSC cluster from FL and ABM scRNA-seq. D) Top 5 pathways differentially enriched in HSC cluster from FL and ABM scRNA-seq (GSEA on DEGs; log2 FC > 1, FDR < 0.05); Ag, antigen; p&p., processing and presentation. E) Top 3 pathways differentially enriched in FL (left) vs. ABM (right) HSPC bulk RNA-seq (GO/DAVID analyses on DEGs; log2 FC > 1, FDR < 0.05). F) scATAC-seq UMAP of integrated FL and ABM LK plus Lin/Sca-1+/c-Kit+ (LSK) cells with clusters identified by marker genes. Results are from a set of pooled fetuses and adult mice and include 6,704 FL and 8,288 ABM LK+LSK cells. G) Number of total (left) and differentially (diff., right) accessible open chromatin regions (OCRs; min.pct 0.05, log2FC > 0.25, padj < 0.05) found in the indicated clusters from FL and ABM scATAC-seq. H) Transcription factor motif enrichment analysis (TF-MEA) found in total accessible OCRs in FL and ABM HSC clusters. I) TF-MEA found in differentially accessible OCRs in FL and ABM HSC clusters. J) Top 5 pathways driven by genes closest to OCRs found differentially enriched in HSC cluster from FL and ABM scATAC-seq (GSEA on differentially accessible ORCs); neg., negative; mito., mitochondrial. ***padj ≤ 0.001; ****padj ≤ 0.0001. See also Figure S3.
Figure 4.
Figure 4.. Fetal HSPCs do not engage in emergency myelopoiesis in vivo.
A) Schematic of in vivo LPS (100 μg/kg/mouse) experiments with white blood cell (WBC) (left) and neutrophil (right) counts from CBC of PB from LPS-exposed fetal (F) and adult (A) mice (5 independent experiments); hr, hour. B) Quantification of LPS-exposed FL (right) and ABM (left) ESAM+ HSCs (5 independent experiments). C) Representative images (left) and quantification (right) of nuclear p65 in LPS-exposed FL and ABM ESAM+ HSCs (scale bar, 4 μm). Number of cells scored with nuclear p65 vs. all cells counted are indicated over the corresponding bar graph (3 independent experiments). D) G0 and S phase distribution in LPS-exposed FL and ABM ESAM+ HSCs (2 independent experiments in Fucci2 cell cycle reporter mice). E) qRT-PCR expression of Nfkbia and Ifit1 in LPS-exposed FL and ABM ESAM+ HSCs (4 independent experiments). F) Representative FACS histograms (left) and quantification (right) of CD41 MFI on LPS-exposed ESAM+ HSCs (5 independent experiments). G) Schematic of single cell differentiation culture of LPS-exposed FL and ABM ESAM+ HSCs with cellularity of myeloid (My) colonies at day 6 (3 independent experiments with a range of 37–140 colonies counted per population). Data are shown as violin plots with median and quartiles. H) Schematic of IgG or anti-Ly6G antibody injection (0.1 mg/mouse) with time-course of analysis in fetal/neonatal mice. I) Quantification of myeloid cells (left) and HSPCs (right) in FL 2 days after IgG or anti-Ly6G exposure (at least 2 independent experiments); Pre-Gr, pre-granulocyte (Mac-1+/Gr-1int); Gr, granulocyte (Mac-1+/Gr-1+). J) Quantification of granulocytes in the liver (triangles) and BM (circles) of fetal/neonatal mice exposed to IgG or anti-Ly6G during development (at least 2 independent experiments; see Table S1). Dotted line indicates birth. Data are means ± S.D. except for (G); **padj ≤ 0.01; ***padj ≤ 0.001; ****padj ≤ 0.0001. Number of biological replicates and treated fetuses/mice are indicated either in parentheses or with individual circles. See also Figure S4 and Table S1.
Figure 5.
Figure 5.. Molecular analysis confirms lack of EM pathway activation from fetal HSPCs.
A) scRNA-seq UMAP of integrated FL and ABM Lin/c-Kit+ (LK) cells isolated from mice exposed to PBS or LPS for 3 (LPS3) or 16 (LPS16) hours with clusters identified by marker genes. Results are from a set of pooled fetuses and adult mice and include 13,995 FL (PBS: 4,947; LPS3: 5,313; LPS16: 3,735) and 15,671 ABM (PBS: 7,181; LPS3: 4,644; LPS16: 3,846) LK cells. B) Density projection of cells on UMAPs from LPS-exposed FL and ABM scRNA-seq. C) Top pathways differentially enriched in FL (left) and ABM (right) HSPC clusters from 16 hours LPS-exposed FL and ABM scRNA-seq (GSEA on DEGs; log2 FC ± 0.25, min.pct 0.25). Grey boxes are pathways not meeting the padj < 0.05 cut-off; mito. resp., mitochondrial respiratory. D) Projection of module score derived from Hallmark “Myc_v1 targets” pathway onto LPS-exposed FL and ABM scRNA-seq UMAPs. E) scATAC-seq UMAP of integrated FL and ABM LK cells isolated from mice exposed to PBS or LPS for 16 hours with clusters identified by marker genes. Results are from a set of pooled fetuses and adult mice and include 6,404 FL (PBS: 4,618; LPS16: 1,786) and 11,261 ABM (PBS: 4,768; LPS16: 6,493) LK cells. F) Total open chromatin regions (OCRs; min.pct 0.05, log2FC > 0.25, padj < 0.05) in HSC cluster of 16 hours LPS-exposed FL (left) and ABM (right) scATAC-seq. G) Transcription factor footprint of Spi1 in HSC cluster of 16 hours LPS-exposed FL and ABM scATAC-seq. H) Top 5 pathways driven by genes closest to OCRs found differentially enriched in HSC cluster from 16 hours LPS-exposed FL and ABM scATAC-seq (GSEA on differentially accessible ORCs; log2 FC ± 0.25, min.pct 0.25); neg., negative; reg., regulation; transmembr., transmembrane; trans., transport; act., activity; cell., cellular; resp., response. I) Examples of scATAC-seq Integrative Genomics Viewer (IGV) tracks in FL and ABM HSC cluster for genes associated with gained OCRs in response to 16 hours LPS exposure. ***padj ≤ 0.001; ****padj ≤ 0.0001. See also Figure S5.
Figure 6.
Figure 6.. External factors control fetal response to maternal inflammation.
A) Schematic of in vivo LPS exposure and collection of fetal serum (FS) and maternal serum (MS) in pregnant mice. B) Cytokine levels in paired fetal and maternal serum from mice exposed to LPS for 3 hours and 4 hours. Circles represent the mean of 2 technical replicates (2 independent experiments). Fetal serum is pooled from all fetuses in the litter (average 5 to 8 fetuses per litter). C) Fold change in cytokine/chemokine level in paired fetal (left) and maternal (right) serum from mice exposed to LPS for 4 hours (2 independent experiments). D) Schematic of Ifnar time-mated pregnancies with quantification of FL HSPCs in LPS-exposed wild-type and Ifnar−/− fetuses carried by wild-type and Ifnar−/− dams (3 independent experiments); mat., maternal. Ifnar-deficient fetuses and dams are boxed in red. E) Schematic of Tnfa time-mated pregnancies with quantification of FL HSPCs in LPS-exposed Tnfa+/− and Tnfa−/− fetuses carried by Tnfa+/− dams (4 independent experiments). Tnfa-deficient fetuses are boxed in pink. F) Schematic of Tnfa time-mated pregnancies with quantification of FL HSPCs in LPS-exposed Tnfa+/− fetuses carried by Tnfa+/+ or Tnfa−/− dams (5 independent experiments). Tnfa-deficient dams are boxed in orange. Data are means ± S.D. Number of biological replicates and treated fetuses/mice are indicated with individual circles. See also Figure S6.
Figure 7.
Figure 7.. Maternal IL-10 restricts fetal response to inflammation.
A) Schematic of Il10 time-mated pregnancies with naming convention and treatments; fetusWT-mom, Il10+/− fetuses carried by wild-type dams; fetusKO-mom, Il10+/− fetuses carried by Il10−/− dams. B) Quantification of FL HSCs (left) and fold change of CD41 MFI on HSCs (right) in fetusWT-mom and fetusKO-mom mice exposed to LPS for 4 hours (6 independent experiments). C) Quantification of FL MPP3 (left) and MPP4 (right) in fetusWT-mom and fetusKO-mom mice exposed to LPS for 4 hours (6 independent experiments). D) Quantification of FL HSPCs 2 days after anti-Ly6G exposure in fetusWT-mom and fetusKO-mom mice (2 independent experiments). E) Quantification of granulocytes in the liver (triangles) and BM (circles) of fetal/neonatal fetusWT-mom and fetusKO-mom mice exposed to anti-Ly6G during development (at least 2 independent experiments; see Table S3). Dotted line indicates birth and grey line the reference production of granulocytes in Ly6G-treated WT dams. F) scRNA-seq UMAP of integrated FL LK cells isolated from fetusWT-mom and fetusKO-mom mice exposed to PBS or LPS for 3 hours with clusters identified by marker genes. Results are from a set of pooled fetuses and include 12,594 fetusWT-mom (PBS: 6,209; LPS3: 6,385) and 11,890 fetusKO-mom (PBS: 4,977; LPS3: 6,913) FL LK cells. G) Total number of DEGs in HSPC (left) and My/Ery (right) clusters from 3 hours LPS-exposed fetusWT-mom and fetusKO-mom FL scRNA-seq.. H) Top pathways differentially expressed in fetusWT-mom and fetusKO-mom HSPC clusters from 3 hours LPS-exposed FL scRNA-seq (GSEA on DEGs; log2 fold change +/− 0.25, min.pct 0.25). Grey boxes are pathways not meeting the padj < 0.05 cut-off. I) Model of shielding of fetal emergency myelopoiesis by the maternal anti-inflammatory milieu. At steady state (i.), fetal HSPCs are intrinsically capable of myelopoiesis but their myeloid cell output is less robust than that of adult HSPCs. In response to inflammation (ii.), fetal HSPCs fail to activate EM pathways, restricted by maternal IL-10. In the absence of maternal IL-10 (iii.), there is partial restoration of EM in fetal HSPCs at both a cellular and transcriptional level, but at the cost of fetal demise. Data are means ± S.D.; *p ≤ 0.05; **p ≤ 0.01; ****p ≤ 0.0001. Number of biological replicates and treated fetuses/mice are indicated with individual circles. See also Figure S7.

Update of

Similar articles

Cited by

References

    1. Laurenti E, and Göttgens B (2018). From haematopoietic stem cells to complex differentiation landscapes. Nature 553, 418–426. - PMC - PubMed
    1. Cabezas-Wallscheid N, Klimmeck D, Hansson J, Lipka DB, Reyes A, Wang Q, Weichenhan D, Lier A, von Paleske L, Renders S, et al. (2014). Identification of regulatory networks in HSCs and their immediate progeny via integrated proteome, transcriptome, and DNA methylome analysis. Cell Stem Cell. 15, 507–522. - PubMed
    1. Pietras EM, Reynaud D, Kang YA, Carlin D, Calero-Nieto FJ, Leavitt AD, Stuart JM, Göttgens B, and Passegué E (2015). Functionally Distinct Subsets of Lineage-Biased Multipotent Progenitors Control Blood Production in Normal and Regenerative Conditions. Cell Stem Cell. 17, 35–46. - PMC - PubMed
    1. Yamashita M, Dellorusso PV, Olson OC, and Passegué E (2020). Dysregulated hematopoietic stem cell behaviour in myeloid leukaemogenesis. Nat Rev Cancer. 20, 365–382. - PMC - PubMed
    1. Collins A, Mitchell CA, and Passegué E (2021). Inflammatory signaling regulates hematopoietic stem and progenitor cell development and homeostasis. J Exp Med. 218, e20201545. - PMC - PubMed