

Underdetected dispersal and extensive local transmission drove the 2022 mpox epidemic
- PMID: 38428425
- PMCID: PMC10962340
- DOI: 10.1016/j.cell.2024.02.003
Underdetected dispersal and extensive local transmission drove the 2022 mpox epidemic
Abstract
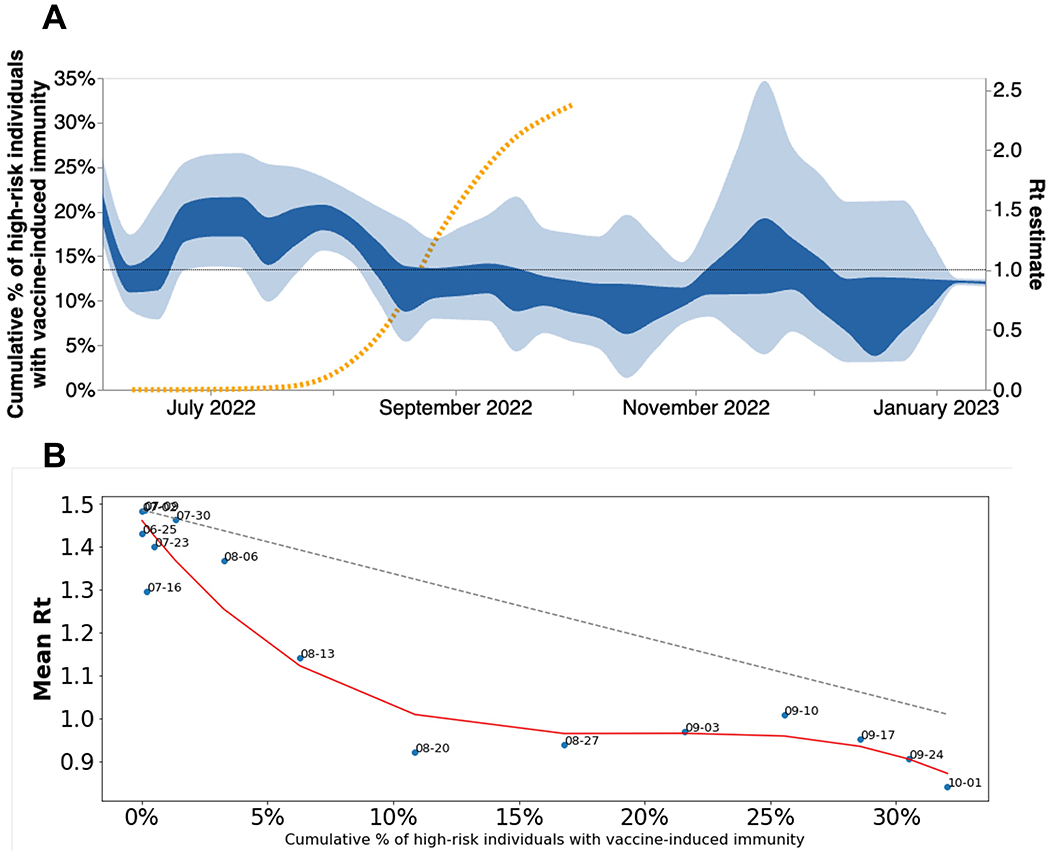
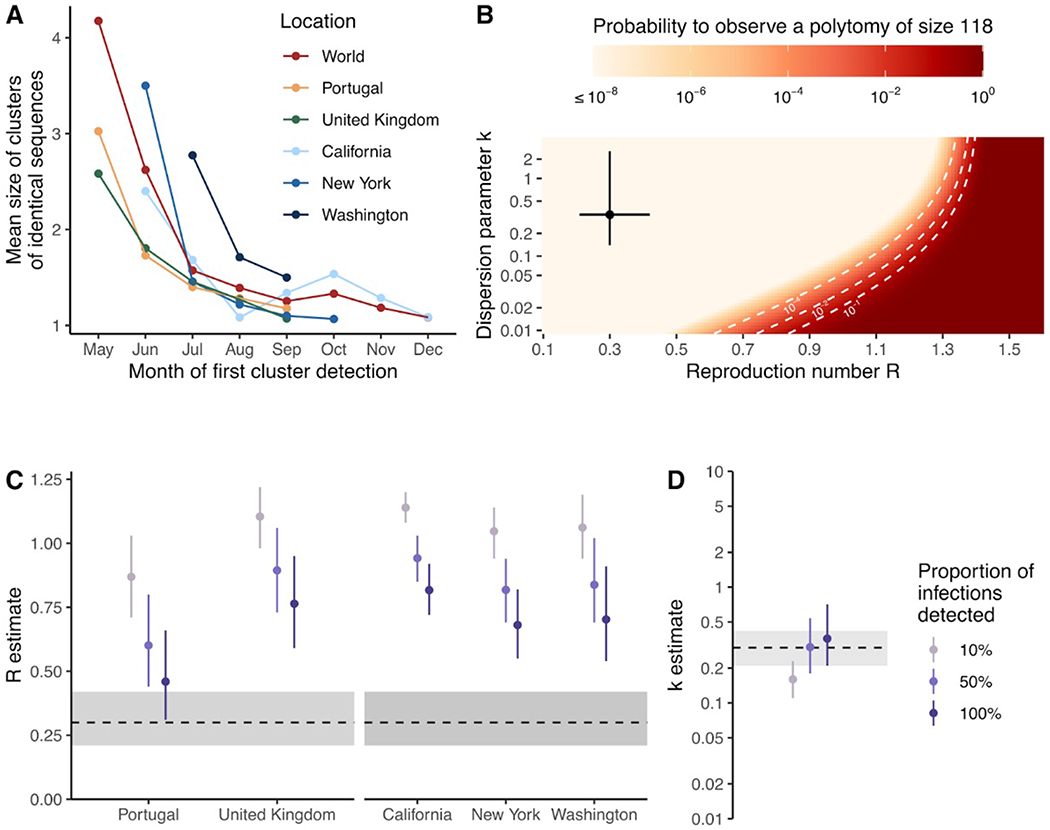
The World Health Organization declared mpox a public health emergency of international concern in July 2022. To investigate global mpox transmission and population-level changes associated with controlling spread, we built phylogeographic and phylodynamic models to analyze MPXV genomes from five global regions together with air traffic and epidemiological data. Our models reveal community transmission prior to detection, changes in case reporting throughout the epidemic, and a large degree of transmission heterogeneity. We find that viral introductions played a limited role in prolonging spread after initial dissemination, suggesting that travel bans would have had only a minor impact. We find that mpox transmission in North America began declining before more than 10% of high-risk individuals in the USA had vaccine-induced immunity. Our findings highlight the importance of broader routine specimen screening surveillance for emerging infectious diseases and of joint integration of genomic and epidemiological information for early outbreak control.
Keywords: global health; interventions; mpox; phylodynamics; phylogenetics; public health; vaccination campaigns; viral epidemiology; viral evolution.
Copyright © 2024 The Authors. Published by Elsevier Inc. All rights reserved.
Conflict of interest statement
Declaration of interests All authors declare no competing interests.
Figures

Update of
-
Early underdetected dissemination across countries followed by extensive local transmission propelled the 2022 mpox epidemic.medRxiv [Preprint]. 2023 Dec 7:2023.07.27.23293266. doi: 10.1101/2023.07.27.23293266. medRxiv. 2023. Update in: Cell. 2024 Mar 14;187(6):1374-1386.e13. doi: 10.1016/j.cell.2024.02.003. PMID: 37577709 Free PMC article. Updated. Preprint.
Similar articles
-
Early underdetected dissemination across countries followed by extensive local transmission propelled the 2022 mpox epidemic.medRxiv [Preprint]. 2023 Dec 7:2023.07.27.23293266. doi: 10.1101/2023.07.27.23293266. medRxiv. 2023. Update in: Cell. 2024 Mar 14;187(6):1374-1386.e13. doi: 10.1016/j.cell.2024.02.003. PMID: 37577709 Free PMC article. Updated. Preprint.
-
Global epidemiology, viral evolution, and public health responses: a systematic review on Mpox (1958-2024).J Glob Health. 2025 Mar 7;15:04061. doi: 10.7189/jogh.15.04061. J Glob Health. 2025. PMID: 40048320 Free PMC article.
-
Monkeypox: A comprehensive review on mutation, transmission, pathophysiology, and therapeutics.Int Immunopharmacol. 2025 Jan 27;146:113813. doi: 10.1016/j.intimp.2024.113813. Epub 2024 Dec 13. Int Immunopharmacol. 2025. PMID: 39674002 Review.
-
Mpox Resurgence: A Multifaceted Analysis for Global Preparedness.Viruses. 2024 Nov 5;16(11):1737. doi: 10.3390/v16111737. Viruses. 2024. PMID: 39599851 Free PMC article. Review.
-
Understanding the biology of monkeypox virus to prevent future outbreaks.Nat Microbiol. 2024 Jun;9(6):1408-1416. doi: 10.1038/s41564-024-01690-1. Epub 2024 May 9. Nat Microbiol. 2024. PMID: 38724757 Review.
Cited by
-
The Rise of Mpox in a Post-Smallpox World.Emerg Infect Dis. 2025 Jan;31(1):27-31. doi: 10.3201/eid3101.241230. Epub 2024 Dec 3. Emerg Infect Dis. 2025. PMID: 39626319 Free PMC article.
-
Integrating Contact Tracing Data to Enhance Outbreak Phylodynamic Inference: A Deep Learning Approach.Mol Biol Evol. 2024 Nov 1;41(11):msae232. doi: 10.1093/molbev/msae232. Mol Biol Evol. 2024. PMID: 39497507 Free PMC article.
-
Transmission dynamics of the 2022 mpox epidemic in New York City.Nat Med. 2025 May;31(5):1464-1473. doi: 10.1038/s41591-025-03526-9. Epub 2025 Mar 25. Nat Med. 2025. PMID: 40133528 Free PMC article.
-
Exploring the genomic basis of Mpox virus-host transmission and pathogenesis.mSphere. 2024 Dec 19;9(12):e0057624. doi: 10.1128/msphere.00576-24. Epub 2024 Nov 14. mSphere. 2024. PMID: 39540739 Free PMC article. Review.
-
Mpox cases finding: Evaluation of a Primary Care detection program in the Northern Metropolitan area from Barcelona (Spain).Aten Primaria. 2025 Mar;57(3):103089. doi: 10.1016/j.aprim.2024.103089. Epub 2024 Sep 24. Aten Primaria. 2025. PMID: 39321646 Free PMC article.
References
-
- CDC (2023). Mpox in the U.S. Cent. Dis. Control Prev https://www.cdc.gov/poxvirus/mpox/images/monkeypox.jpg.
MeSH terms
Grants and funding
LinkOut - more resources
Full Text Sources
Medical
