. 2024 Mar 19;5(3):101441.
doi: 10.1016/j.xcrm.2024.101441. Epub 2024 Feb 29.

Mediator complex subunit 1 architects a tumorigenic Treg cell program independent of inflammation

Affiliations

Mediator complex subunit 1 architects a tumorigenic Treg cell program independent of inflammation

Shuvam M Chaudhuri et al. Cell Rep Med. .

Abstract

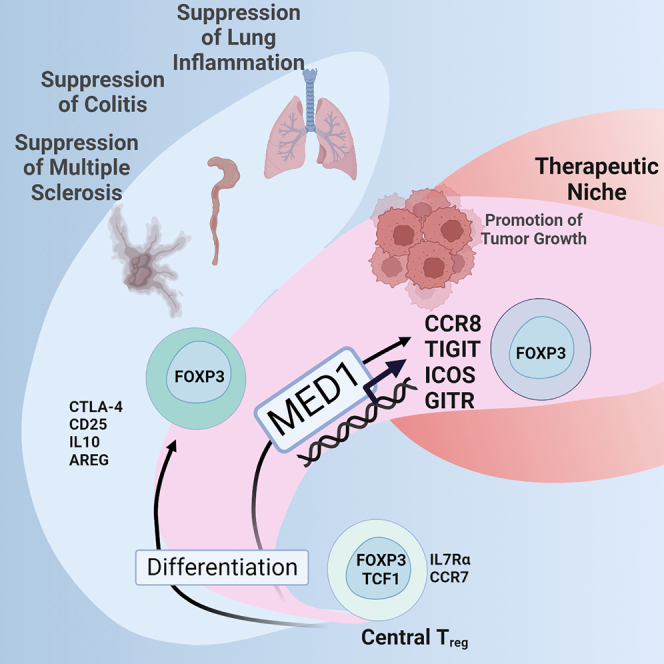
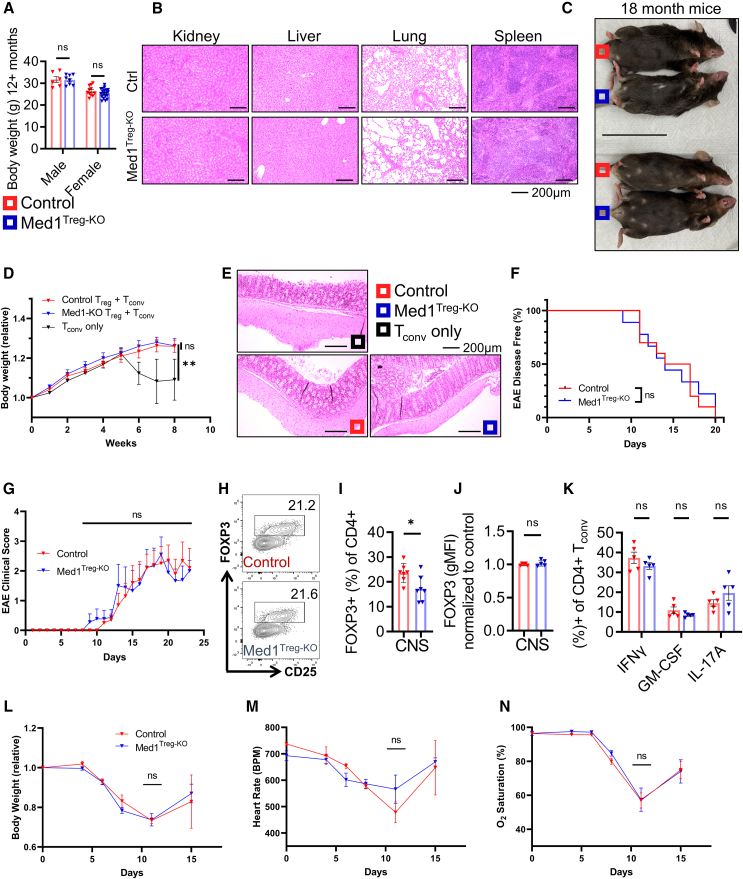
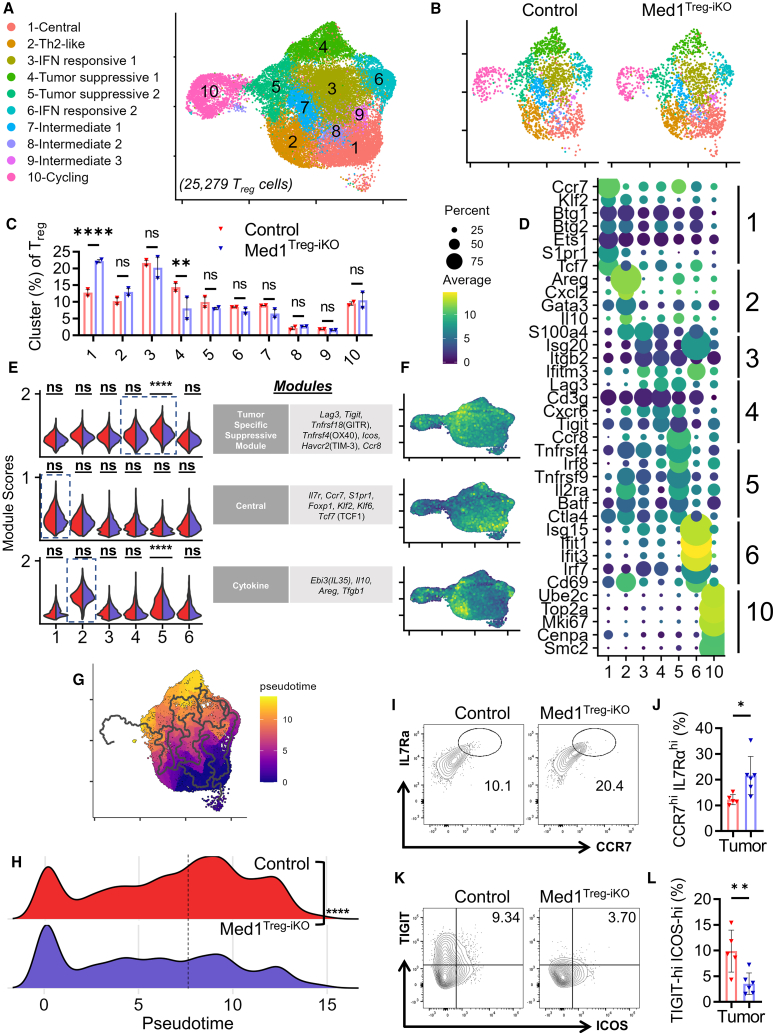
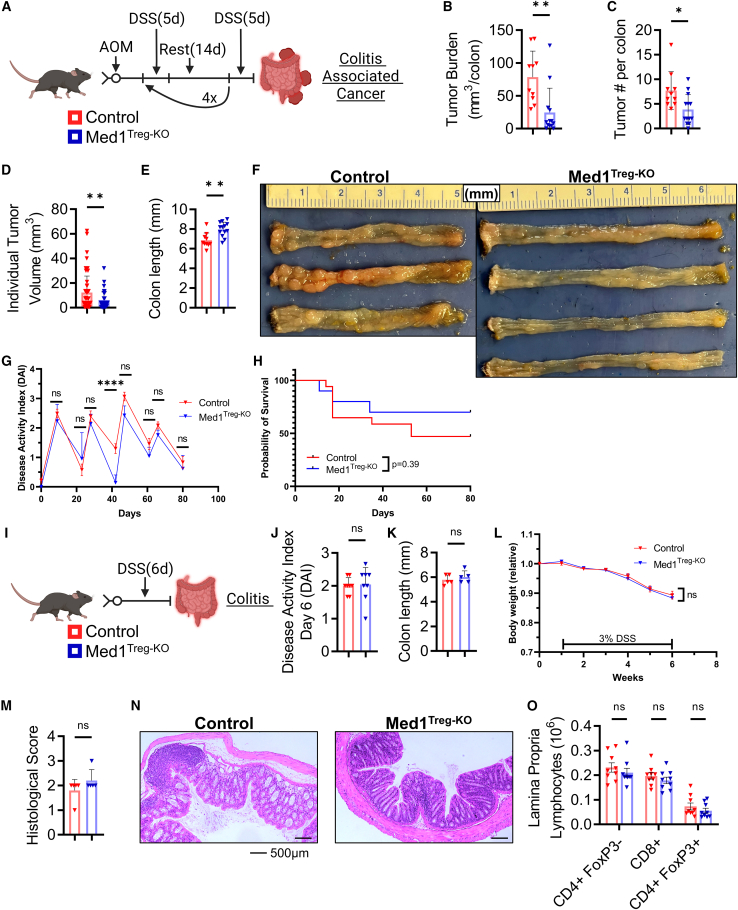
While immunotherapy has revolutionized cancer treatment, its safety has been hampered by immunotherapy-related adverse events. Unexpectedly, we show that Mediator complex subunit 1 (MED1) is required for T regulatory (Treg) cell function specifically in the tumor microenvironment. Treg cell-specific MED1 deletion does not predispose mice to autoimmunity or excessive inflammation. In contrast, MED1 is required for Treg cell promotion of tumor growth because MED1 is required for the terminal differentiation of effector Treg cells in the tumor. Suppression of these terminally differentiated Treg cells is sufficient for eliciting antitumor immunity. Both human and murine Treg cells experience divergent paths of differentiation in tumors and matched tissues with non-malignant inflammation. Collectively, we identify a pathway promoting the differentiation of a Treg cell effector subset specific to tumors and demonstrate that suppression of a subset of Treg cells is sufficient for promoting antitumor immunity in the absence of autoimmune consequences.

Keywords: ATAC-seq; FOXP3; MED1; autoimmunity; differentiation; scRNA-seq; tumor T regulatory cell; tumor immunology.


Conflict of interest statement

Declaration of interests B.D.S. holds United States Patent No. US 10,905,706 B2, “Compositions and Methods to Accelerate Resolution of Acute Lung Inflammation” and serves on the Scientific Advisory Board of Zoe Biosciences, outside of the submitted work.

Figures

None
Graphical abstract
Figure 1
Figure 1
MED1 is dispensable for Treg cell function across inflammatory contexts (A) Foxp3YFP−cre (control) and Foxp3YFP−cre/Med1fl/fl (Med1Treg−KO) mice were aged to 12–14 months and bodyweights were measured. (n = 611 for control and n = 819 for Med1Treg−KO for male and female, respectively.) (B) Representative hematoxylin and eosin (H&E) staining from organs of mice in (A). (C) Representative photograph of mice aged to 18 months. (D) CD45.1 CD4+ Tconv cells were either transferred in alone or with Treg cells isolated from control or Med1Treg−KO mice to induce colitis. Body weight displayed relative to start (n = 5 per group). (E) Representative H&E staining from colons of mice in (D). (F)EAE was induced by immunization with MOG peptide. Disease incidence was tracked per group during experiment. (G) Clinical scores measured during EAE (n = 10 control and n = 9 Med1Treg−KO). (H) Representative flow plots of FOXP3 expression of CD4 T cells within the CNS. (I) Summary of (H) (n = 7 control and n = 7 Med1Treg−KO). (J) FOXP3 protein expression in CD4+ FOXP3+ CD25+ T cells in the CNS. Values are normalized to controls. (n = 5 control and n = 5 Med1Treg−KO.) (K) Percentage of cytokine producing CD4+ FOXP3- Tconv cells in the CNS. (n = 5 control and n = 5 Med1Treg−KO). (L) Mice were inoculated with influenza virus and monitored over course of disease. Body weight relative to starting (n = 8 controls and n = 6 Med1Treg−KO). (M) Heart rate measured in beats per minute (BPM) (n = 8 controls and n = 6 Med1Treg−KO). (N) Oxygen saturation was measured by pulse oximeter (n = 8 controls and n = 6 Med1Treg−KO). (A), (D), and (K) used two-way ANOVA with multiple comparisons. (F), (G), (I), (J), and (L–N) use unpaired two-tailed Student’s t test at experiment conclusion. Bars represent ± SEM. Points on graph represent individual mice. (∗p < 0.05, ∗∗p < 0.01.) Related to Figures S1 and S2.
Figure 2
Figure 2
MED1 is required for Treg cell promotion of tumor growth (A) B16 tumors were implanted into flanks of Foxp3YFP−cre (controls) and Foxp3YFP−cre/Med1fl/fl (Med1Treg−KO) mice between 8 and 16 weeks of age. and measured for volume. (n = 12 control and n = 11 Med1Treg−KO). (B) EG7 tumors were implanted into flanks and measured for volume. (n = 5 control and n = 6 Med1Treg−KO.) (C) RM1 tumors were implanted into flanks and measured for volume. (n = 4 controls and n = 5 Med1Treg−KO.) (D) Tumor weights from B16, EG7, and RM1 tumors. (Respectively, for B16, EG7, and RM1 tumors: n = 8, 5, and 4 for controls and n = 11, 6, ad 5 for Med1Treg−KO.) (E) Experimental setup for tumor experiments using Foxp3eGFP−CreERT2, ROSA26SorCAG-tdTomato (control) Med1fl, Foxp3eGFP−CreERT2, and ROSA26SorCAG-tdTomato (Med1Treg-iKO) with inducible MED1 deletion and FOXP3 lineage trace. (F) RM1 tumors were implanted into flanks and measured for volume. (n = 14 controls and n = 13 Med1Treg-iKO.) (G) Representative photograph of RM1 tumors. (H) Tumor weights from RM1 tumors (n = 14 controls and n = 13 Med1Treg-iKO). (I) Representative flow plots of CD4 and CD8 expression within the CD45+ cells within RM1 tumors. (J) CD45+ CD3ε+ CD4+ FOXP3, CD45+ CD3ε+ CD8+, and of CD45+ CD3ε+ CD4+ FOXP3+ T cells proportion of total live cells from RM1 tumors (n = 6 controls and n = 7 Med1Treg-iKO). (K) Representative flow plots of Tconv (FoxP3 tdTomato), ex-FOXP3 (FOXP3 tdTomato+), tdT+ Treg (FOXP3+ tdTomato+), tdT Treg (FOXP3+ tdTomato+) within the intratumoral CD4+ T cell compartment. (L) Summary data of (K) (n = 4 controls and n = 5 Med1Treg-iKO). (M) Representative flow plots of IFN-γ production within intratumoral CD8+ T cell compartment. (N) Summary data of M (n = 6 controls and n = 6 Med1Treg-iKO). (O) RM1 tumors were implanted in mice. IgG control or α-CD8 depleting antibody treatment started on day 5. (n = 4 for each group.) (A–C), (F), (H), and (Q–T) use unpaired Student two-tailed t test at experiment conclusion. (D), (J), (L), and (O) used two-way ANOVA with multiple comparisons. Bars represent ± SEM. Points on graph except for (S) represent individual mice. (∗p < 0.05, ∗∗p < 0.01, ∗∗∗p < 0.001, ∗∗∗∗p < 0.0001.) Related to Figures S3, S4, and Table S1.
Figure 3
Figure 3
MED1 is essential for optimal differentiation of specific Treg cell effector populations (A) Integrated UMAP clustering of Treg cells isolated from RM1 tumors. (B) UMAP diagrams of Treg cells isolated from RM1 tumors in control (9,838 cells) and Med1Treg−IKO mice (15,441 cells). (C) Cluster proportion of total Treg cells from condition (n = 2 biological replicates, each biological replicate contains cells pooled from 2–3 separate mice). (D) Dot plot representing gene expression and percent expression within cells from each cluster. (E) Module scores comparing Treg cells from control and Med1Treg−IKO within clusters. Clusters with the highest expression of module are outlined. (F) Module scores portrayed on UMAP plots. (G) Pseudotime representation portrayed on integrated UMAP plot. (H) Ridge plot depicting pseudotime by condition. (I) Representative flow plot of CCR7 and IL7Ra expression in intratumoral Treg cells. (J) Summary data from (I) (n = 5 from controls and n = 6 Med1Treg−IKO). (K) Representative flow plot of TIGIT and ICOS expression in intratumoral Treg cells. (L) Summary data from (K) (n = 5 from controls and n = 6 Med1Treg−IKO). (C) used two-way ANOVA with multiple comparisons. (D) used Wilcoxon test to find genes overrepresented in clusters, all genes displayed showed p adjusted of less than 0.05 and log2(fold change) of greater than 0.4. (E) used the Mann-Whitney test to detect differences greater than 0.1 between conditions within clusters. (H) used the Mann-Whitney test. (J) and (L) use unpaired Student two-tailed t test. (p < 0.05, ∗∗p < 0.01, ∗∗∗∗p < 0.0001.) Related to Figure S5.
Figure 4
Figure 4
MED1 promotes transcription of Treg cell terminal differentiation program independent of chromatin accessibility (A) Experimental schematic of ATAC-sequencing and pseudobulk RNA sequencing experiments. (B) Principal component analysis plot of ATAC-sequencing peaks based on Deseq2 output. (C) ATAC-sequencing tracks of effector Treg cell genes. (D) Gene expression of effector Treg cell genes MED1-deficient intratumoral Treg cells relative to MED1-sufficient intratumoral Treg cells from pseudobulk RNA sequencing using MAST package. (E) Representative flow plots of TIGIT expression in intratumoral Treg cells and summary data of splenic and intratumoral Treg cells (n = 5 from controls and n = 6 Med1Treg−IKO). (F) Representative flow plots of GITR expression in intratumoral Treg cells and summary data of splenic and intratumoral Treg cells (n = 5 from controls and n = 6 Med1Treg−IKO). (G) Representative flow plots of ICOS expressions in intratumoral Treg cells and summary data of splenic and intratumoral Treg cells (n = 5 from control and n = 6 Med1Treg−IKO). (H) Quantification of ATAC-sequencing peaks ±10 KB from transcription start sites of significantly downregulated genes in MED1-deficient intratumoral Treg cells. (I) Transcription factor motif analysis on peaks from (H). Performed in Hypergeometric Optimization of Motif EnRichment. Gene expression differences were calculated with the MAST package. (E–G) used two-way ANOVA with multiple comparisons. I used HOMER to calculate motif enrichment, q-values are reported. (∗∗p < 0.01, ∗∗∗∗p < 0.0001.) Related to Figure S6.
Figure 5
Figure 5
MED1 is required for Treg cell promotion of colon tumor growth, but dispensable for control of colonic inflammation (A) Experimental setup for colitis-associated-cancer model induced by azoxymethane (AOM)/dextran sodium sulfate (DSS) treatment. (B) Tumor burden per colon (n = 10 controls and n = 13 Med1Treg−KO). (C) Tumor number per colon (n = 10 controls and n = 13 Med1Treg−KO). (D) Individual tumor volume (n = 10 controls and n = 13 Med1Treg−KO). Points represent individual tumors. (E) Colon length (n = 10 controls and n = 13 Med1Treg−KO). (F) Representative photographs of opened colons from control and Med1Treg−KO mice. (G) Disease activity index measured weekly. (n = 10 controls and n = 13 Med1Treg−KO.) (H) Survival of mice during duration of experiment. (I) Experimental setup for DSS treatment for colitis induction. (J) Disease activity index measured at experiment conclusion (n = 8 controls and n = 8 Med1Treg−KO). (K) Colon length (n = 5 controls and n = 5 Med1Treg−KO). (L) Bodyweight relative to start (n = 8 controls and n = 8 Med1Treg−KO). (M) Summary of histological score (n = 5 controls and n = 5 Med1Treg−KO). (N) Representative hematoxylin and eosin staining from the colons of mice. (O) Quantification of infiltrating lamina propria lymphocytes (n = 9 controls and n = 9 Med1Treg−KO). (B–E), (J), (K), and (M) use unpaired Student’s two-tailed t test at experiment conclusion. (G), (L), and (O) used two-way ANOVA with multiple comparisons. Bars represent ± SEM. Points on graph except for (D) represent individual mice. (∗p < 0.05, ∗∗p < 0.01, ∗∗∗∗p < 0.0001.) Related to Figure S7.
Figure 6
Figure 6
Murine and human Treg cells experience divergent paths of differentiation in tumors relative to inflammation (A) Experimental setup for colitis-associated-cancer model and colitis experiments. (B) Integrated UMAP clustering of Treg cells isolated from tumors and colons. (C) UMAP diagrams of Treg cells isolated from tumors and colons. (D) Cluster proportion of total Treg cells from different conditions (n = 2–3 biological replicates per condition, each biological replicate contains cells pooled from 2 to 8 separate mice). p values of less than 0.1 are displayed. (E) Feature plots of cluster 5 enriched genes. (F) Tumor-specific suppressive module score violin plot and UMAP plot. (G) Pseudotime representation portrayed on integrated UMAP plot and specific trajectory toward cluster 5. (H) Graph test results from Monocle 3. Moran’s I plotted for genes from least to greatest. Transcription factors above 0.2 labeled. (I) Experimental setup from (Loo et al.74). CD3+ T cells were isolated from patients, then Treg cells were subset during analysis based on positive CD4, FOXP3, and IL2RA expression and negative IL2 expression. (J) UMAP plots of Treg cells from HNSCC and inflamed OM. (K) Cluster proportion of total Treg cells from different conditions (n = 4 biological replicates per condition). p values of less than 0.1 are displayed. (L) Tumor-specific suppressive module score violin plot and UMAP plots for human data. (D) and (K) used two-way ANOVA with multiple comparisons. (F) and (L) used one-way ANOVA with Dunnet’s multiple comparisons test to compare cluster 5 to all clusters. (I) uses the graph test (Moran’s I) to test for genes with multi-directional and multi-dimensional spatial autocorrelation. Related to Figure S8.

References

    1. Khattri R., Cox T., Yasayko S.-A., Ramsdell F. An essential role for Scurfin in CD4+CD25+ T regulatory cells. Nat. Immunol. 2003;4:337–342. doi: 10.1038/ni909. - DOI - PubMed
    1. Hori S., Nomura T., Sakaguchi S. Control of regulatory T cell development by the transcription factor Foxp3. Science. 2003;299:1057–1061. doi: 10.1126/science.1079490. - DOI - PubMed
    1. Fontenot J.D., Gavin M.A., Rudensky A.Y. Foxp3 programs the development and function of CD4+CD25+ regulatory T cells. Nat. Immunol. 2003;4:330–336. doi: 10.1038/ni904. - DOI - PubMed
    1. Salama P., Phillips M., Grieu F., Morris M., Zeps N., Joseph D., Platell C., Iacopetta B. Tumor-infiltrating FOXP3+ T regulatory cells show strong prognostic significance in colorectal cancer. J. Clin. Oncol. 2009;27:186–192. doi: 10.1200/JCO.2008.18.7229. - DOI - PubMed
    1. Plitas G., Konopacki C., Wu K., Bos P.D., Morrow M., Putintseva E.V., Chudakov D.M., Rudensky A.Y. Regulatory T cells exhibit distinct features in human breast cancer. Immunity. 2016;45:1122–1134. doi: 10.1016/j.immuni.2016.10.032. - DOI - PMC - PubMed

Substances