. 2024 May 2;32(5):621-629.e5.
doi: 10.1016/j.str.2024.02.002. Epub 2024 Feb 29.

AutoRNC: An automated modeling program for building atomic models of ribosome-nascent chain complexes

Affiliations

AutoRNC: An automated modeling program for building atomic models of ribosome-nascent chain complexes

Robert T McDonnell et al. Structure. .

Abstract

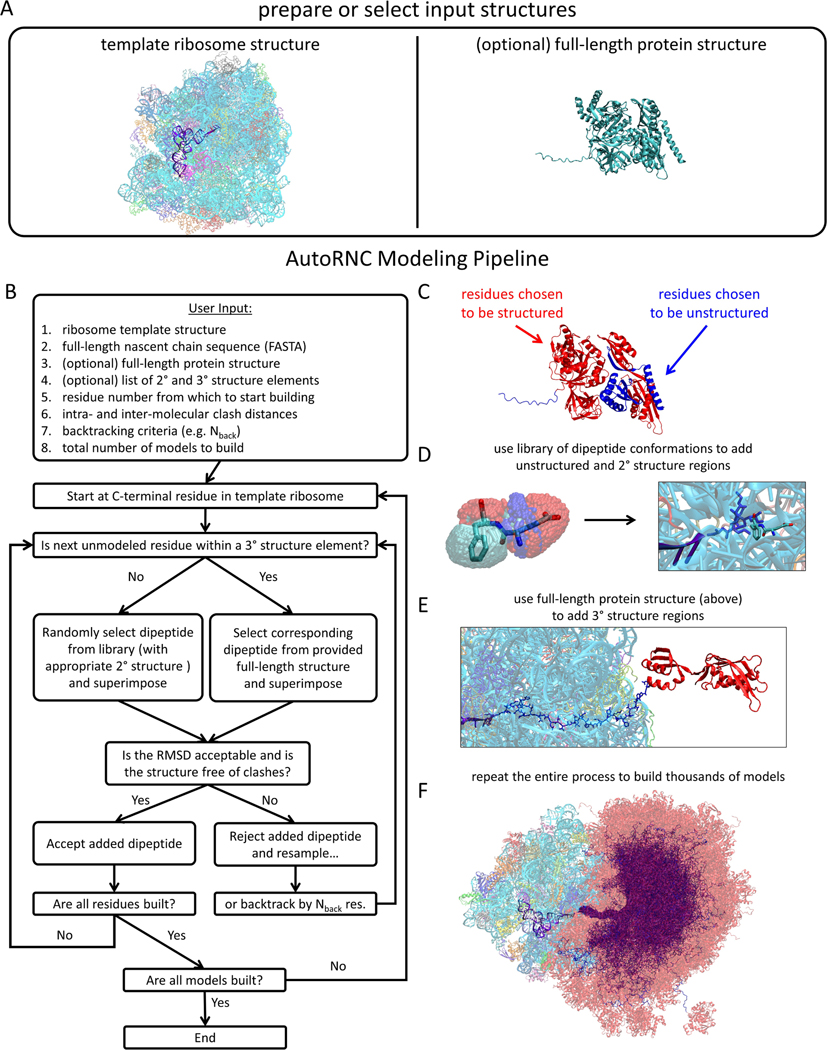
The interpretation of experimental studies of co-translational protein folding often benefits from the use of computational methods that seek to model or simulate the nascent chain and its interactions with the ribosome. Building realistic 3D models of ribosome-nascent chain (RNC) constructs often requires expert knowledge, so to circumvent this issue, we describe here AutoRNC, an automated modeling program capable of constructing large numbers of plausible atomic models of RNCs within minutes. AutoRNC takes input from the user specifying any regions of the nascent chain that contain secondary or tertiary structure and attempts to build conformations compatible with those specifications-and with the constraints imposed by the ribosome-by sampling and progressively piecing together dipeptide conformations extracted from the Research Collaboratory for Structural Bioinformatics Protein Data Bank (RCSB). Despite using only modest computational resources, we show here that AutoRNC can build plausible conformations for a wide range of RNC constructs for which experimental data have already been reported.


Conflict of interest statement

Declaration of interests The authors declare no competing interests.

Figures

Figure 1
Figure 1. Schematic illustration of the AutoRNC modeling pipeline.
(A) AutoRNC requires that the user selects (or alternatively, provides) a ribosome template structure (transparent cartoon) containing a P-site tRNA (opaque purple cartoon) from which to build the desired nascent chain. To model tertiary structure, users optionally can provide a folded structure of their protein of interest. (B) Flow chart of the AutoRNC modeling pipeline. (C) Users can exert control over which residues to model as unstructured, and which to model as members of secondary (2°) or tertiary (3°) structure elements. AutoRNC builds the nascent chain from the C-terminal residue using: (D) dipeptide conformation libraries for unfolded or secondary structured regions, or (E) an input protein structure for tertiary structured regions. (F) The entire modeling process repeats until the desired number of models has been built; thousands of models can be built in a single run. Visualization of the models shown in this and all other figures was carried out using VMD.
Figure 2
Figure 2. AutoRNC can model constructs with arbitrary combinations of structural elements.
Each panel highlights nascent chain conformations with different structured statuses modeled by AutoRNC. (A) Unfolded nascent chain models of a 204-residue calerythrin construct ; blue lines represent the C-terminal residues 128–167, red lines represent residues 1–127). (B) Secondary structure in nascent chain models of a 56-residue HemK construct , all contained within the ribosome exit tunnel; the insert highlights a single conformation with helices colored red, yellow and green. (C) Nascent chain models with a single folded region from a 478-residue EF-G construct ; combined folded domains G+II (residues 16–421) are red, all other residues are blue. (D) Nascent chain models with multiple, independently folded domains from a 730-residue EF-G construct ; combined domains G+II (residues 16–425) are now yellow; combined domains IV+V (residues 506–695) are red; the intervening domain III (residues 431–503) and the C-terminal 35 residues are blue. (E) Nascent chain models with both secondary and tertiary structure from a 686-residue P22 tail spike protein construct ; α-helices are shown as green, purple and cyan cartoons; tertiary elements are shown as grey, yellow and red opaque cartoons). Left image shows a single selected model; right image shows many models overlaid.
Figure 3
Figure 3. AutoRNC models can illustrate co-translational folding trajectories of RNCs.
Each panel shows 1000 RNC conformations modeled by AutoRNC for constructs that fold co-translationally in experiment as the nascent chain increases in length (from left to right) and emerges from the ribosome exit tunnel. (A) E. coli HemK constructs , in which α-helices I (blue), II (red), III (green) and IV (yellow) form within the ribosome exit tunnel and fold into the N-terminal domain (blue, HemK 112 AA) once the nascent chain is sufficiently long. (B) D. discoideum Filamin-like domain constructs, “ddFLN” in which the domain folds only after emerging from the ribosome exit tunnel. (C) E. coli EF-G constructs , in which domains G (blue), II (red) and III (green) extend out of the ribosome exit tunnel; in the constructs shown, only domains G and II are capable of folding. All models shown here were created using folded states determined experimentally and ribosome template structures consistent with the method used to stall translation experimentally.
Figure 4
Figure 4. AutoRNC predicts that environments sampled by nascent chain residues within the ribosome exit tunnel can depend on the folding status of nascent chain residues outside the tunnel.
The extent of nascent chain sampling within, and emerging from, the ribosome exit tunnel is shown using 1000 different conformations of the 354-AA EF-G nascent chain sequence modeled as folded (top row) and unfolded (middle row). Each panel shows selected nascent chain residues colored and displayed over a single conformation. In each panel, a single conformation of the complete nascent chain is shown for reference. The ribosome is shown as transparent cartoon, the PTC tRNA is shown as opaque purple cartoon, unfolded residues are shown as lines colored by atom type. and folded residues are shown as opaque cyan cartoon. The graphs on the bottom row show the distribution of distances measured between the residue and the PTC in the 1000 conformations. The middle black line in each colored box represents the median value, while the upper and lower lines of each box represent the 75th and 25th percentiles, respectively; the vertical line “whiskers” extend to 1.5x the inter-quartile range, and all data points outside the whisker range are plotted individually.

Update of

Similar articles

References

    1. Thommen M, Holtkamp W, and Rodnina MV (2017). Co-translational protein folding: progress and methods. Current Opinion in Structural Biology 42, 83–89. 10.1016/j.sbi.2016.11.020. - DOI - PubMed
    1. Liutkute M, Samatova E, and Rodnina MV (2020). Cotranslational Folding of Proteins on the Ribosome. Biomolecules 10. 10.3390/biom10010097. - DOI - PMC - PubMed
    1. Waudby CA, Dobson CM, and Christodoulou J. (2019). Nature and Regulation of Protein Folding on the Ribosome. Trends in Biochemical Sciences 44, 914–926. 10.1016/j.tibs.2019.06.008. - DOI - PMC - PubMed
    1. Rajasekaran N, and Kaiser CM (2022). Co-Translational Folding of Multi-Domain Proteins. Frontiers in Molecular Biosciences 9. 10.3389/fmolb.2022.869027. - DOI - PMC - PubMed
    1. Holtkamp W, Kokic G, Jäger M, Mittelstaet J, Komar AA, and Rodnina MV (2015). Cotranslational protein folding on the ribosome monitored in real time. Science 350, 1104–1107. 10.1126/science.aad0344. - DOI - PubMed

Publication types

LinkOut - more resources