. 2024 Mar 1;15(1):1911.
doi: 10.1038/s41467-024-46253-4.

Protein NirP1 regulates nitrite reductase and nitrite excretion in cyanobacteria

Affiliations

Protein NirP1 regulates nitrite reductase and nitrite excretion in cyanobacteria

Alexander Kraus et al. Nat Commun. .

Abstract

When the supply of inorganic carbon is limiting, photosynthetic cyanobacteria excrete nitrite, a toxic intermediate in the ammonia assimilation pathway from nitrate. It has been hypothesized that the excreted nitrite represents excess nitrogen that cannot be further assimilated due to the missing carbon, but the underlying molecular mechanisms are unclear. Here, we identified a protein that interacts with nitrite reductase, regulates nitrogen metabolism and promotes nitrite excretion. The protein, which we named NirP1, is encoded by an unannotated gene that is upregulated under low carbon conditions and controlled by transcription factor NtcA, a central regulator of nitrogen homeostasis. Ectopic overexpression of nirP1 in Synechocystis sp. PCC 6803 resulted in a chlorotic phenotype, delayed growth, severe changes in amino acid pools, and nitrite excretion. Coimmunoprecipitation experiments indicated that NirP1 interacts with nitrite reductase, a central enzyme in the assimilation of ammonia from nitrate/nitrite. Our results reveal that NirP1 is widely conserved in cyanobacteria and plays a crucial role in the coordination of C/N primary metabolism by targeting nitrite reductase.


Conflict of interest statement

The authors declare no competing interests.

Figures

Fig. 1
Fig. 1. Genomic location and expression of nirP1 in Synechocystis 6803.
a The transcriptional unit TU2296 encompassing the coding sequence of nirP1 (ncr1071) overlaps gene sll1864 annotated as encoding a chloride ion channel protein. Plot at low CO2 (blue) versus N starvation (green). Transcriptional units (TUs) are indicated according to the previous annotation of the transcriptome and genome-wide mapping of transcriptional start sites. The potential open reading frame of ncr1071 coding for the NirP1 protein is indicated by a black arrow. b Alignment of selected potential NirP1 homologs from cyanobacteria belonging to four morphological subsections. The last and most conserved part of Synechocystis 6803 NirP1 from position 25 to the end is shown. The cysteine and tryptophan residues conserved in all 485 potential homologs (Supplementary Dataset 1) are marked by arrows. The alignment was generated using ClustalW and visualized by Jalview. c Time course of nirp1 mRNA accumulation in Synechocystis 6803 after cells precultivated in medium supplemented with 10 mM NaHCO3 (HC) for 3 h were shifted to medium without a source of Ci (LC). The nirp1 transcript was detected by a 32P-labeled single-stranded RNA probe. The membrane was rehybridized to a 5S rRNA probe as a loading control. The RiboRuler Low Range RNA ladder (Thermo Fisher Scientific) was used as the molecular mass standard. The relative amount of nirp1 transcript normalized to the 5S rRNA is shown in the bar chart. The HC condition was set to 1, and all other signals were normalized to the HC condition. Two independent biological replicates were used and averaged. d NirP1 was detected in the presence or absence of Ci by Western blotting using anti-FLAG antiserum against tagged NirP1 under the control of its native promoter in two biological replicates (R1 and R2). The wild type was used as a control. Cultures were grown in medium supplemented with 10 mM NaHCO3 (+), washed, and cultivated in carbonate-free medium (-) for 24 h. Prestained PageRulerTM (Thermo Fisher Scientific) was used as a molecular mass marker. The blot has been performed in two independent experiments (n = 2). e NirP1 structure predicted by AlphaFold, for the complete Synechocystis NirP1 protein, indicating the presence of four beta folds in the most conserved part. The four totally conserved amino acids as well as Cys27 and Cys81 are highlighted, tryptophan is shown in magenta, and cysteine in yellow. The Met1 residue is also indicated for orientation. Source data are provided as a Source Data file.
Fig. 2
Fig. 2. NirP1 expression is mediated through a Ci-sensitive promoter and the transcription factor NtcA.
a Top: Native PnirP1 promoter sequence from position −70 to +30 (TSS at +1) used in a bioluminescence reporter strain harboring a PnirP1-luxAB transcriptional fusion. Functional promoter elements are colored blue. The previously determined transcription start site (TSS) is indicated. Middle row: Mutated nucleotides in the NtcA-binding site yielding promoter PNtcA-Mut are colored red. Bottom: Mutated nucleotides in the repeat motif yielding promoter PRepeat-Mut are colored red. Both mutated promoters were fused to luxAB and introduced into a neutral site in parallel with the PnirP1-luxAB construct. b Bioluminescence of the Synechocystis 6803 PnirP1-luxAB, PNtcA-Mut-luxAB reporter, and PRepeat-Mut-luxAB strains and a promoter-less (Pless) negative control. Cells were grown under HC conditions (BG11 supplemented with 10 mM NaHCO3) for 2 h and transferred to BG11 medium without a CO2 source to induce LC conditions for 24 h. c The strains were cultivated in BG11 (-N), and the chlorotic cultures were transferred back to standard BG11 (17.6 mM NaNO3) medium to start the recovery process seven days after N starvation was initiated. d Strains were cultivated in standard BG11 and then 10 mM NH4Cl was added for 24 h. Bioluminescence data are presented as the means ± SDs of 3 independent measurements with three biological replicates each (n = 9). Significance was calculated with a two-tailed t-test with unequal variance (Welch’s t-test; *P < 0.05; **P < 0.01; ***P < 0.001) between the strains at corresponding time points (details of statistical analysis Supplementary Fig. S3 and in Supplementary Dataset 3). Source data are provided as a Source Data file.
Fig. 3
Fig. 3. Phenotypical differences between nirP1 mutant strains and the wild type in BG11 medium.
a Growth of wild type (black), the ΔnirP1 deletion mutant (red), and the strains expressing nirP1 under control of the PpetE promoter in the wild-type background (dark blue, NirP1oex) and ΔnirP1 background (light blue, ΔnirP1::oex). Data points represent the mean ± SD of 3 biological replicates (n = 3; details with growth rates and doubling time are provided in Supplementary Dataset 4). b Growth in liquid medium after shifting to LC conditions. Strains were cultivated for 2 h in medium containing 10 mM NaHCO3, collected, and transferred to medium without a Ci source. The complementation strain (orange, ΔnirP1::nirP1) expressed nirP1 under the control of its native PnirP1 promoter in the ΔnirP1 background. Other strains as in (a); n = 3. c Pigmentation phenotype of wild-type and nirP1 overexpressors in the presence of Cu2SO4 expressing nirP1 for 24 h. All cultures were set to an OD of ~0.8. d Room temperature absorption spectra for wild-type and nirP1 mutants expressing nirP1 for 24 h from the PpetE promoter in the presence of Cu2SO4, normalized to wild-type OD750. Same strains and colors as in (a). Spectra were recorded from three biological replicates and averaged (n = 3). Further phenotypical differences in Supplementary Figs. S4 and S5.
Fig. 4
Fig. 4. Differences in the accumulation of key intermediates in C/N primary metabolism due to the availability of NirP1 during shifts to LC.
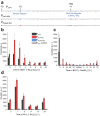
a Total amino acid content. b Glutamate and glutamine concentrations. c 2-oxoglutarate concentrations. d Concentrations of ornithine-ammonium cycle intermediates and of aspartate. Metabolite content was measured for ΔnirP1, NirP1oex, and wild type (WT). All concentrations are given in ng * mL−1 * OD750 nm−1. Two biological replicates (n = 2) were used for all strains and metabolites (except in c where the means ± SD of three biological replicates are shown, n = 3) and averaged (details and raw data in Supplementary Dataset 5). Significance was calculated with the two-tailed t-test with unequal variance (Welch’s t-test; *only P ≤ 0.05 are shown) for each strain and between the strains at corresponding time points. The measurements were independently repeated in triplicates (n = 3) and the results confirmed (details in Supplementary Dataset 6).
Fig. 5
Fig. 5. NirP1 expression and pull-down analysis.
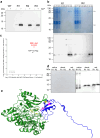
a Detection of NirP1 after 24 h of induction with 2 µM Cu2SO4 by Western blotting using anti-FLAG antiserum against tagged NirP1 in three biological replicates (R1–R3). The wild type was used as a control. b NirP1 pull-down analysis of two biological, independent replicates (R1 and R2). Upper panel: Coomassie-stained SDS gel, the NirP1 signal, and a band indicating a prominent coeluting protein of ~60 kDa are marked with arrows. Fractions are numbered and labeled CE cell extract, FT flow-through, W wash, E elution. Lower panel: Immunological identification of the lower band as NirP1. c Mass spectrometry-based analysis of NirP1 co-IP. Scatter plot of log2-transformed LFQ protein ratios (NirP1-3xFlag co-IP/cell extract) from two independent replicates. Displayed are proteins with a higher abundance in NirP1-3xFlag co-IP elution fractions compared to the initial cell extract. The main interacting protein was identified as ferredoxin-nitrite reductase (NiR), which is encoded by the nirA/slr0898 gene. d Western blot of NirP1 co-IP fractions using native, denaturing, or reducing conditions. All samples were loaded in biological replicates R1 and R2. e NirP1-NiR (WP_010873675.1) interaction in Synechocystis 6803 predicted by AlphaFold, using their full-length sequences. The interaction modeled for the NiR and NirP1 homologs from Synechococcus 7942 is shown in Supplementary Fig. S7b. Source data are provided as a Source Data file.
Fig. 6
Fig. 6. Excretion of nitrite is triggered in the presence of NirP1.
a Synechocystis 6803 strains were grown photoautotrophically in BG11 medium with 5% (v/v) CO2 in air as high Ci (HC), harvested and resuspended in new medium and aerated with 0.04% (v/v) CO2 in air to initiate LC conditions. The wild type (WT) started to excrete nitrite in LC conditions when nirP1 was expressed (see Fig. 1c). b Same data as in (a) but at different scales to include the results from the NirP1oex strain. Accumulation of nitrite in the supernatant was followed over time. c The consumption of nitrate, measured as the decrease in the concentration of nitrate in the supernatants after pelleting the cells by centrifugation. Strains were grown in BG11, washed with N-free BG11 (BG11 –N), set to OD = 1 and resuspended in BG11 containing 200 µM nitrate. d The production and excretion of nitrite into the supernatant measured in the same samples as in (c) for nitrate. Data are presented as the means ± SD of measuring biological triplicates in duplicates each (n = 6). Significance was calculated using a two-tailed t-test with unequal variance (Welch’s t-test; ns no significance; *only P < 0.05 are shown) between the strains at corresponding time points. Full details are provided in Supplementary Dataset 10.
Fig. 7
Fig. 7. NirP1 is a regulator at a central position in the assimilation of inorganic nitrogen.
Cyanobacteria can assimilate N from simple compounds, such as ammonium, nitrate, nitrite, and urea. During nitrate assimilation, intracellular nitrate is reduced in two steps to nitrite and ammonium, which is then incorporated into glutamate in the GS/GOGAT cycle or into carbon skeletons during the synthesis of amino acids by transaminases. The reduction of nitrate to nitrite is catalyzed by the NR and the subsequent reduction to ammonium by the NiR. Transcription of the regulatory factor NirP1 is controlled by an unknown transcription factor (TF) and by NtcA. 2-OG is a corepressor of NtcA. Therefore, an increased 2-OG level leads to the repression of nirP1 transcription, while a low level of 2-OG leads to its activation. NirP1 binds to the enzyme nitrite reductase (NiR), leading to the inhibition of nitrite reduction. The accumulating nitrite is then rapidly exported by an unidentified export system. Transport systems for ammonium (AMT) and nitrate/nitrite (NRT) uptake are shown.

Similar articles

Cited by

References

    1. Biller SJ, Berube PM, Lindell D, Chisholm SW. Prochlorococcus: the structure and function of collective diversity. Nat. Rev. Microbiol. 2015;13:13–27. doi: 10.1038/nrmicro3378. - DOI - PubMed
    1. Flombaum P, et al. Present and future global distributions of the marine Cyanobacteria Prochlorococcus and Synechococcus. Proc. Natl Acad. Sci. USA. 2013;110:9824–9829. doi: 10.1073/pnas.1307701110. - DOI - PMC - PubMed
    1. Partensky F, Hess WR, Vaulot D. Prochlorococcus, a marine photosynthetic prokaryote of global significance. Microbio. l Mol. Biol. Rev. 1999;63:106–127. doi: 10.1128/MMBR.63.1.106-127.1999. - DOI - PMC - PubMed
    1. Hagemann M, Hess WR. Systems and synthetic biology for the biotechnological application of cyanobacteria. Curr. Opin. Biotechnol. 2018;49:94–99. doi: 10.1016/j.copbio.2017.07.008. - DOI - PubMed
    1. Vijay D, Akhtar MK, Hess WR. Genetic and metabolic advances in the engineering of cyanobacteria. Curr. Opin. Biotechnol. 2019;59:150–156. doi: 10.1016/j.copbio.2019.05.012. - DOI - PubMed

MeSH terms