. 2024 Mar 1;15(1):1919.
doi: 10.1038/s41467-024-46307-7.

Predictive role of ctDNA in esophageal squamous cell carcinoma receiving definitive chemoradiotherapy combined with toripalimab

Affiliations

Predictive role of ctDNA in esophageal squamous cell carcinoma receiving definitive chemoradiotherapy combined with toripalimab

Baoqing Chen et al. Nat Commun. .

Abstract

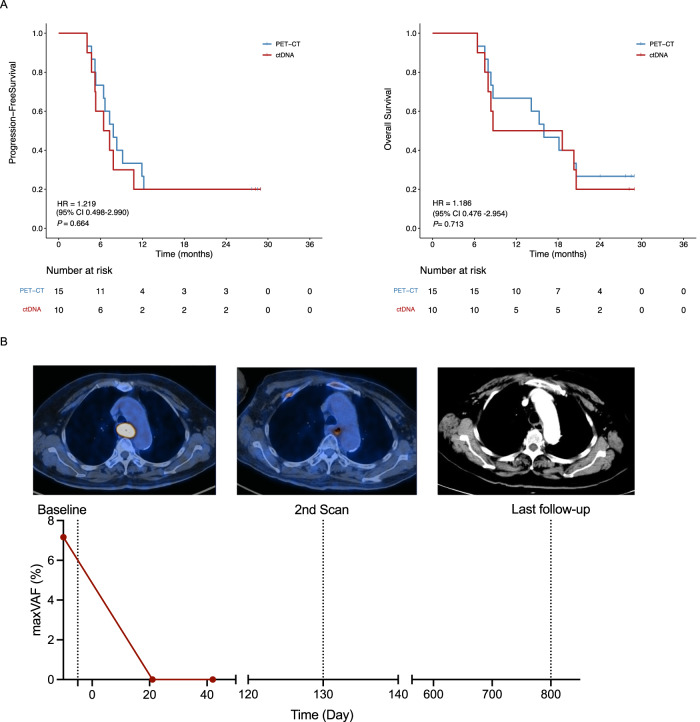
The combination of toripalimab (an anti-PD-1 antibody) with definitive chemoradiotherapy (CRT) demonstrated encouraging efficacy against locally advanced esophageal squamous cell carcinoma (ESCC) in the EC-CRT-001 phase II trial (NCT04005170). The primary endpoint of this trial was the clinical complete response rate (cCR), and the secondary endpoints included overall survival (OS), progression-free survival (PFS), duration of response, and quality of life. The exploratory analyses of EC-CRT-001 include exploring the role of circulating tumor DNA (ctDNA) and blood-based tumor mutational burden (bTMB) in predicting the response and survival. In total, 118 blood and 35 tissue samples from 42 enrolled patients were included in the analyses. We found that ctDNA-negative patients achieved a higher cCR compared to those with detectable ctDNA during CRT (83%, 19/23 vs. 39%, 7/18; p = 0.008) or post-CRT (78%, 21/27 vs. 30%, 3/10; p = 0.017). Patients with detectable ctDNA during CRT had shorter PFS (p = 0.014). Similarly, patients with post-CRT detectable ctDNA had a significantly shorter PFS (p = 0.012) and worse OS (p = 0.004). Moreover, patients with high bTMB levels during CRT had prolonged OS (p = 0.027). In conclusion, ctDNA and bTMB have the potential to predict treatment efficacy and survival in ESCC treated with CRT and immunotherapy.


Conflict of interest statement

Y.Z. is the employee of Nanjing Geneseeq Technology Inc. All other authors have no conflicts of interest to declare.

Figures

Fig. 1
Fig. 1. Pre-CRT tumor and ctDNA analyses in patients with locally advanced ESCC.
A The workflow of the study; B Distribution of genetic variation in ctDNA genotyping analyses: each column represents an individual patient. Clinical characteristic of response and stage are shown at the top. Genes mutated in at least 2.5% of the patients in our cohort are depicted. The fraction of tumors with mutations in each gene is shown on the left; C Genotyping results of 33 patients with both tumor tissue and ctDNA analyses; D Venna graph present the number sharing variant of all, TP53, CDKN2A, and NFE2L2 in plasms and tissue. Comparison of ctDNA positive rate (E) and mean maxVAF (F) in subgroups according to tumor length (n = 42) and disease stage (n = 42). Data are presented as mean values +/− SD. P-values (p) were determined by two-tailed unpaired t-tests. ESCC esophageal squamous cell carcinoma, CRT chemoradiotherapy, CR complete response, ctDNA circulating tumor DNA, maxVAF maximal variant allele frequency. Source data are provided as a Source Data file.
Fig. 2
Fig. 2. Dynamic ctDNA profiling are correlated with tumor response.
A Distribution of genetic variation in during- and post-CRT ctDNA genotyping analyses; CtDNA-positive rate (%) (B) and maxVAF (%) (C) decrease during (n = 41) and after (n = 37) CRT in comparison to baseline (n = 40). Data are presented as mean values +/− SD. P-values (p) were determined by two-tailed Fisher’s exact test (B) and two-tailed unpaired t-tests (C); D Difference in cCR rate among ctDNA-positive and ctDNA-negative groups at baseline, during, and after CRT. P-values (p) were determined by two-tailed Fisher’s exact test; E Difference in cCR rate in subgroups categorized by the ctDNA change patterns during CRT (pattern 1, ctDNA continuously negative at all three time points, n = 7); pattern 2 (ctDNA cleared during CRT, n = 12), pattern 3 (ctDNA cleared after CRT, n = 8), and pattern 4 (ctDNA was still positive after CRT, n = 9). cCR clinical complete response, ctDNA circulating tumor DNA, maxVAF maximal variant allele frequency, CRT chemoradiotherapy. Source data are provided as a Source Data file.
Fig. 3
Fig. 3. During and post-CRT ctDNA status and its dynamic change patterns predict survival.
Progression-free and overall survival of ctDNA-positive and ctDNA-negative patients during CRT (A) and post-CRT (B) and in patients with different dynamic change patterns (C). P-values (p) were determined by Log Rank Test. ctDNA circulating tumor DNA, CRT chemoradiotherapy. Source data are provided as a Source Data file.
Fig. 4
Fig. 4. ctDNA status predicts progression-free survival and overall survival similar to PET-CT imaging.
A PFS and OS of patients with detectable ctDNA after CRT or non-cCR patients confirmed by PET-CT at 3 months after CRT. P-values (p) were determined by Log Rank Test; B Patient (#ID17) with stage IIIA ESCC was ctDNA-negative after CRT but the PET-CT imaging at 3 months after CRT had shown an SUVmax of 5.8 on the site of the primary esophageal lesion. This patient was confirmed to have radiation esophagitis rather than residual disease by the long PFS. ESCC esophageal squamous cell carcinoma, ctDNA circulating tumor DNA, PFS progression-free survival, OS overall survival, maxVAF maximal variant allele frequency, CRT chemoradiotherapy. Source data are provided as a Source Data file.
Fig. 5
Fig. 5. Survival of bTMB-high and bTMB-low groups.
Forest plots show HRs and 95% CI of the PFS (A) and OS (B) in bTMB-high or -low subgroups divided by during- or post-CRT bTMB according to cut-off values at 1, 2, 3, and 4. Data are presented as the hazard ratios (HR) with error bars showing 95% confidence intervals. C PFS and OS of patients with high bTMB (>1.0 mutations/mb) and low bTMB (≤1.0 mutations/mb) detected during CRT. P-values (p) were determined by Log Rank Test. HR hazard ration, CI confidence intervals, OS overall survival, bTMB blood-based tumor mutational burden, CRT chemoradiotherapy. Source data are provided as a Source Data file.

References

    1. Sung H, et al. Global Cancer Statistics 2020: GLOBOCAN Estimates of Incidence and Mortality Worldwide for 36 Cancers in 185 Countries. CA Cancer J. Clin. 2021;71:209–249. doi: 10.3322/caac.21660. - DOI - PubMed
    1. Hulshof M, et al. Randomized Study on Dose Escalation in Definitive Chemoradiation for Patients With Locally Advanced Esophageal Cancer (ARTDECO Study) J. Clin. Oncol. 2021;39:2816–2824. doi: 10.1200/JCO.20.03697. - DOI - PubMed
    1. Liu S, et al. Induction chemotherapy followed by definitive chemoradiotherapy versus chemoradiotherapy alone in esophageal squamous cell carcinoma: a randomized phase II trial. Nat. Commun. 2021;12:4014. doi: 10.1038/s41467-021-24288-1. - DOI - PMC - PubMed
    1. Luo H, et al. Effect of Camrelizumab vs Placebo Added to Chemotherapy on Survival and Progression-Free Survival in Patients With Advanced or Metastatic Esophageal Squamous Cell Carcinoma: The ESCORT-1st Randomized Clinical Trial. JAMA. 2021;326:916–925. doi: 10.1001/jama.2021.12836. - DOI - PMC - PubMed
    1. Wang ZX, et al. Toripalimab plus chemotherapy in treatment-naive, advanced esophageal squamous cell carcinoma (JUPITER-06): A multi-center phase 3 trial. Cancer Cell. 2022;40:277–288 e273. doi: 10.1016/j.ccell.2022.02.007. - DOI - PubMed

MeSH terms

Substances