

Reversing immunosuppression in the tumor microenvironment of fibrolamellar carcinoma via PD-1 and IL-10 blockade
- PMID: 38429349
- PMCID: PMC10907637
- DOI: 10.1038/s41598-024-55593-6
Reversing immunosuppression in the tumor microenvironment of fibrolamellar carcinoma via PD-1 and IL-10 blockade
Abstract
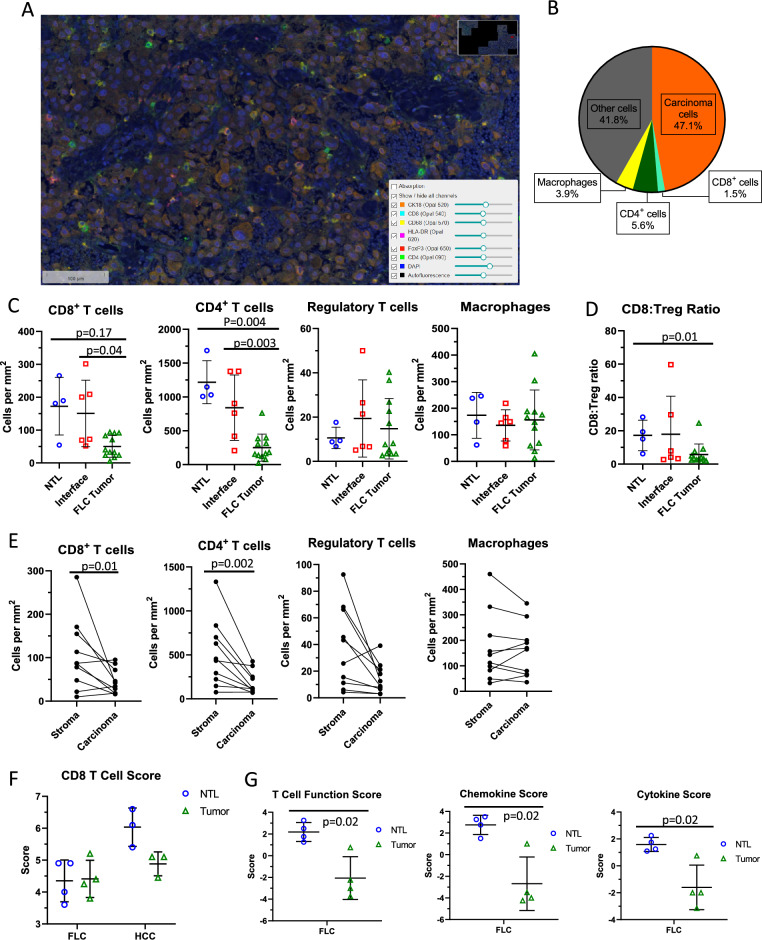
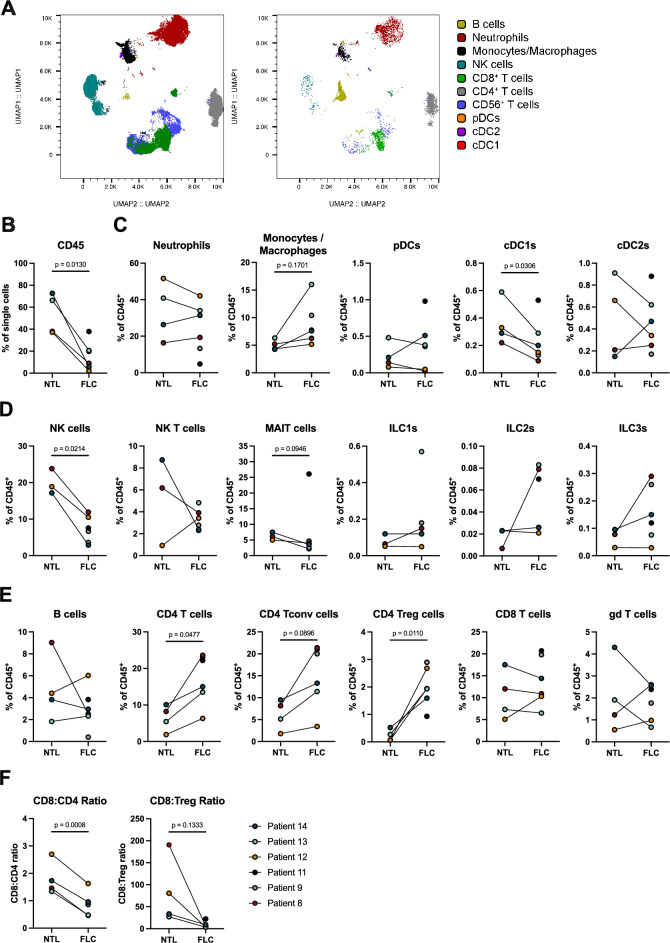
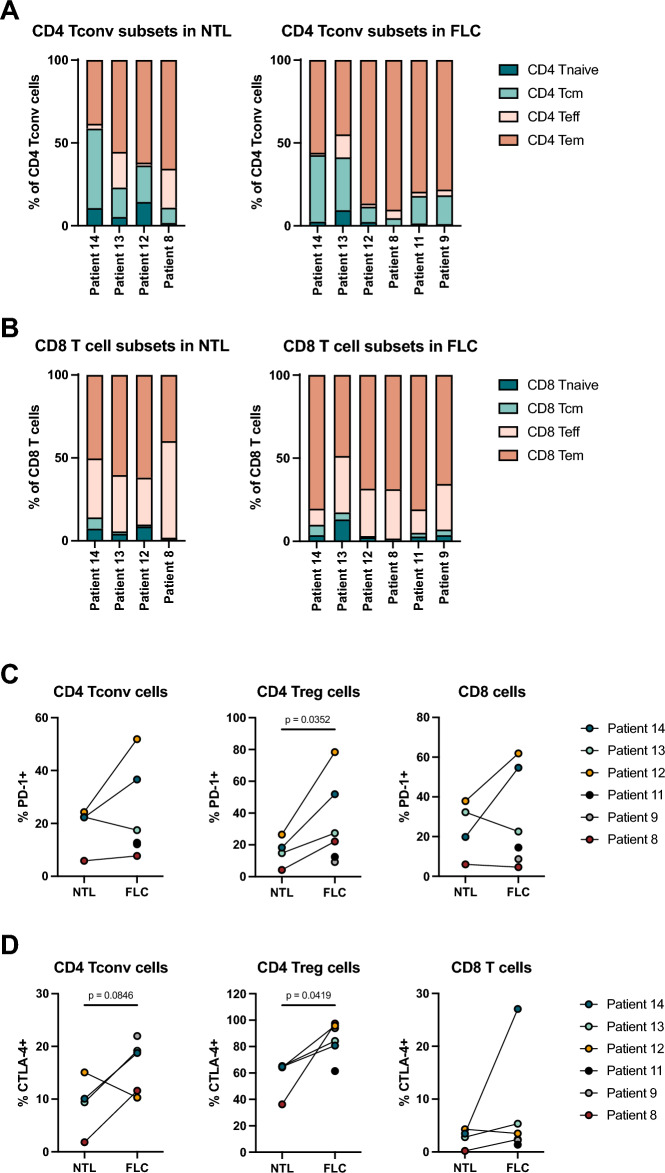
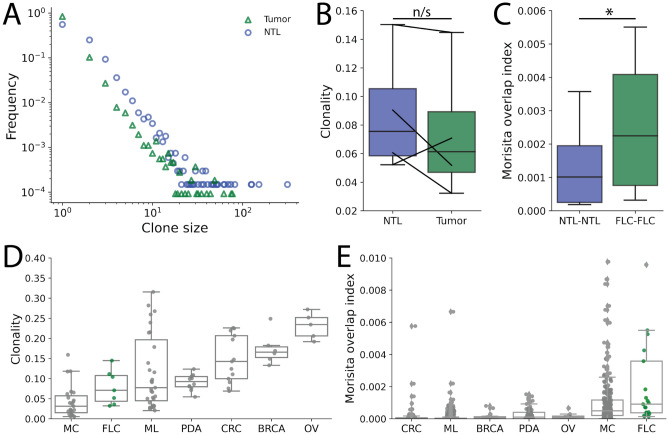
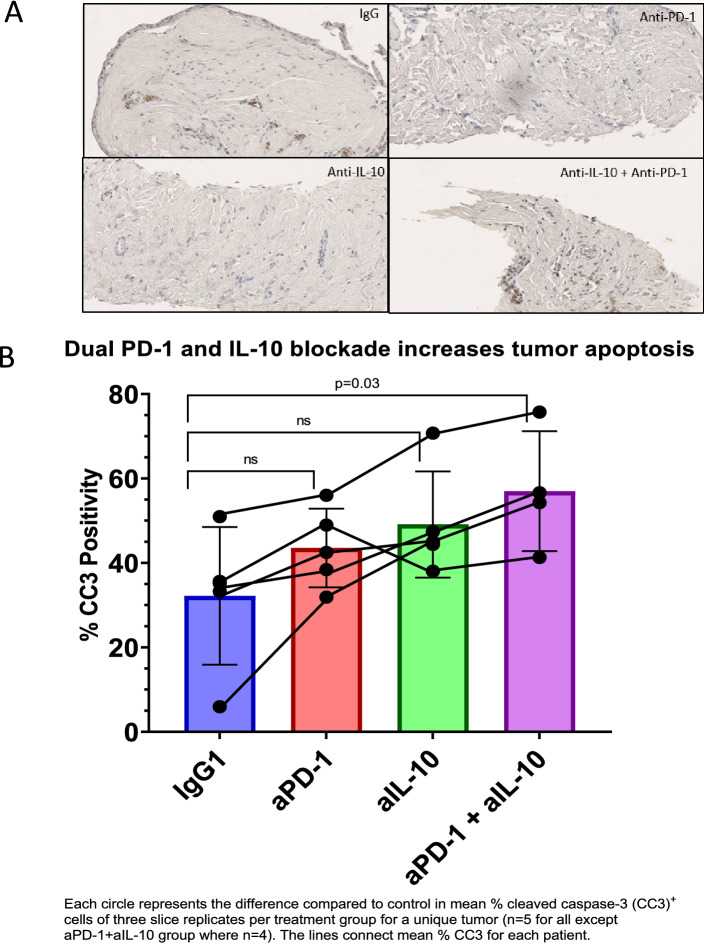
Fibrolamellar carcinoma (FLC) is a rare liver tumor driven by the DNAJ-PKAc fusion protein that affects healthy young patients. Little is known about the immune response to FLC, limiting rational design of immunotherapy. Multiplex immunohistochemistry and gene expression profiling were performed to characterize the FLC tumor immune microenvironment and adjacent non-tumor liver (NTL). Flow cytometry and T cell receptor (TCR) sequencing were performed to determine the phenotype of tumor-infiltrating immune cells and the extent of T cell clonal expansion. Fresh human FLC tumor slice cultures (TSCs) were treated with antibodies blocking programmed cell death protein-1 (PD-1) and interleukin-10 (IL-10), with results measured by cleaved caspase-3 immunohistochemistry. Immune cells were concentrated in fibrous stromal bands, rather than in the carcinoma cell compartment. In FLC, T cells demonstrated decreased activation and regulatory T cells in FLC had more frequent expression of PD-1 and CTLA-4 than in NTL. Furthermore, T cells had relatively low levels of clonal expansion despite high TCR conservation across individuals. Combination PD-1 and IL-10 blockade signficantly increased cell death in human FLC TSCs. Immunosuppresion in the FLC tumor microenvironment is characterized by T cell exclusion and exhaustion, which may be reversible with combination immunotherapy.
© 2024. The Author(s).
Conflict of interest statement
VGP is a member of the scientific advisory board for TriSalus Life Sciences. He served as a consultant for Merck & Company in 2018, GlaxoSmithKline in 2019, Imvax in 2019, Takeda in 2020, Umoja and Sensei in 2022. He has previously had research funding from AstraZeneca, Ipsen, Merck, NGM, and OncoResponse. No other disclosures. All other authors has no competing interest.
Figures
Similar articles
-
Antibodies Against Immune Checkpoint Molecules Restore Functions of Tumor-Infiltrating T Cells in Hepatocellular Carcinomas.Gastroenterology. 2017 Oct;153(4):1107-1119.e10. doi: 10.1053/j.gastro.2017.06.017. Epub 2017 Jun 23. Gastroenterology. 2017. PMID: 28648905
-
Multiple Immune-Suppressive Mechanisms in Fibrolamellar Carcinoma.Cancer Immunol Res. 2019 May;7(5):805-812. doi: 10.1158/2326-6066.CIR-18-0499. Epub 2019 Mar 22. Cancer Immunol Res. 2019. PMID: 30902819 Free PMC article.
-
Human CD14+ CTLA-4+ regulatory dendritic cells suppress T-cell response by cytotoxic T-lymphocyte antigen-4-dependent IL-10 and indoleamine-2,3-dioxygenase production in hepatocellular carcinoma.Hepatology. 2014 Feb;59(2):567-79. doi: 10.1002/hep.26694. Epub 2013 Dec 23. Hepatology. 2014. PMID: 23960017
-
Viral status, immune microenvironment and immunological response to checkpoint inhibitors in hepatocellular carcinoma.J Immunother Cancer. 2020 Apr;8(1):e000394. doi: 10.1136/jitc-2019-000394. J Immunother Cancer. 2020. PMID: 32303615 Free PMC article.
-
Anti-PD-1/PD-L1 Blockade Immunotherapy Employed in Treating Hepatitis B Virus Infection-Related Advanced Hepatocellular Carcinoma: A Literature Review.Front Immunol. 2020 May 28;11:1037. doi: 10.3389/fimmu.2020.01037. eCollection 2020. Front Immunol. 2020. PMID: 32547550 Free PMC article. Review.
Cited by
-
FusionVAC22_01: a phase I clinical trial evaluating a DNAJB1-PRKACA fusion transcript-based peptide vaccine combined with immune checkpoint inhibition for fibrolamellar hepatocellular carcinoma and other tumor entities carrying the oncogenic driver fusion.Front Oncol. 2024 Mar 28;14:1367450. doi: 10.3389/fonc.2024.1367450. eCollection 2024. Front Oncol. 2024. PMID: 38606105 Free PMC article.
-
DNAJB1-PRKACA Fusion Drives Fibrolamellar Liver Cancer through Impaired SIK Signaling and CRTC2/p300-Mediated Transcriptional Reprogramming.Cancer Discov. 2025 Feb 7;15(2):382-400. doi: 10.1158/2159-8290.CD-24-0634. Cancer Discov. 2025. PMID: 39326063 Free PMC article.
-
Landscape of targets within nucleoside metabolism for the modification of immune responses.Front Oncol. 2025 May 30;15:1483769. doi: 10.3389/fonc.2025.1483769. eCollection 2025. Front Oncol. 2025. PMID: 40519286 Free PMC article. Review.
-
Does Chemotherapy Have an Effect on the Treatment Success of Children and Adolescents with Unresectable Hepatocellular Carcinoma? Findings from the German Liver Tumour Registry.Cancers (Basel). 2025 Jul 23;17(15):2444. doi: 10.3390/cancers17152444. Cancers (Basel). 2025. PMID: 40805147 Free PMC article.
References
MeSH terms
Substances
Supplementary concepts
Grants and funding
LinkOut - more resources
Full Text Sources
Medical
Research Materials
