. 2024 Apr;5(4):642-658.
doi: 10.1038/s43018-024-00743-y. Epub 2024 Mar 1.

Sarcoma microenvironment cell states and ecosystems are associated with prognosis and predict response to immunotherapy

Affiliations

Sarcoma microenvironment cell states and ecosystems are associated with prognosis and predict response to immunotherapy

Ajay Subramanian et al. Nat Cancer. 2024 Apr.

Abstract

Characterization of the diverse malignant and stromal cell states that make up soft tissue sarcomas and their correlation with patient outcomes has proven difficult using fixed clinical specimens. Here, we employed EcoTyper, a machine-learning framework, to identify the fundamental cell states and cellular ecosystems that make up sarcomas on a large scale using bulk transcriptomes with clinical annotations. We identified and validated 23 sarcoma-specific, transcriptionally defined cell states, many of which were highly prognostic of patient outcomes across independent datasets. We discovered three conserved cellular communities or ecotypes associated with underlying genomic alterations and distinct clinical outcomes. We show that one ecotype defined by tumor-associated macrophages and epithelial-like malignant cells predicts response to immune-checkpoint inhibition but not chemotherapy and validate our findings in an independent cohort. Our results may enable identification of patients with soft tissue sarcomas who could benefit from immunotherapy and help develop new therapeutic strategies.


Conflict of interest statement

COMPETING INTERESTS STATEMENT

W.D.T. has served as a consultant/advisor for Eli Lilly, Daiichi Sankyo, Deciphera, Foghorn Therapeutics, AmMAx Bio, Novo Holdings, Servier, Medpacto, Ayala Pharmaceuticals, Kowa Research Inst., Epizyme Inc (Nexus Global Group), Bayer, Cogent Biosciences, Amgen, and PER, has received research funding from Novartis, Eli Lilly, Plexxikon, Daiichi Sankyo, Tracon Pharma, Blueprint Medicines, Immune Design, BioAlta, and Deciphera, and has a patent on companion diagnostics for CDK4 inhibitors (4/854,329). S.P.D. has served as a consultant/advisor for EMD Serono, Amgen, Nektar, Immune Design, GlaxoSmithKline, Incyte, Merck, Adaptimmune, Immunocore, Pfizer, Servier, Rain Therapeutics, GI Innovations, and Aadi Bioscience and has received research funding from EMD Serono, Amgen, Merck, Incyte, Nektar, Bristol-Meyers Squibb, and Deciphera. E.J.M. has served as a paid consultant for Guidepoint. The other authors declare no competing interests.

Figures

Extended Data Fig. 1.
Extended Data Fig. 1.. Summary of patient cohorts and datasets utilized for discovery and validation of sarcoma cell states and ecosystems.
a, Two cohorts of patients with localized soft tissue sarcomas (STSs) were analyzed. Soft tissue sarcomas profiled by the Cancer Genome Atlas (TCGA) and a previously published group of patients with undifferentiated pleomorphic sarcoma (UPS) profiled by RNA-sequencing were combined to form the training cohort. Initial identification of sarcoma cell states and ecotypes was performed in non-leiomyosarcoma (LMS) soft tissue sarcomas from TCGA, then the full training cohort was used to assess associations between cell states and ecotypes with patient outcomes. A previously published cohort of patients with localized STS profiled by microarray was used as the validation cohort for associations between cell states and ecotypes with patient outcomes. b, Cell states were validated using single-cell RNA-sequencing from 12 previously published synovial sarcomas (SS) and 4 LMS and 3 UPS new to this work. c, The spatial distributions of cell states and ecotypes were validated using spatial transcriptomics analysis of 4 STSs.
Extended Data Fig. 2.
Extended Data Fig. 2.. Identification of malignant sarcoma cells and validation of sarcoma ecotyper cell states using scRNA-Seq.
a, Representative plot of inferred copy number alterations (CNAs) in single cells clustered into two groups using inferCNV from SRC164. Amplifications and deletions are shown across each chromosome. b-d, t-SNE plots of scRNA-Seq profiles from SRC164 colored by (b) assignment to normal or malignant cells, (c) detection of CNAs, and (d) differential similarity to sarcomas of the same histology profiled by bulk RNA-Seq compared with normal cells profiled by scRNA-Seq. e, Significance of EcoTyper cell state recovery across scRNA-Seq datasets measured by permutation testing and aggregated into a meta z-score using Stouffer’s method. Z-scores>1.65 (one-sided P value<0.05) are considered significant.
Extended Data Fig. 3.
Extended Data Fig. 3.. Recovery of malignant cells across soft tissue sarcomas using CIBERSORTx.
a-b, Stacked bar plots displaying the percentage of patients with each soft tissue sarcoma histology from the training cohort with (a) fibroblast-like cells and (b) epithelial-like cells identified by CIBERSORTx. Synovial sarcoma = SS, leiomyosarcoma = LMS, malignant peripheral nerve sheath tumor = MPNST, undifferentiated pleomorphic sarcoma = UPS, liposarcoma = LPS. c, Scatter plots showing the correlation between tumor purity and the combined abundance of epithelial-like cells and fibroblast-like cells by CIBERSORTx. Spearman’s correlation coefficient and two-sided P value are displayed on the graph.
Extended Data Fig. 4.
Extended Data Fig. 4.. Characterization of epithelial-like malignant cells within soft tissue sarcomas.
a, t-SNE plots displaying expression of epithelial marker genes in malignant sarcoma cells from LMS and UPS tumors profiled by scRNA-Seq. b, t-SNE plots of epithelial vs. mesenchymal differentiation in malignant LMS and UPS cells using three previously described signatures of epithelial to mesenchymal transition. Sample and histology for each cell are displayed in Fig. 2c. The gene sets are displayed in Supplementary Table 11.
Extended Data Fig. 5.
Extended Data Fig. 5.. Association of cell state abundances with patient outcomes in the validation cohort.
a, Association of sarcoma-specific cell states identified by EcoTyper with distant metastasis-free survival in the validation cohort. Significance was assess using multivariable Cox proportional hazards models including cell state abundance as a continuous variable along with sarcoma histology. P values were calculated using two-sided Wald tests without correction for multiple comparisons. Marker genes are displayed for significantly associated cell states. Patient survival, histologies, and cell state abundances used in the analysis are shown in Supplementary Table 3. Only patients with survival data available were included in the analysis.
Extended Data Fig. 6.
Extended Data Fig. 6.. Correlation of sarcoma ecotypes across time and association with genomic alterations.
a, Scatter plots showing the correlation between ecotype abundance across different timepoints from the same patient. Spearman’s correlation coefficients and two-sided P values are displayed. The lines of best fit by linear regression and 95% confidence intervals for the lines of best fit are shown on the graph. The data used for this analysis are shown in Supplementary Table 20. b,c, Box plots displaying (b) the total number of high impact SNVs/Indels and (c) normalized contribution of COSMIC mutational signatures 1, 5, and 13 by sarcoma ecotype (n=79 SE1, 78 SE2, and 33 SE3 sarcomas for both panels). P values were calculated using Kruskal-Wallis tests followed by Dunn’s tests for pairwise comparisons. Boxes show median and quartiles, and whiskers extend to the minimum and maximum value.
Extended Data Fig. 7.
Extended Data Fig. 7.. Validation of sarcoma ecotypes using spatial transcriptomics.
a, Distribution of cell states from sarcoma ecotype 3 (SE3) in SCR93, a sarcoma profiled by spatial transcriptomics. Abundance of the cell states that make up SE3 within each spatial transcriptomics spot are shown, and fibroblast-like cell abundance is plotted to show the tumor outline. b, Heatmaps displaying Spearman correlation of cell state abundances within spatial transcriptomics spots. c, Distribution of sarcoma ecotypes in three sarcomas profiled by spatial transcriptomics. H&E staining along with the abundance of SEs within each spatial transcriptomics spot are shown. Fibroblast-like cell abundance is plotted to show the tumor outline. Scale bars show 1000 μm. A total of four sarcomas were profiled, and SRC93 is displayed in Fig. 5f.
Extended Data Fig. 8.
Extended Data Fig. 8.. Summary of advanced soft tissue sarcoma cohorts.
Two cohorts of patients with advanced soft tissue sarcoma treated at Stanford were analyzed based on the type of systemic therapy received. Patients treated with both chemotherapy and ipilimumab/nivolumab were included in both cohorts. The ICI validation cohort consisted of patients with advanced soft tissue sarcomas treated with anti-PD-1 antibodies (pembrolizumab or nivolumab) in combination with experimental immunotherapies (talimogene laherparepvec=T-VEC, bempegaldesleukin=NKTR-214, or epacadostat) as part of 3 clinical trials.
Extended Data Fig. 9.
Extended Data Fig. 9.. Association of sarcoma ecotypes with response to ICI and chemotherapy.
a, Plot of SE3 abundance in patients with and without 6-month non-progression after starting ipilimumab and nivolumab (n=8 patients with and 30 patients without 6-month non-progression). P value was calculated using a two-sided Mann-Whitney U-test. b, Receiver operating characteristic curves for prediction of 6-month non-progression on ipilimumab and nivolumab by SE3 abundance, PD-L1 expression, and the presence of tertiary lymphoid structures (TLS). Area under the curve (AUC) and 95% confidence intervals (95% CI) are displayed on the graph. c, Box plot of PD-L1 combined positive score across sarcoma ecotypes (n=10 SE1, 14 SE2, and 4 SE3 sarcomas). P values were calculated using Kruskal-Wallis tests followed by Dunn’s tests for pairwise comparisons. Boxes show median and quartiles, and whiskers extend to the minimum and maximum value. d, Stacked bar plot of the presence of tertiary lymphoid structures across sarcoma ecotypes. P values were calculated using two-sided Fisher’s exact tests. e, Waterfall plot showing the best response by RECIST criteria for patients with advanced STSs treated with chemotherapy based on sarcoma ecotype assignment. Horizontal dotted lines represent the criteria for progressive disease (20% increase) and partial response (30% decrease). Patients with only non-target disease are plotted at 0%. f, Plot of SE3 abundance in patients with and without a response to chemotherapy (n=6 responders and 31 non-responders). P value was calculated using a two-sided Mann-Whitney U-test. g, Receiver operating characteristic curves for prediction of response to chemotherapy by SE3 abundance. AUC and 95% CI are displayed on the graph. Patient survival, treatment response, tumor characteristics, ecotype assignments, and ecotype abundances used in the analysis of the chemotherapy and ipilimumab/nivolumab cohorts are shown in Supplementary Tables 18–20. For panels c, d, and e, patients were analyzed based on ecotype assignment, and patients not assigned to an ecotype were not included. For panels a, b, f, and g, patients were analyzed based on ecotype abundance, and all patients were included in the analysis.
Extended Data Fig. 10.
Extended Data Fig. 10.. Validation of ICI response prediction by SE3 abundance and changes in sarcoma cell states and ecotypes during treatment with ICI.
a, Receiver operating characteristic curve and area under the curve (AUC) with 95% confidence intervals (95% CI) for prediction of treatment response in the ICI validation cohort. b, Areas under the curve for prediction of response to immune checkpoint inhibition based on SE3 abundance in patients with metastatic bladder cancer and melanoma (n=348 bladder anti-PD-L1, 172 melanoma anti-PD-1, and 51 melanoma anti-CTLA-4). Error bars display the 95% confidence interval. c, Heatmap of fold change in cell state and sarcoma ecotype abundances on-treatment in the ICI validation cohort. Adjusted P values comparing pre-treatment and on-treatment samples are displayed. P values were calculated using two-sided Wilcoxon signed-rank tests and corrected for multiple hypothesis testing. Patient treatment response and ecotype abundances used in analysis of the ICI validation cohort and bladder/melanoma cohorts are shown in Supplementary Table 21 and Supplementary Table 22, respectively.
Fig. 1.
Fig. 1.. A machine-learning framework for large-scale identification and validation of sarcoma cell states and ecosystems.
a, Schematic showing the implementation of EcoTyper in patients with soft tissue sarcoma. Cell states and ecotypes were initially discovered in a training cohort of patients with localized soft tissue sarcoma profiled with RNA-Seq followed by validation in a separate cohort of patients with localized soft tissue sarcoma with gene expression analyzed by microarray. Cell type-specific gene expression was purified from bulk transcriptomic data prior to identification of transcriptional states for each cell type. Cell states were validated via single-cell RNA-Seq, and the associations between cell state abundances and patient outcomes were analyzed. Sarcoma ecotypes were discovered by determining the co-occurrence patterns between cell states, and the spatial distribution of the ecotypes and cell states was validated using spatial transcriptomics. Finally, the association between sarcoma ecotypes and patient outcomes was analyzed. Three cohorts of patients with advanced soft tissue sarcoma were analyzed with bulk RNA-Seq, including two independent cohorts of patients treated with immune checkpoint inhibition and a cohort of patients treated with standard of care cytotoxic chemotherapy. See also Extended Data Figs. 1 and 8.
Fig. 2.
Fig. 2.. Discovery and characterization of sarcoma-specific cell states.
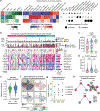
a, UMAP plots of cell type-specific GEPs purified by CIBERSORTx from sarcomas profiled by bulk RNA-Seq in the training cohort. Each point represents one sample colored by the most abundant cell state. b, Heat maps showing expression of cell state marker genes (rows) across scRNA-Seq datasets spanning three sarcoma histologies (columns). Average log2 fold change is displayed for each cell state compared with the other cells of the same type. Only cell states with at least 15 assigned cells in each scRNA-Seq dataset are shown. See Supplementary Table 8. c-e, t-SNE plots of LMS and UPS malignant cell scRNA-Seq profiles colored by (c) tumor sample, (d) epithelial differentiation score measured by gene expression modules defined in synovial sarcomas, and (e) sarcoma cell type assignment based on the epithelial differentiation score. The epithelial differentiation score was calculated by subtracting the mesenchymal module score from the epithelial module score as described in the Methods. f, Representative sarcoma cores showing expression of epithelial markers CDH1, MUC1, and SDC1 by immunohistochemistry. A total of 128 cores were stained for each marker. g, Stacked bar plots displaying the percentage of patients across soft tissue sarcoma histologies with CDH1, MUC1, or SDC1 detected by immunohistochemistry. Synovial sarcoma = SS, leiomyosarcoma = LMS, malignant peripheral nerve sheath tumor = MPNST, undifferentiated pleomorphic sarcoma = UPS, liposarcoma = LPS. See Supplementary Table 12.
Fig. 3.
Fig. 3.. Association of cell state abundances with patient outcomes across cohorts.
a, Association of sarcoma-specific cell states identified by EcoTyper with PFS in the training cohort. Significance was assessed using multivariable Cox proportional hazards models including cell state abundance as a continuous variable along with sarcoma histology. P values were calculated using two-sided Wald tests without correction for multiple comparisons. Marker genes are displayed for significantly associated cell states. b, Scatter plot showing the correlation between cell state survival associations in the training (RNA-Seq) cohort and the validation (Microarray) cohort. Survival associations are displayed as −log10p-values multiplied by 1 if the state is associated with shorter survival and −1 if associated with favorable outcomes. Spearman’s correlation coefficient and two-sided P values are displayed. The line of best fit by linear regression and 95% confidence intervals of the line of best fit are shown on the graph. c,d, Kaplan-Meier plots showing survival outcomes stratified by the abundance of (c) S01 monocytes/macrophages or (d) S02 endothelial cells. The optimal threshold was defined in the training cohort and applied to the validation cohort. P values were calculated using two-sided log-rank tests. Patient survival, histologies, and cell state abundances used in the analysis of the training and validation cohorts are shown in Supplementary Table 2 and Supplementary Table 3, respectively. Only patients with survival data available were included in the analysis.
Fig. 4.
Fig. 4.. Discovery of sarcoma multicellular communities.
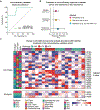
a, Heatmap of cell state abundances across STSs of different histologies from the discovery cohort separated into three sarcoma ecotypes (SEs). Only cell states and tumor samples assigned to SEs are displayed. b, Network diagrams displaying SE composition. The length of each edge represents the Jaccard index across sarcomas from the training cohort. c, River plots showing the overlap between sarcoma ecotypes and sarcoma immune classes and CINSARC signatures. The thickness of each bar represents the percent of patients within each group.
Fig. 5.
Fig. 5.. Characterization of sarcoma ecotypes.
a, Plot of sarcoma ecotype biologic features in the training cohort. Left panel shows the percentage of each STS histology assigned to each sarcoma ecotype. Middle panel shows the relative abundance of 9 canonical cell types. Right panel shows significantly enriched patient features and hallmark gene sets. Additional features are shown in Supplementary Table 13. b, Plot of genomic alterations from TCGA by sarcoma ecotype assignment. Top two panels show total number of high impact SNVs/indels and total number of genes with a CNA. Bottom two panels display the genes most altered by SNVs/indels and genes enriched for CNAs in SE3. Adjusted P values were calculated using two-sided Fisher’s exact tests corrected for multiple hypothesis testing. For CNAs, representative genes from each genomic region are displayed. c,d, Box plots displaying (c) the total number of genes with CNAs (n=60 SE1, 67 SE2, and 29 SE3 samples) or (d) the normalized contribution of COSMIC mutational signature 2 by sarcoma ecotype (n=79 SE1, 78 SE2, and 33 SE3 sarcomas). P values were calculated using Kruskal-Wallis tests followed by Dunn’s tests for pairwise comparisons. Boxes show median and quartiles, and whiskers extend to the minimum and maximum value. e, Violin plot comparing the Spearman spatial correlations between cell states in different ecotypes versus cell states within the same ecotype. P value was calculated using a two-sided Mann-Whitney U test. f, Distribution of sarcoma ecotypes in an STS (SRC93) profiled by spatial transcriptomics. H&E staining along with the abundance of SEs within each spatial transcriptomics spot are shown. Fibroblast-like cell abundance is plotted to show the tumor outline. Scale bar shows 1000 μm. A total of four sarcomas were profiled, and the other sarcomas are displayed in Extended Data Fig. 7c. g, Spatial aggregation of sarcoma ecotypes by spatial transcriptomics measured using Moran’s I (n=4 samples). A z-score>1.96 is considered significantly more aggregated than expected by chance. h, Network diagrams displaying putative ligand-receptor interactions between cell states within each sarcoma ecotype. The arrows represent the direction of ligand to receptor signaling.
Fig. 6.
Fig. 6.. Association of sarcoma ecotypes with patient outcomes.
a, Kaplan-Meier plot of progression-free survival in the training cohort stratified by sarcoma ecotype assignment. P values calculated using pairwise two-sided log-rank tests with correction for multiple hypothesis testing. b, Multivariable Cox proportional hazard ratios for progression-free survival in the training cohort based on sarcoma ecotype abundance including sarcoma histology as a variable (n=238 patients). Error bars display the 95% confidence interval. c, Kaplan-Meier plot of distant metastasis-free survival in the validation cohort stratified by sarcoma ecotype assignment. P values were calculated using pairwise two-sided log-rank tests with correction for multiple hypothesis testing. d, Multivariable Cox proportional hazard ratios for distant metastasis-free survival in the validation cohort based on sarcoma ecotype abundance including sarcoma histology as a variable (n=309 patients). Error bars display the 95% confidence interval. Patient survival, histologies, ecotype assignments, and ecotype abundances used in the analysis of the training and validation cohorts are shown in Supplementary Table 2 and Supplementary Table 3, respectively. For panels a and c, patients were analyzed based on ecotype assignment, and patients not assigned to an ecotype were not included. For panels b and d, patients were analyzed based on ecotype abundance, and all patients with survival data available were included in the analysis.
Fig. 7.
Fig. 7.. Predicting STS response to immune checkpoint inhibition with sarcoma ecotypes.
a, Kaplan-Meier plot of progression-free survival in patients with advanced STSs treated with standard of care chemotherapy stratified by sarcoma ecotype assignment. P values calculated using pairwise two-sided log-rank tests with correction for multiple hypothesis testing. b, Multivariable Cox proportional hazard ratios for progression free survival in patients with advanced STSs treated with standard of care chemotherapy based on sarcoma ecotype abundance including sarcoma histology as a variable (n=37 patients). Error bars display the 95% confidence interval. c, Kaplan-Meier plot of progression-free survival in patients with advanced STSs treated with ipilimumab and nivolumab stratified by sarcoma ecotype assignment. P values were calculated using pairwise two-sided log-rank tests with correction for multiple hypothesis testing. d, Multivariable Cox proportional hazard ratios for progression-free survival in patients with advanced STSs treated with ipilimumab and nivolumab based on sarcoma ecotype abundance including sarcoma histology as a variable (n=38 patients). Error bars display the 95% confidence interval. e, Waterfall plot showing the best response by RECIST criteria for patients with advanced STSs treated with ipilimumab and nivolumab based on sarcoma ecotype assignment. Horizontal dotted lines represent the criteria for progressive disease (20% increase) and partial response (30% decrease). f, Plot of SE3 abundance in patients with and without a response to ipilimumab and nivolumab (n=4 responders and 34 non-responders). P value was calculated using a two-sided Mann-Whitney U-test. g, Receiver operating characteristic curves for prediction of response to ipilimumab and nivolumab by SE3 abundance, PD-L1 expression, and the presence of tertiary lymphoid structures (TLS). Area under the curve (AUC) and 95% confidence intervals (95% CI) are displayed on the graph. Patient survival, treatment response, histologies, ecotype assignments, and ecotype abundances used in the analysis of the chemotherapy and ipilimumab/nivolumab cohorts are shown in Supplementary Tables 18–20. For panels a, c, and e, patients were analyzed based on ecotype assignment, and patients not assigned to an ecotype were not included. For panels b, d, f, and g, patients were analyzed based on ecotype abundance, and all patients were included in the analysis.
Fig. 8.
Fig. 8.. Validation of SE3 as a predictor of response to ICI in soft tissue sarcomas.
a, Waterfall plot showing the best response by RECIST criteria measured by percentage change in the sum of target lesion diameters for patients with advanced STSs in the ICI validation cohort based on sarcoma ecotype assignment. Horizontal dotted lines represent the criteria for progressive disease (20% increase) and partial response (30% decrease). Only patients assigned to sarcoma ecotypes are displayed. b, Plot of SE3 abundance in patients with and without a response to ICI in the validation cohort (n=6 responders and 23 non-responders). c, Stacked bar plot demonstrating the percent of ICI responders in the training and validation cohorts stratified by high and low SE3 abundance. The optimal cutoff for SE3 abundance was defined in the training cohort and applied to the validation cohort. P values were calculated using two-sided Fisher’s exact tests. d,e, Mean distance of (d) CD8 T cell states from SE3 spots (n=1963 spots) and (e) sarcoma ecotypes from S01 CD8 T cells (n=3352 SE1, 2061 SE2, and 1963 SE3 spots) in sarcomas profiled by spatial transcriptomics. P values were calculated using Kruskal-Wallis tests followed by Dunn’s tests for pairwise comparisons. Boxes show median and quartiles, and whiskers extend to the minimum and maximum value. f,g, Pre-treatment (Pre-Tx) and on-treatment (On-Tx) abundance of (f) S01 CD8 T cells and (g) S01 monocytes/macrophages in the ICI validation cohort (n=19 paired samples). P values were calculated using two-sided Wilcoxon signed-rank tests. Patient treatment response, ecotype assignments, and ecotype abundances used in the ICI validation cohort analysis are shown in Supplementary Table 21. For panel a, patients were analyzed based on ecotype assignment, and patients not assigned to an ecotype were not included. For panels b and c, patients were analyzed based on ecotype abundance, and all patients were included in the analysis.

References

    1. Dufresne A, Brahmi M, Karanian M, and Blay J-Y (2018). Using biology to guide the treatment of sarcomas and aggressive connective-tissue tumours. Nat Rev Clin Oncol 15, 443–458. 10.1038/s41571-018-0012-4. - DOI - PubMed
    1. Wang D, Zhang Q, Eisenberg BL, Kane JM, Li XA, Lucas D, Petersen IA, DeLaney TF, Freeman CR, Finkelstein SE, et al. (2015). Significant Reduction of Late Toxicities in Patients With Extremity Sarcoma Treated With Image-Guided Radiation Therapy to a Reduced Target Volume: Results of Radiation Therapy Oncology Group RTOG-0630 Trial. J. Clin. Oncol 33, 2231–2238. 10.1200/JCO.2014.58.5828. - DOI - PMC - PubMed
    1. Judson I, Verweij J, Gelderblom H, Hartmann JT, Schöffski P, Blay J-Y, Kerst JM, Sufliarsky J, Whelan J, Hohenberger P, et al. (2014). Doxorubicin alone versus intensified doxorubicin plus ifosfamide for first-line treatment of advanced or metastatic soft-tissue sarcoma: a randomised controlled phase 3 trial. Lancet Oncol. 15, 415–423. 10.1016/S1470-2045(14)70063-4. - DOI - PubMed
    1. Ryan CW, Merimsky O, Agulnik M, Blay J-Y, Schuetze SM, Van Tine BA, Jones RL, Elias AD, Choy E, Alcindor T, et al. (2016). PICASSO III: A Phase III, Placebo-Controlled Study of Doxorubicin With or Without Palifosfamide in Patients With Metastatic Soft Tissue Sarcoma. J Clin Oncol 34, 3898–3905. 10.1200/JCO.2016.67.6684. - DOI - PubMed
    1. Tap WD, Papai Z, Van Tine BA, Attia S, Ganjoo KN, Jones RL, Schuetze S, Reed D, Chawla SP, Riedel RF, et al. (2017). Doxorubicin plus evofosfamide versus doxorubicin alone in locally advanced, unresectable or metastatic soft-tissue sarcoma (TH CR-406/SARC021): an international, multicentre, open-label, randomised phase 3 trial. Lancet Oncol 18, 1089–1103. 10.1016/S1470-2045(17)30381-9. - DOI - PMC - PubMed

Methods-only references

    1. Tatlow PJ, and Piccolo SR (2016). A cloud-based workflow to quantify transcript-expression levels in public cancer compendia. Sci Rep 6, 39259. 10.1038/srep39259. - DOI - PMC - PubMed
    1. Patro R, Duggal G, Love MI, Irizarry RA, and Kingsford C (2017). Salmon provides fast and bias-aware quantification of transcript expression. Nat Methods 14, 417–419. 10.1038/nmeth.4197. - DOI - PMC - PubMed
    1. Hubbell E, Liu W-M, and Mei R (2002). Robust estimators for expression analysis. Bioinformatics 18, 1585–1592. 10.1093/bioinformatics/18.12.1585. - DOI - PubMed
    1. Mankin HJ, Hornicek FJ, DeLaney TF, Harmon DC, and Schiller AL (2012). Pleomorphic spindle cell sarcoma (PSCS) formerly known as malignant fibrous histiocytoma (MFH): a complex malignant soft-tissue tumor. Musculoskelet Surg 96, 171–177. 10.1007/s12306-012-0225-0. - DOI - PubMed
    1. Bui NQ, Nemat-Gorgani N, Subramanian A, Torres IA, Lohman M, Sears TJ, van de Rijn M, Charville GW, Becker H-C, Wang DS, et al. (2023). Monitoring Sarcoma Response to Immune Checkpoint Inhibition and Local Cryotherapy with Circulating Tumor DNA Analysis. Clin Cancer Res 29, 2612–2620. 10.1158/1078-0432.CCR-23-0250. - DOI - PubMed

Publication types

Substances