. 2024 Mar;9(3):614-630.
doi: 10.1038/s41564-024-01617-w. Epub 2024 Mar 1.

Altered microbial bile acid metabolism exacerbates T cell-driven inflammation during graft-versus-host disease

Affiliations

Altered microbial bile acid metabolism exacerbates T cell-driven inflammation during graft-versus-host disease

Sarah Lindner et al. Nat Microbiol. 2024 Mar.

Abstract

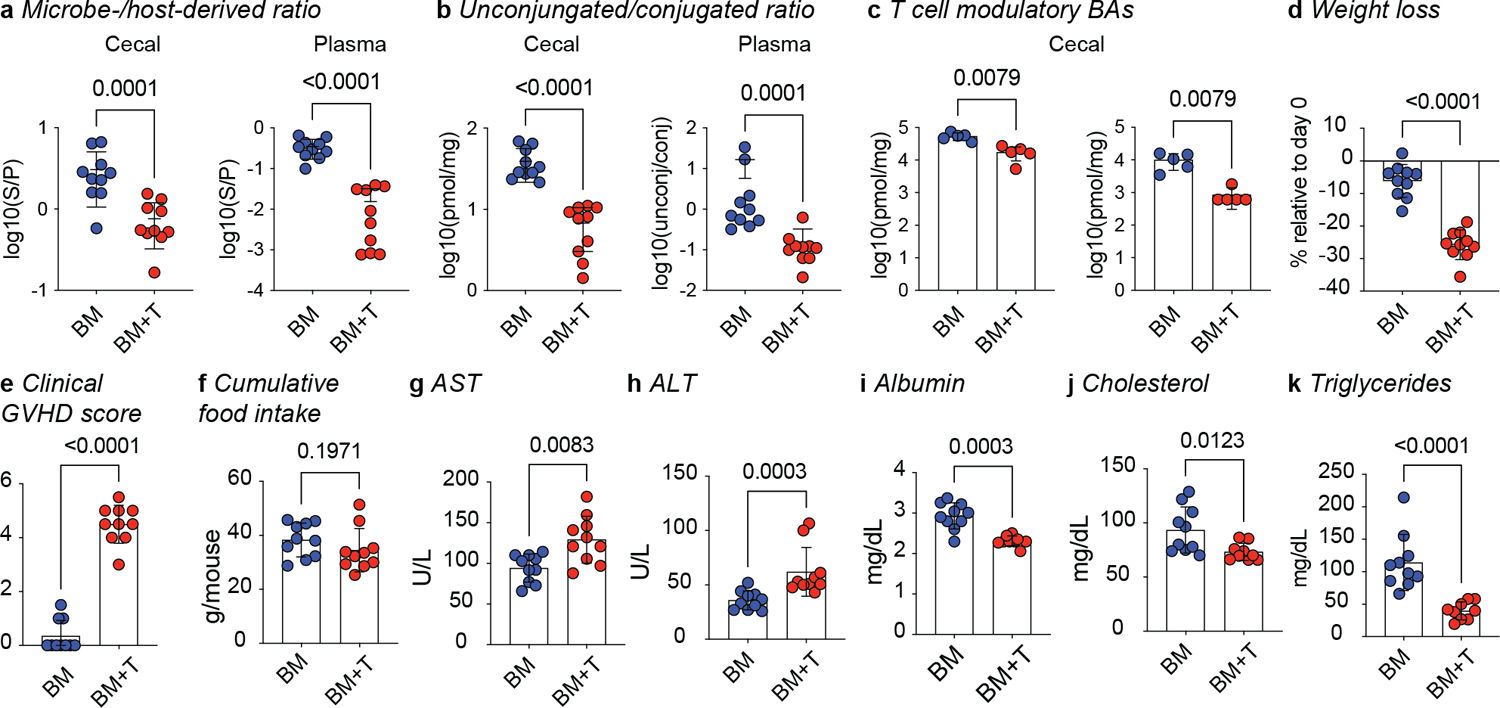
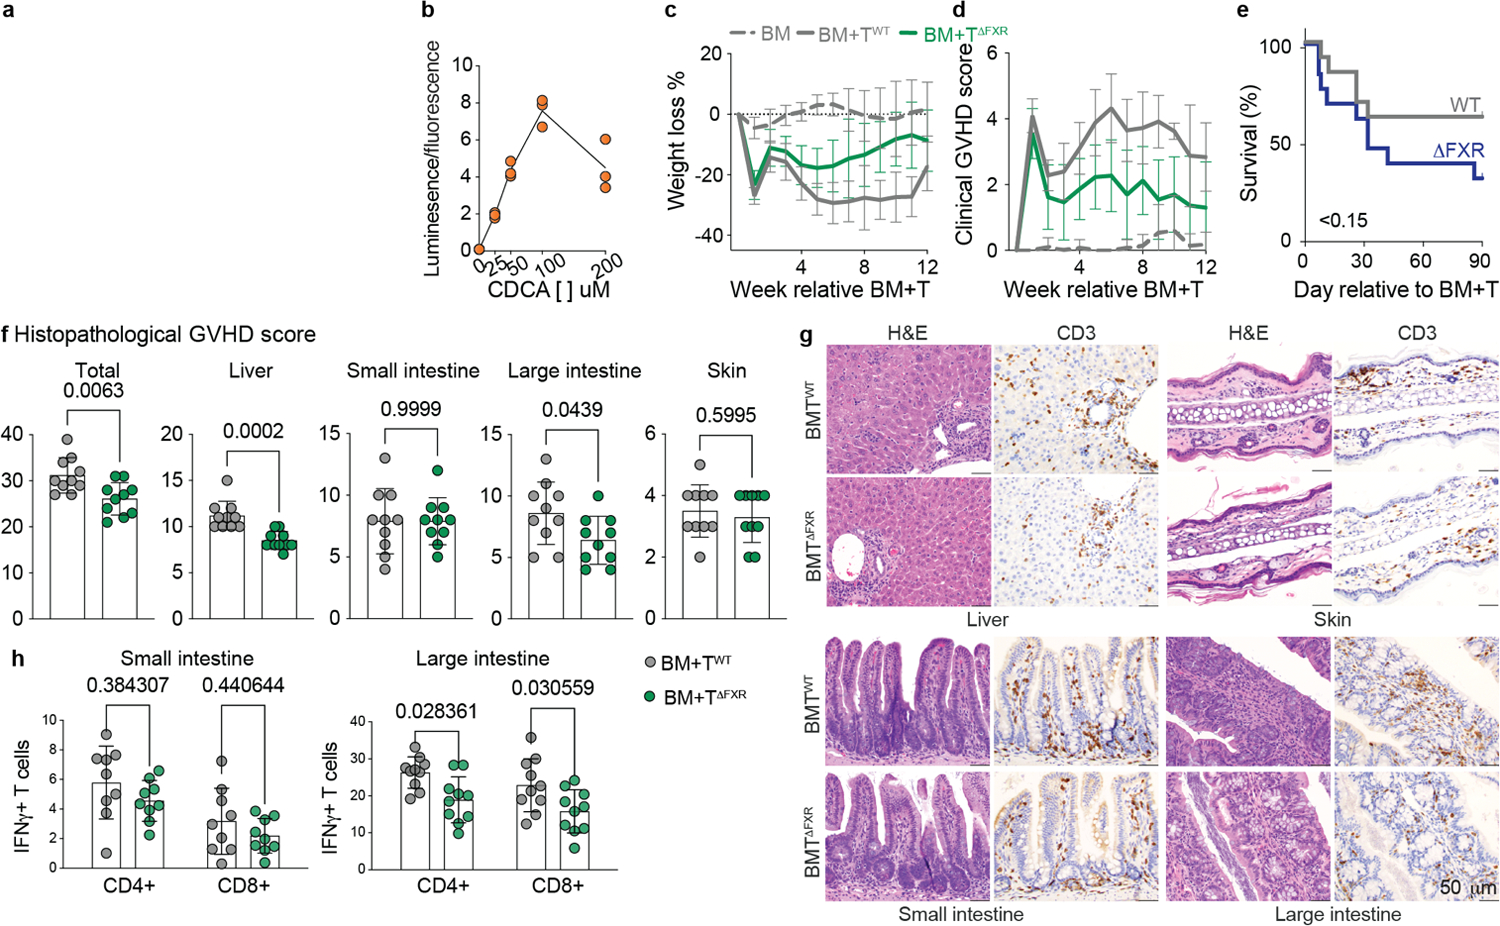
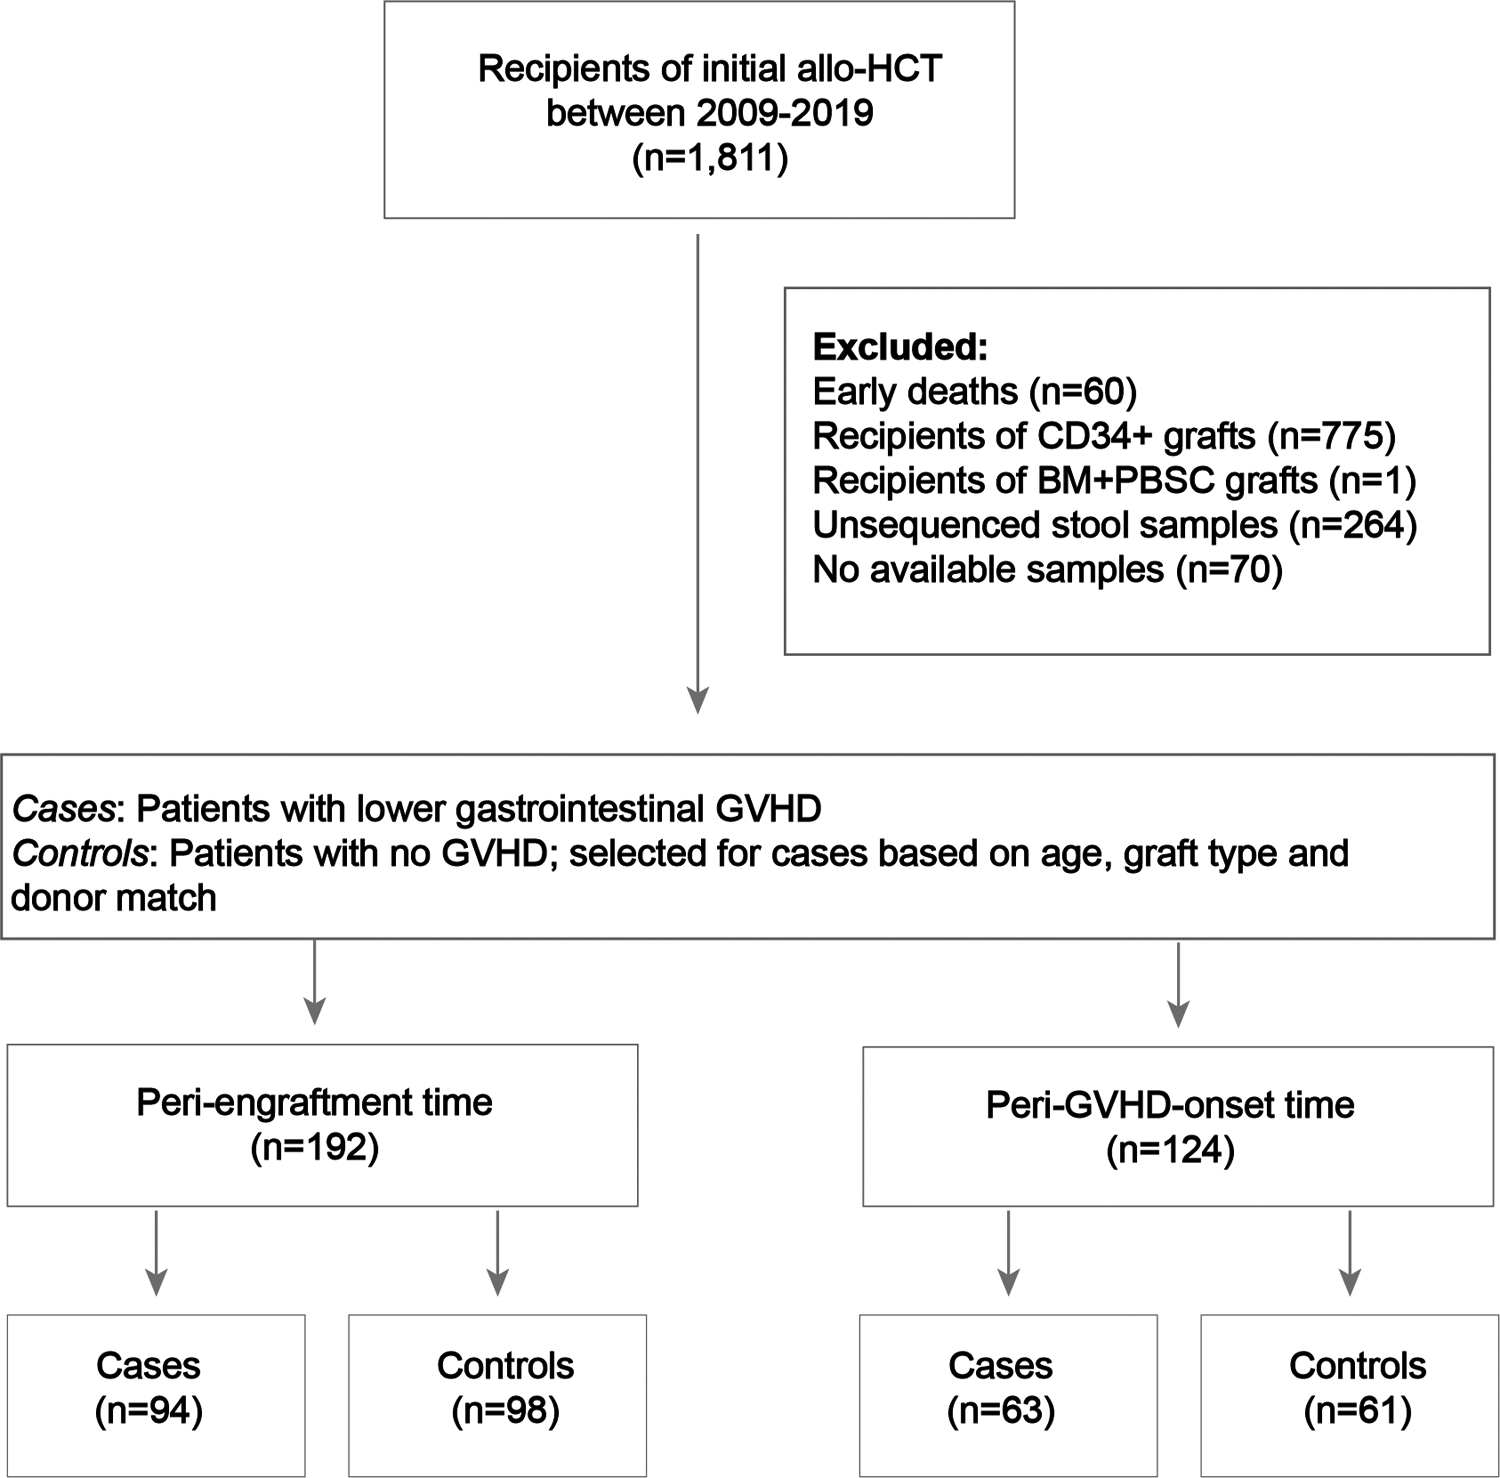
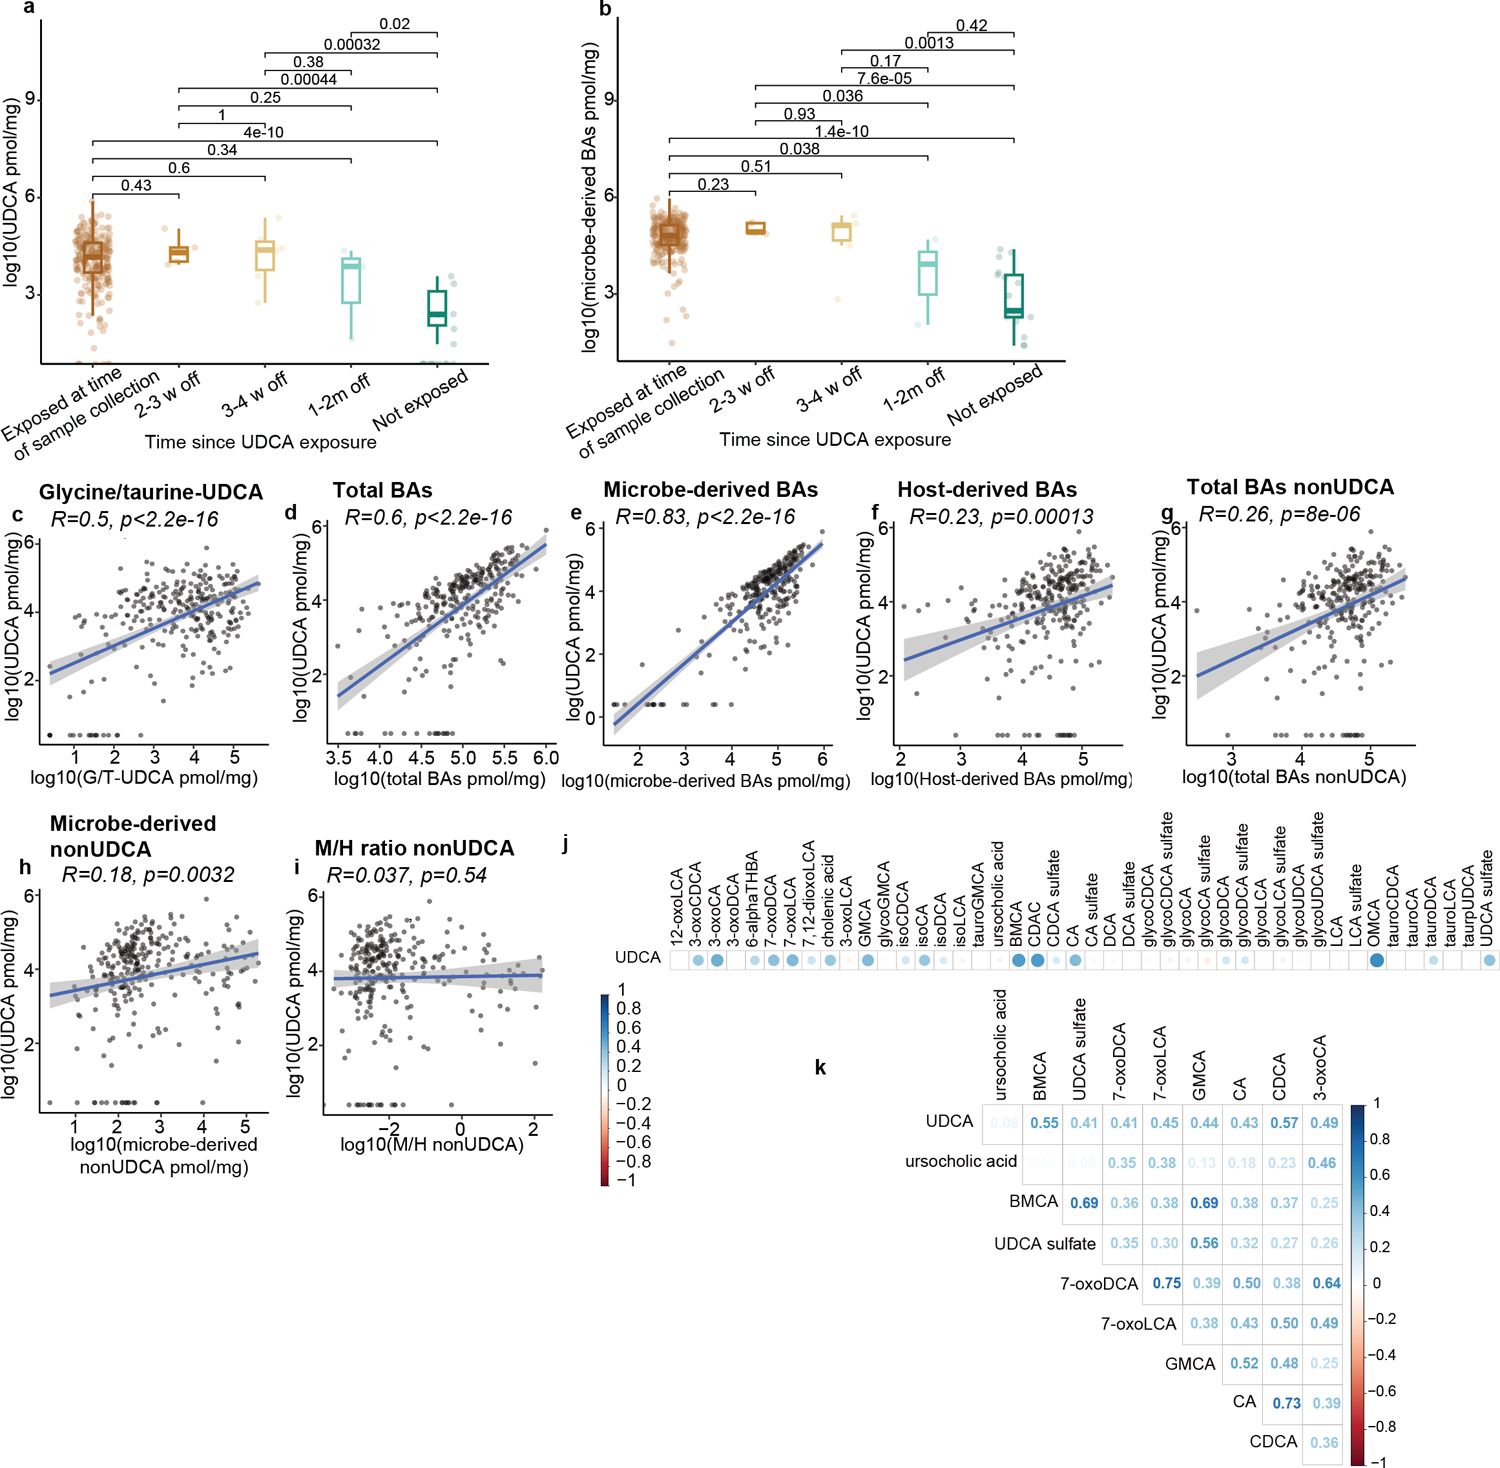
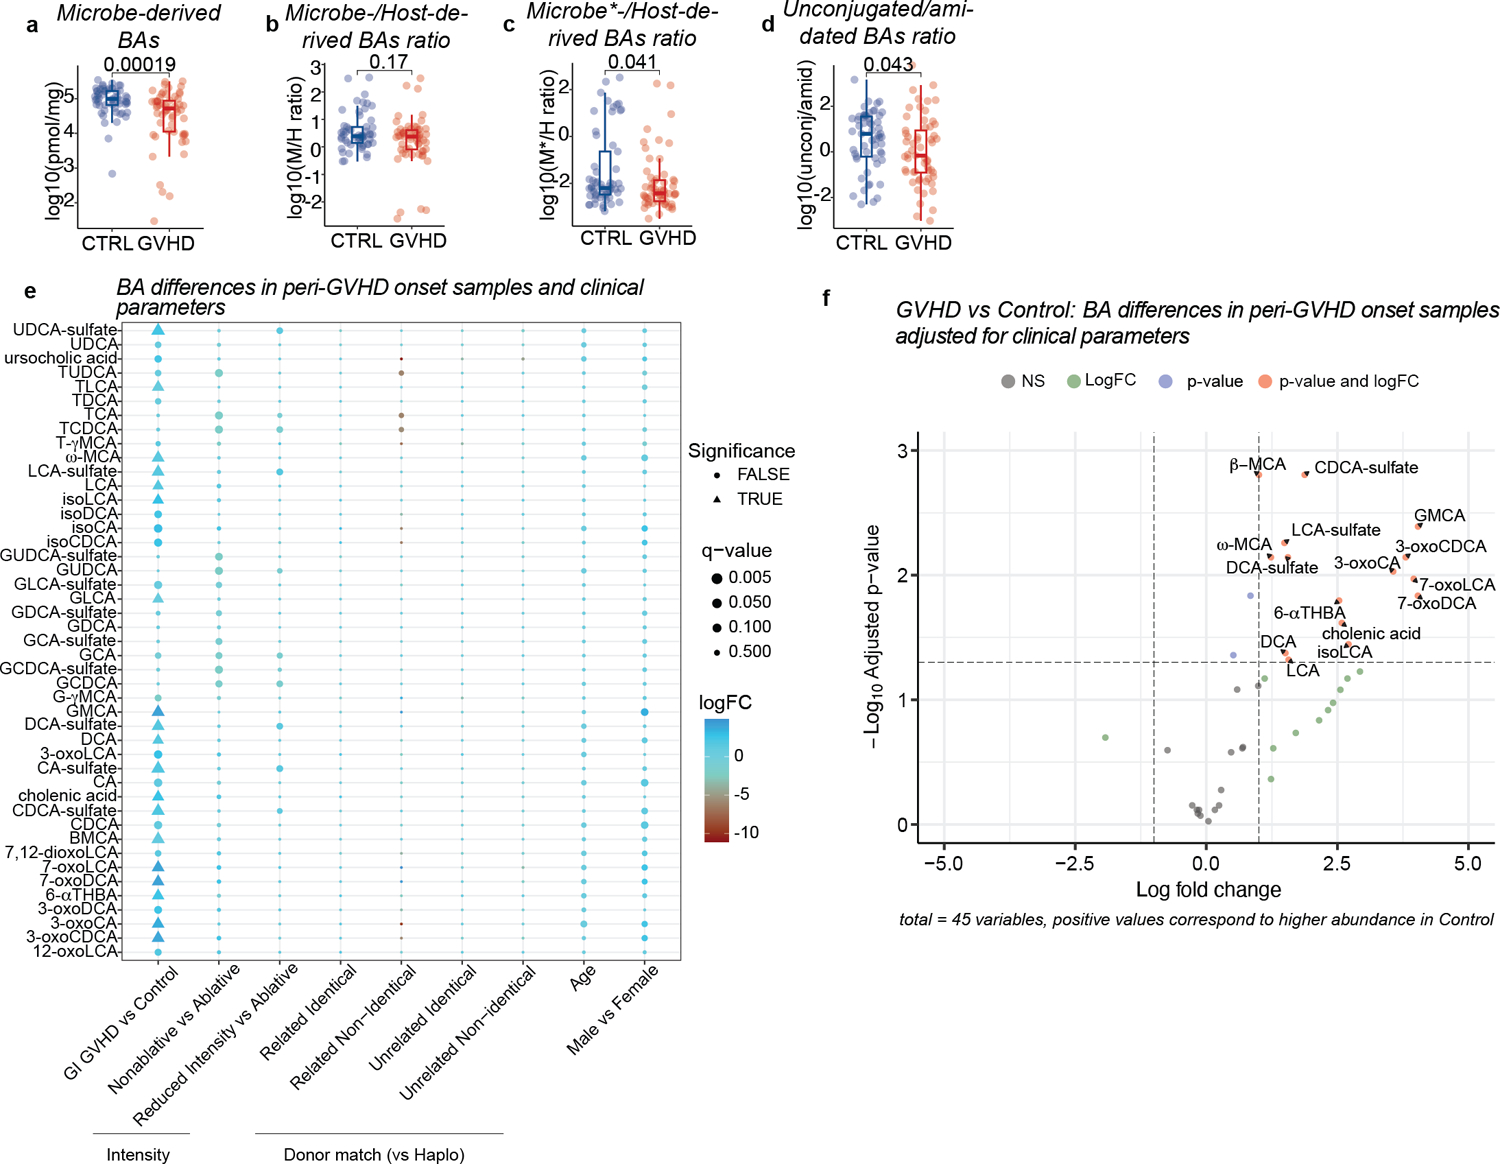
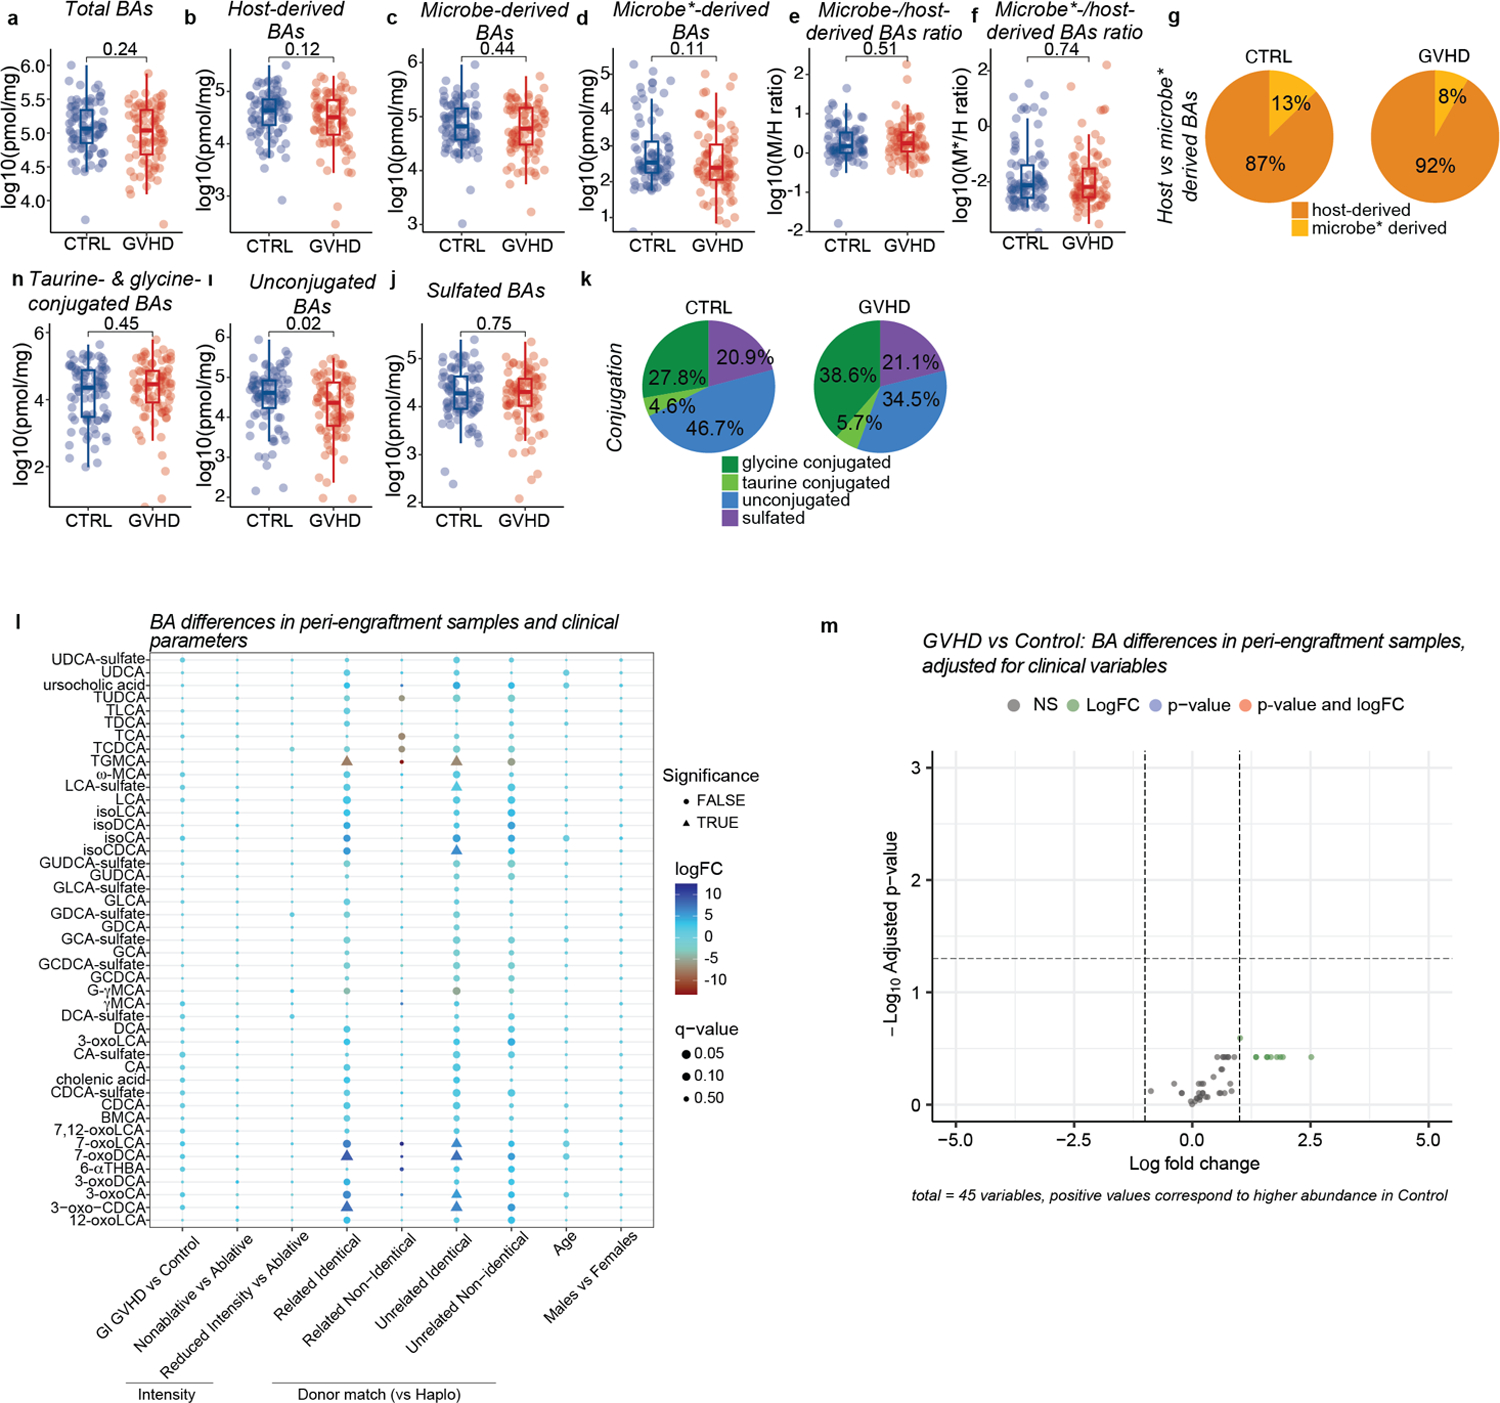
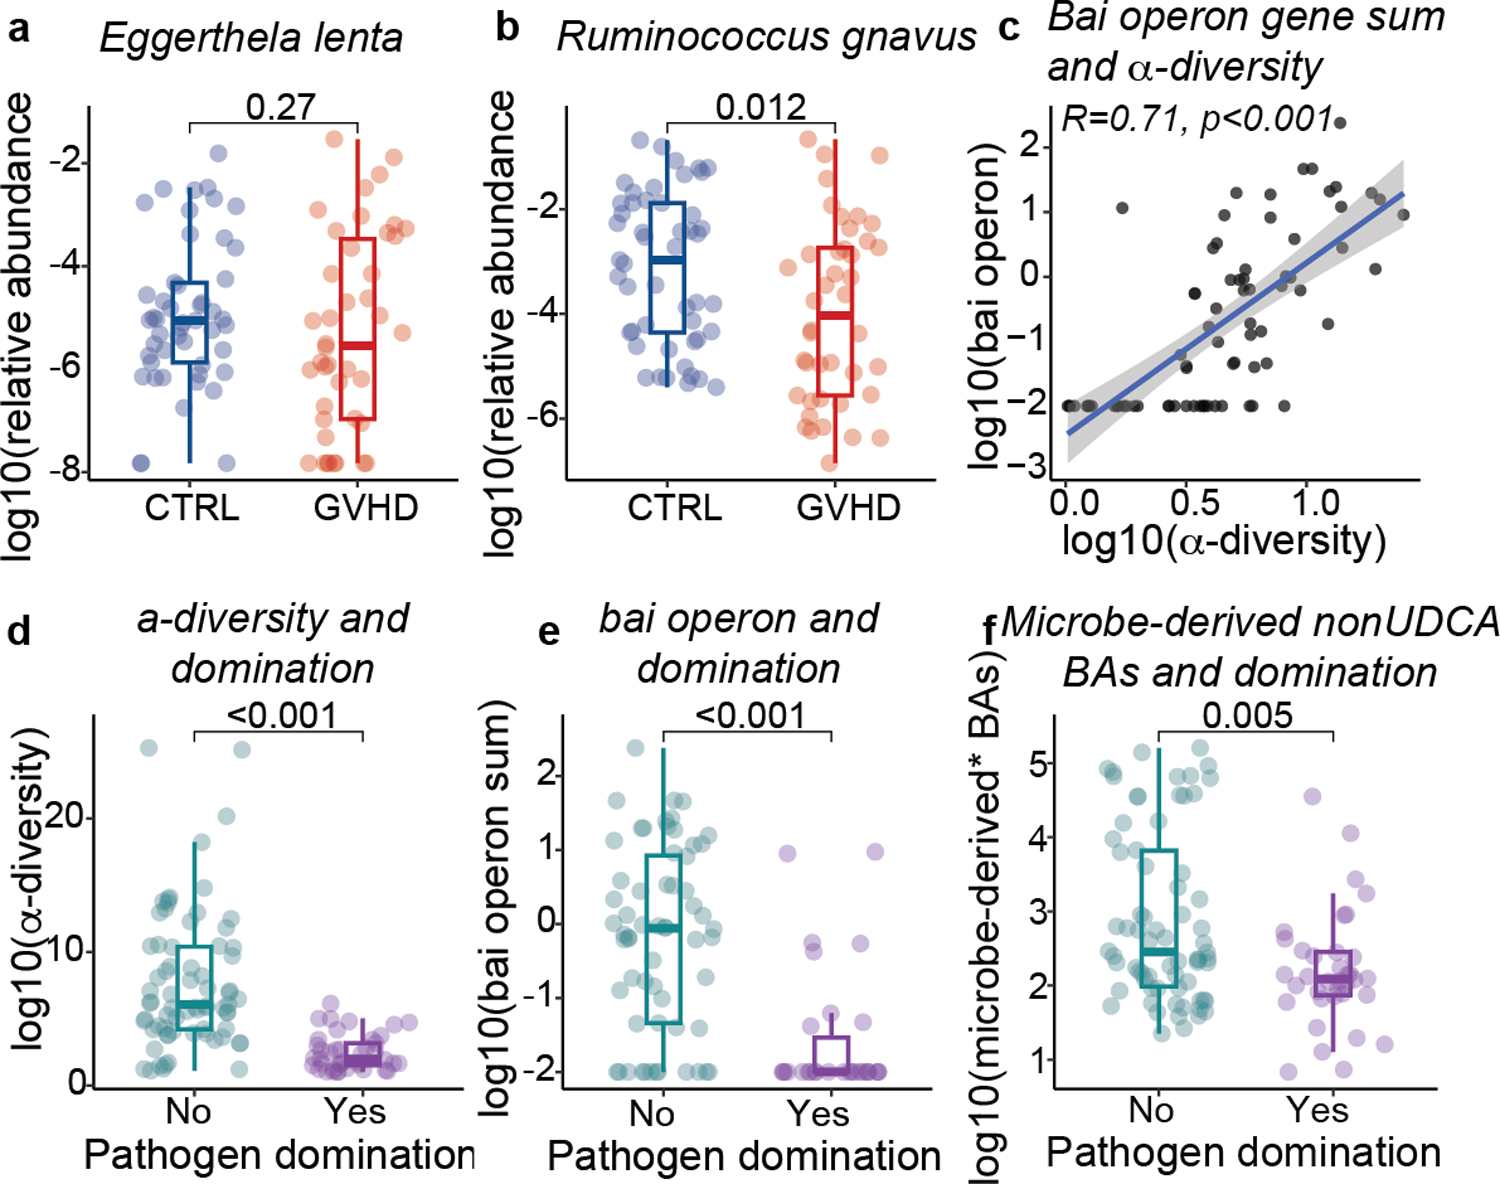
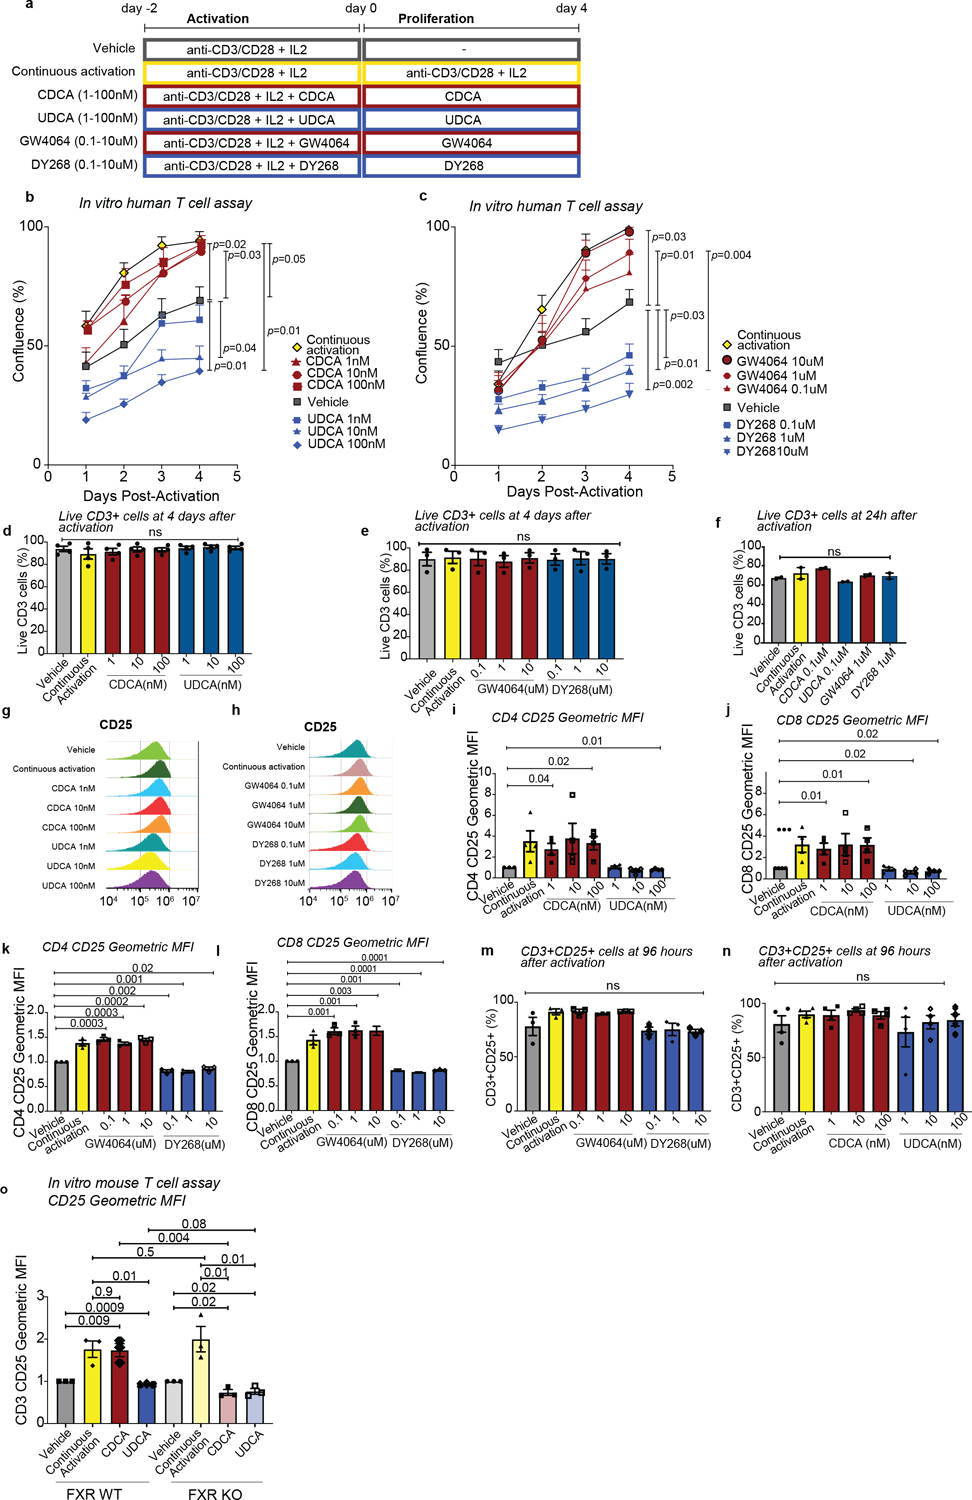
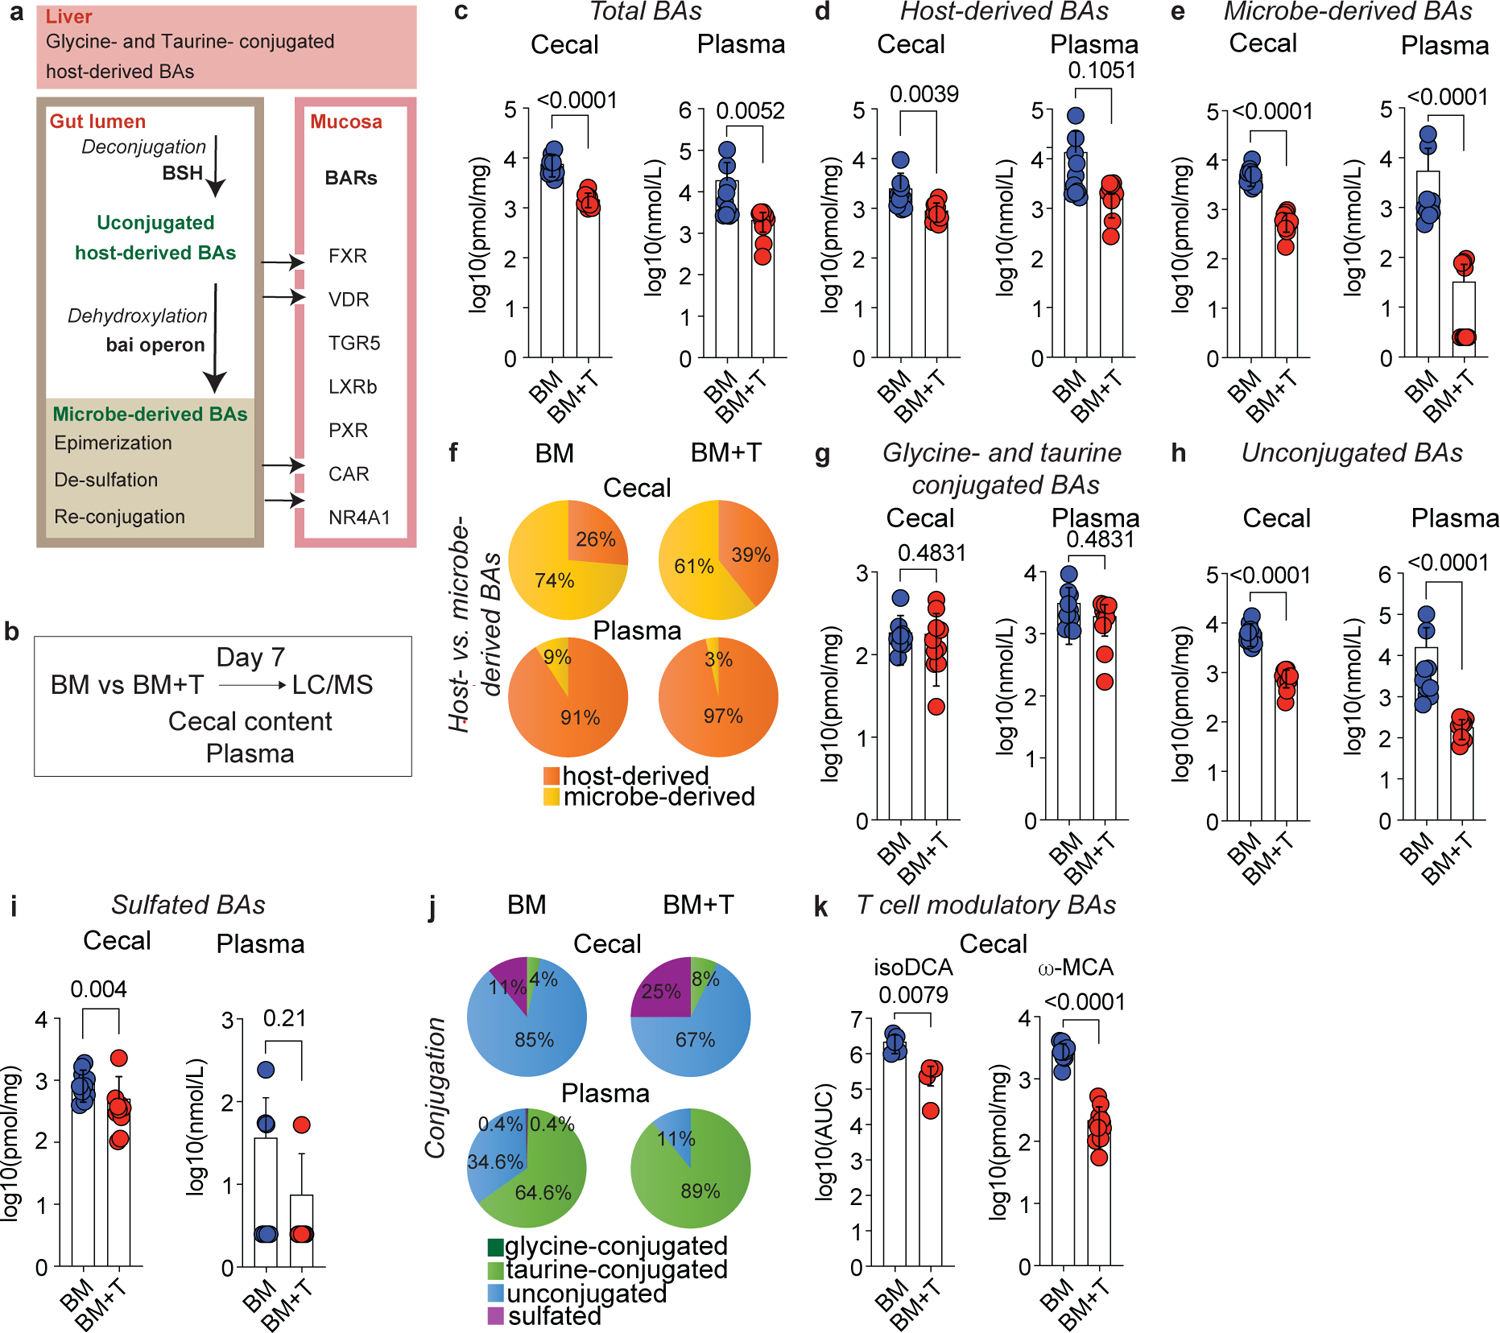
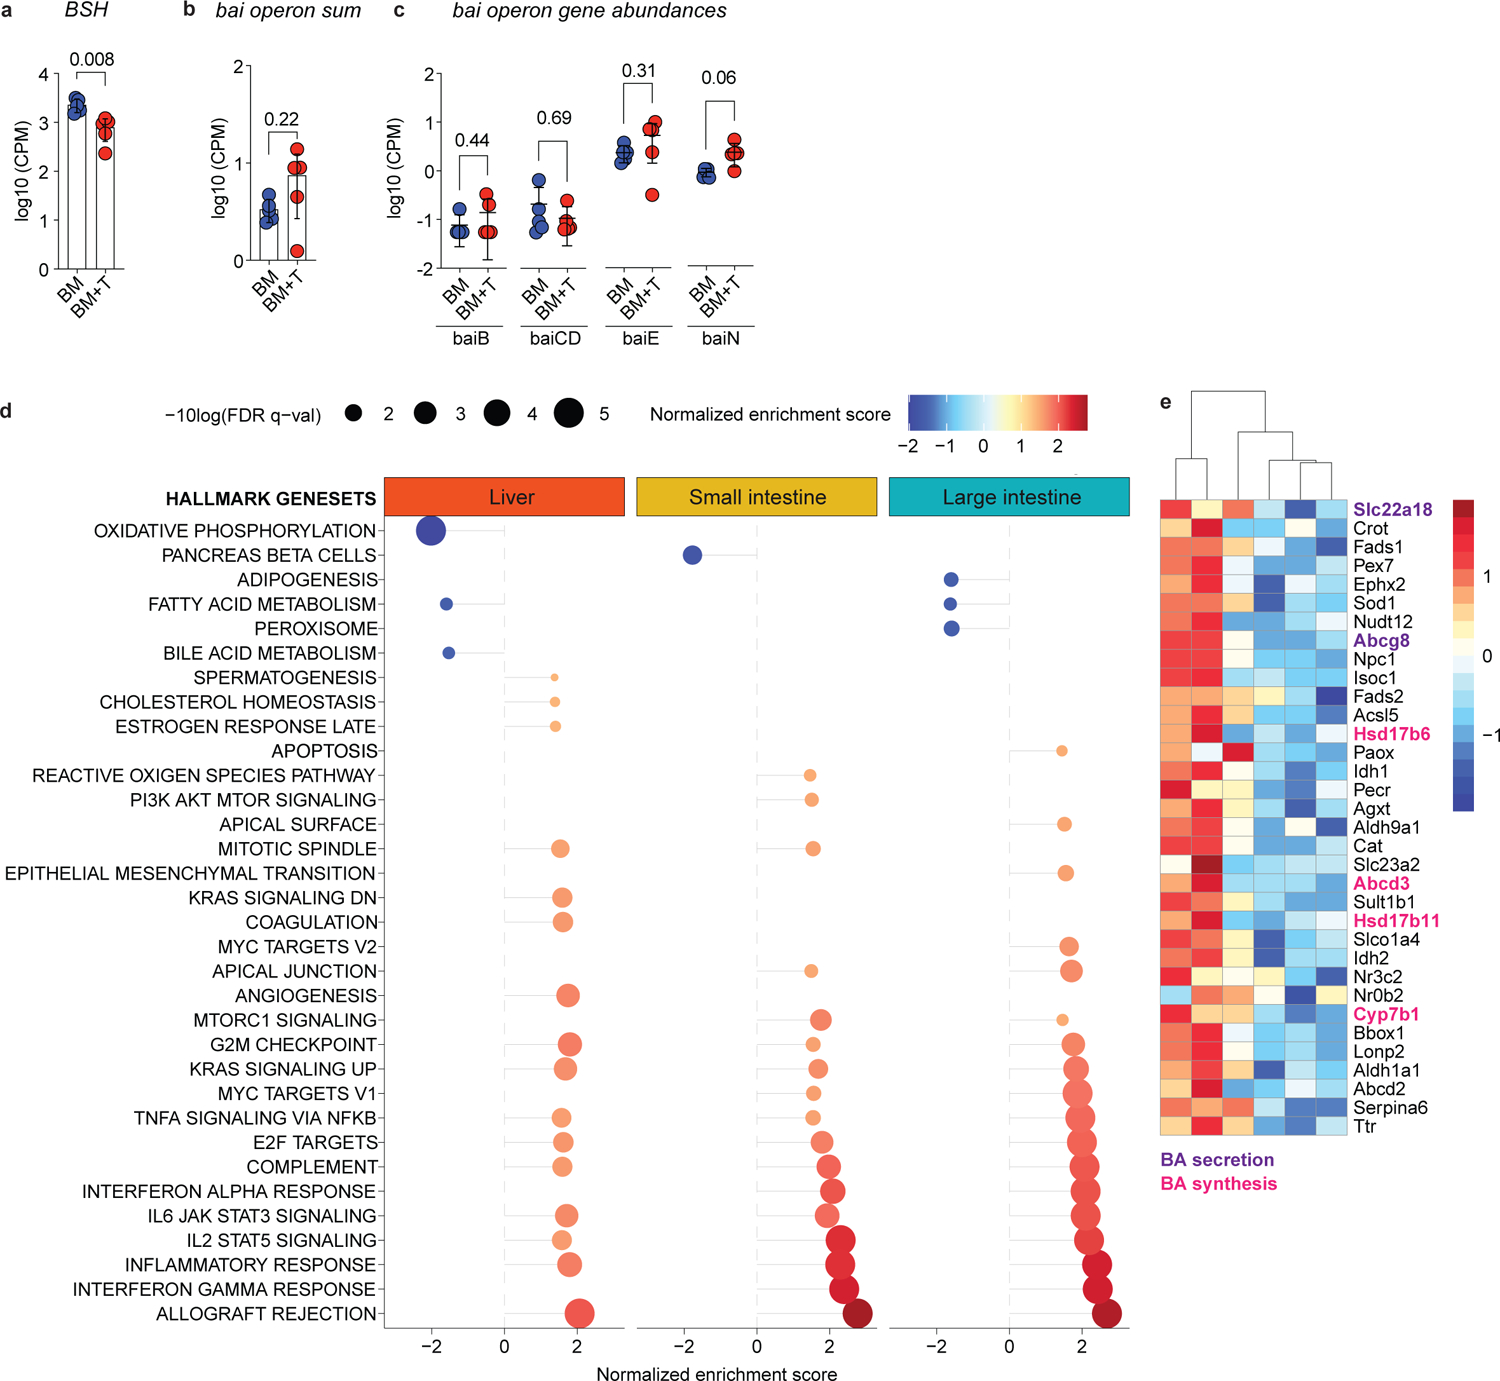
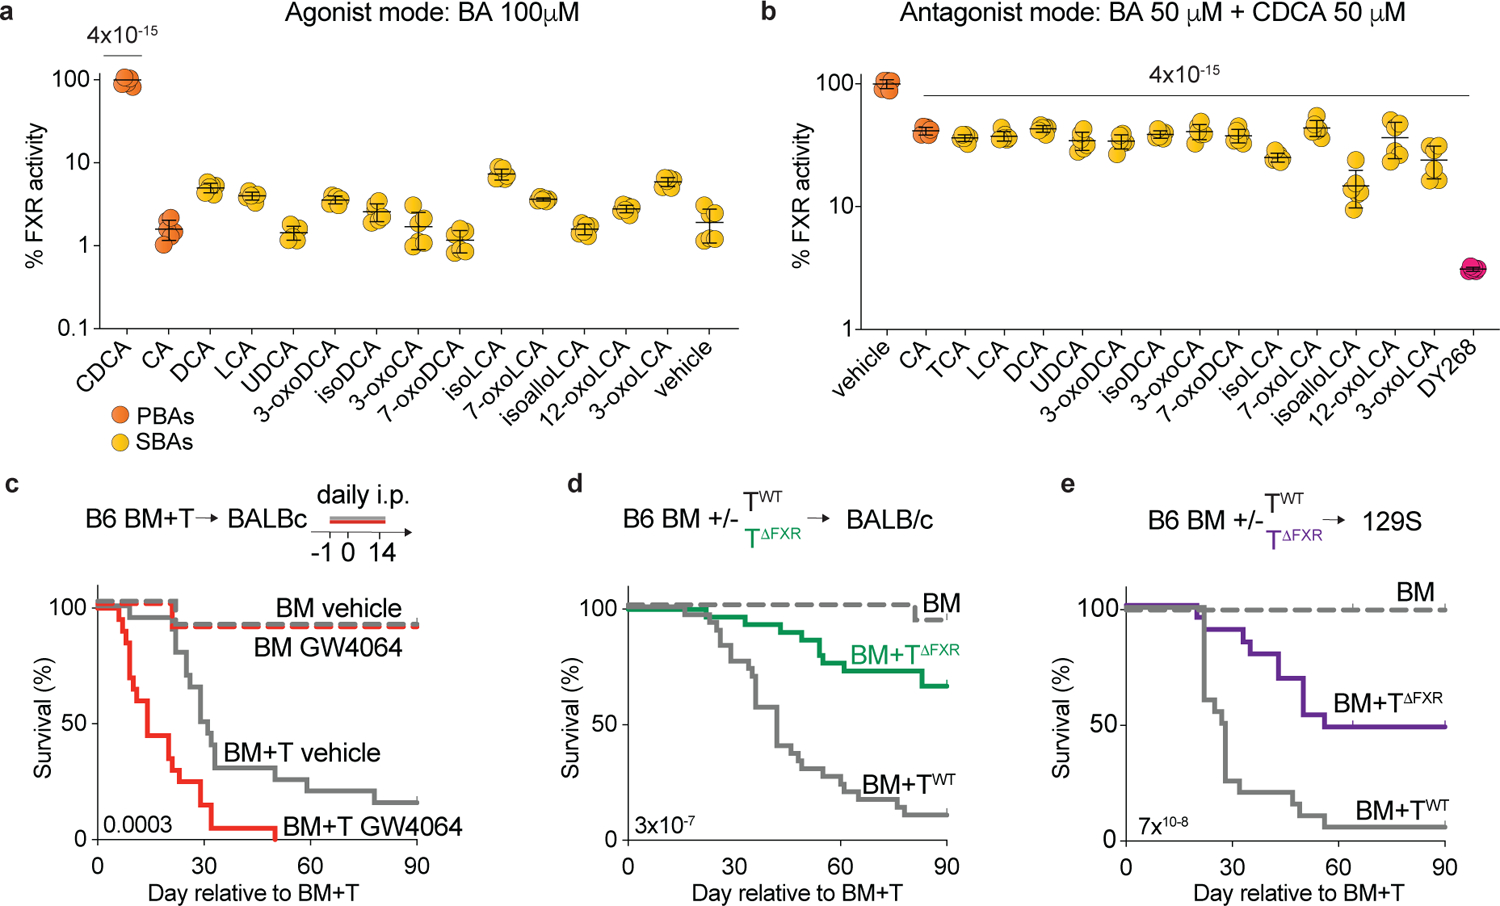
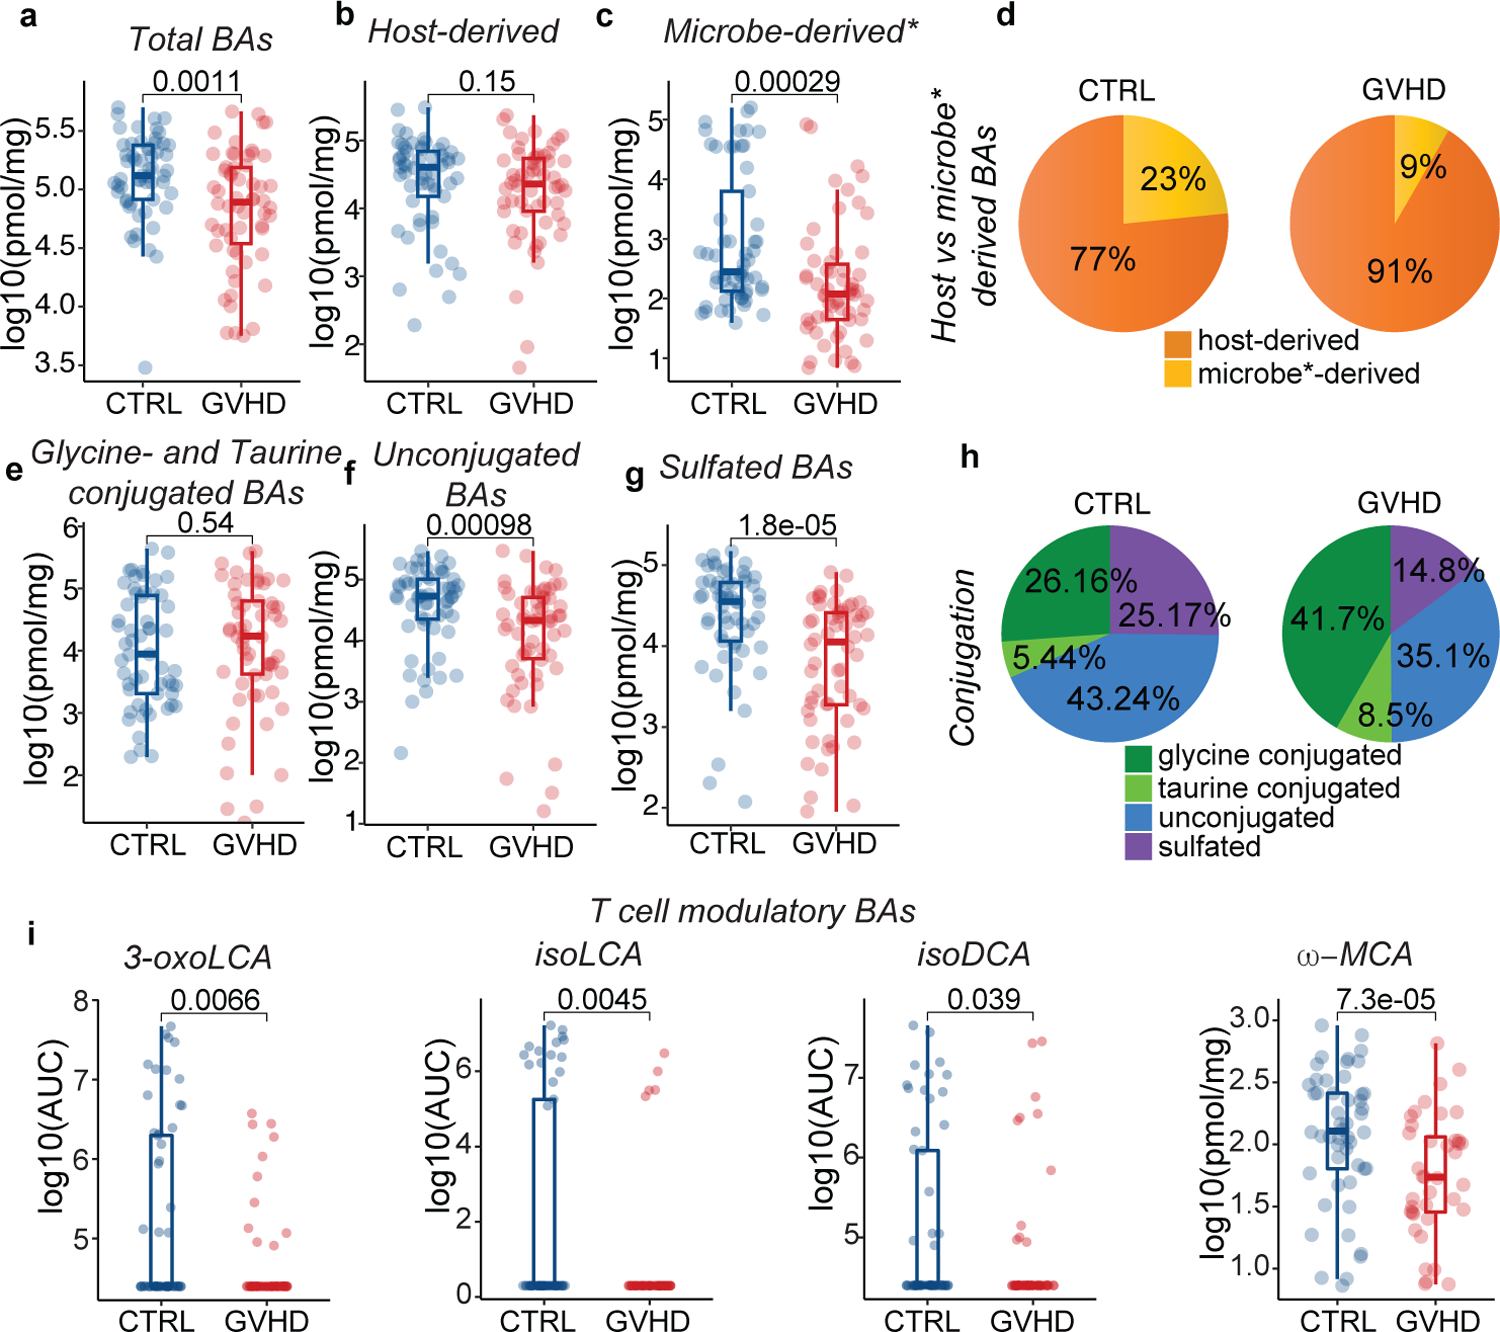
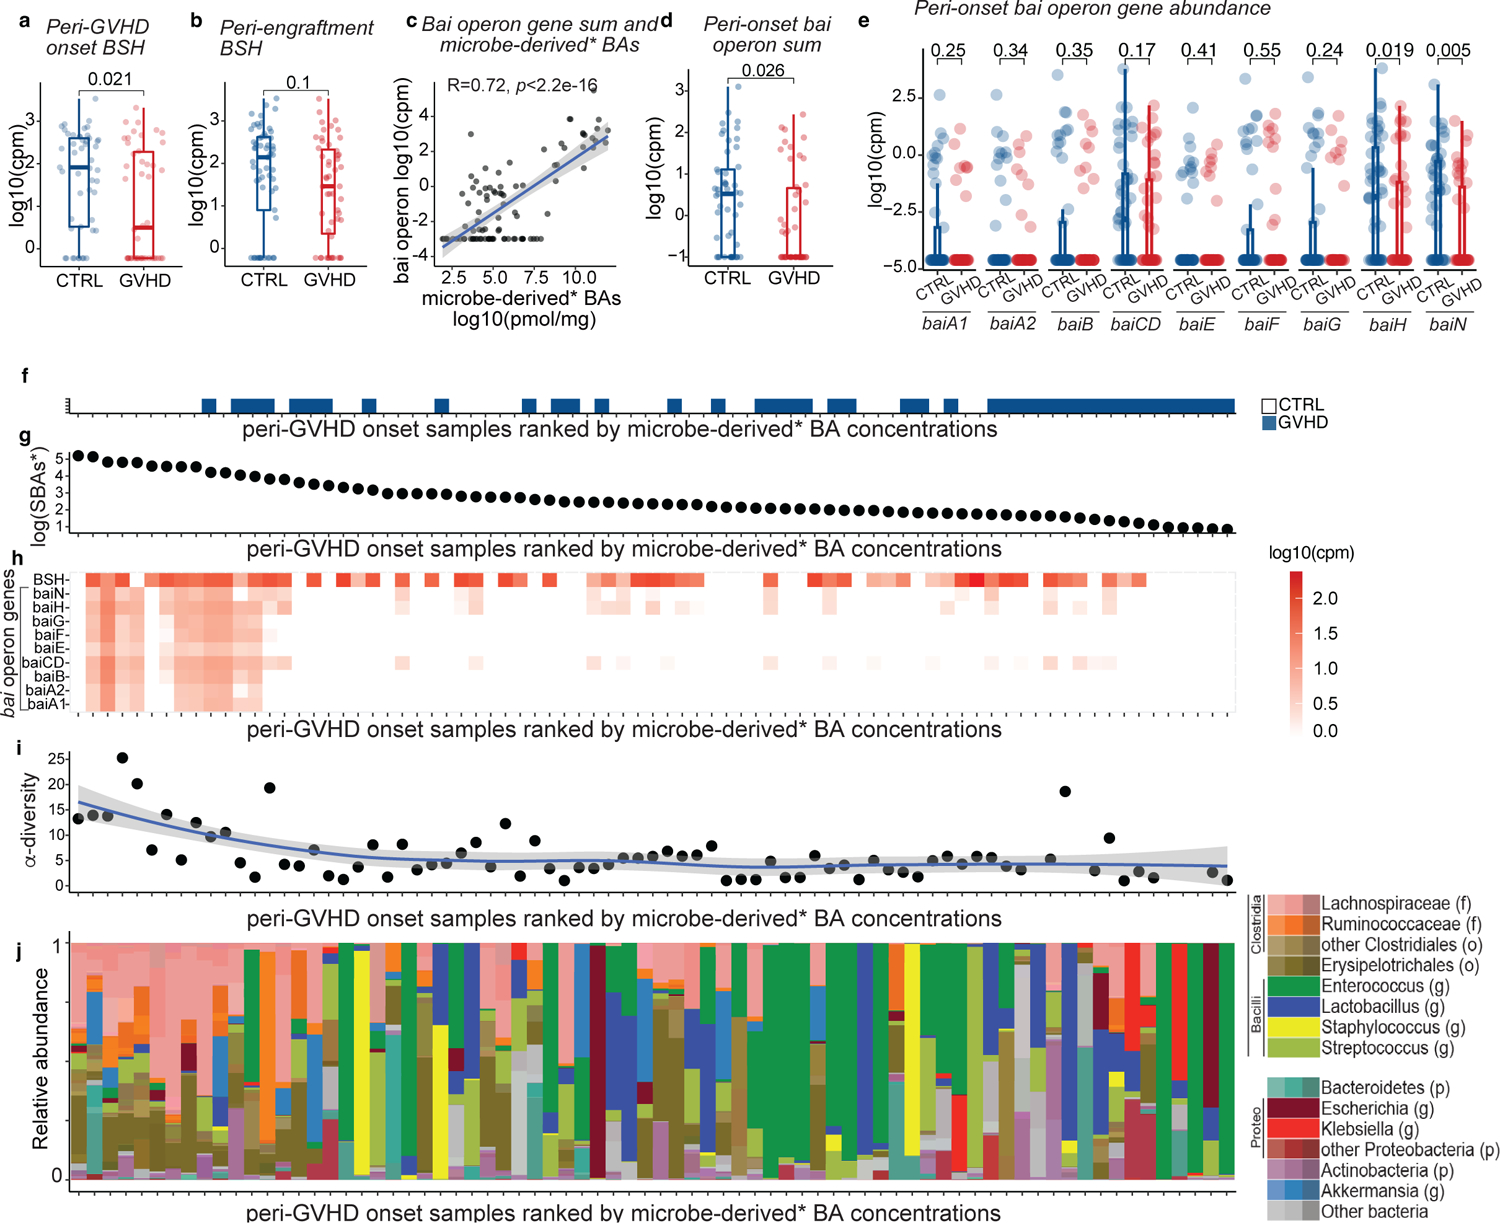
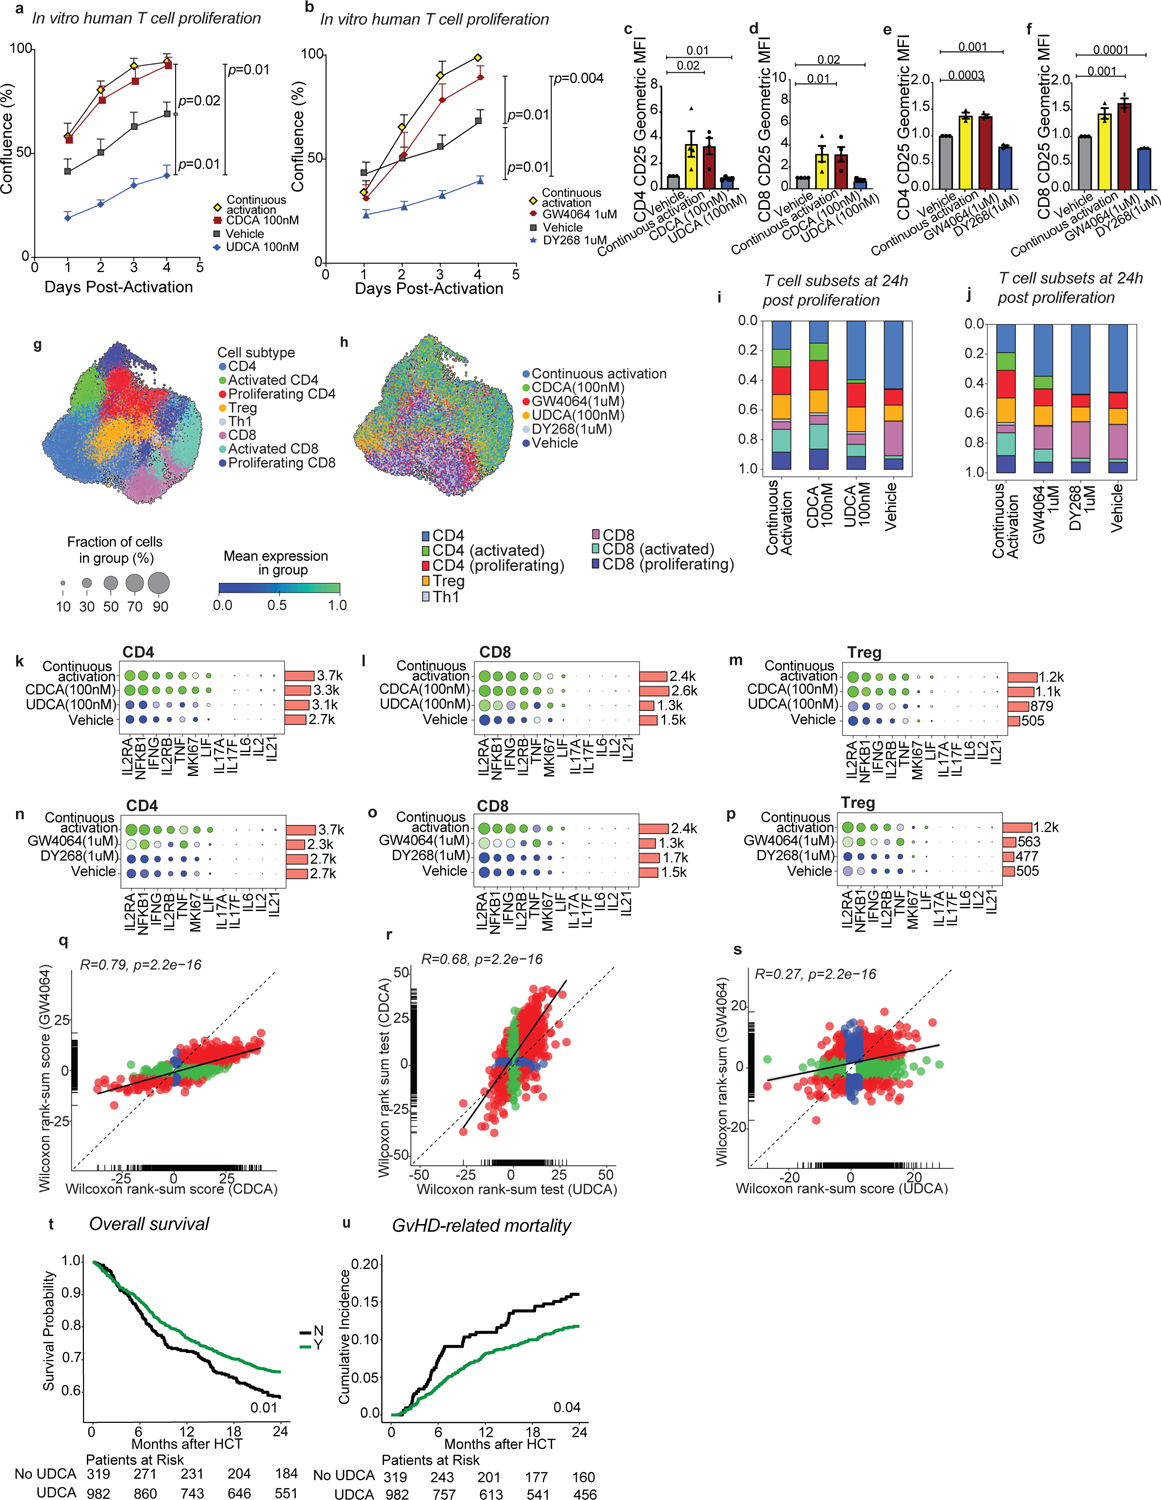
Microbial transformation of bile acids affects intestinal immune homoeostasis but its impact on inflammatory pathologies remains largely unknown. Using a mouse model of graft-versus-host disease (GVHD), we found that T cell-driven inflammation decreased the abundance of microbiome-encoded bile salt hydrolase (BSH) genes and reduced the levels of unconjugated and microbe-derived bile acids. Several microbe-derived bile acids attenuated farnesoid X receptor (FXR) activation, suggesting that loss of these metabolites during inflammation may increase FXR activity and exacerbate the course of disease. Indeed, mortality increased with pharmacological activation of FXR and decreased with its genetic ablation in donor T cells during mouse GVHD. Furthermore, patients with GVHD after allogeneic hematopoietic cell transplantation showed similar loss of BSH and the associated reduction in unconjugated and microbe-derived bile acids. In addition, the FXR antagonist ursodeoxycholic acid reduced the proliferation of human T cells and was associated with a lower risk of GVHD-related mortality in patients. We propose that dysbiosis and loss of microbe-derived bile acids during inflammation may be an important mechanism to amplify T cell-mediated diseases.


Conflict of interest statement

M.A.P. reports honoraria from Adicet, Allovir, Caribou Biosciences, Celgene, Bristol-Myers Squibb, Equilium, Exevir, Incyte, Karyopharm, Kite/Gilead, Merck, Miltenyi Biotec, MorphoSys, Nektar Therapeutics, Novartis, Omeros, OrcaBio, Syncopation, VectivBio AG, and Vor Biopharma; he serves on DSMBs for Cidara Therapeutics, Medigene, and Sellas Life Sciences, and the scientific advisory board of NexImmune; he has ownership interests in NexImmune and Omeros; he has received institutional research support for clinical trials from Incyte, Kite/Gilead, Miltenyi Biotec, Nektar Therapeutics, and Novartis. KAM holds equity and is on the advisory board of Postbiotics Plus and has consulted for Incyte. J.U.P. reports research funding, intellectual property fees, and travel reimbursement from Seres Therapeutics, and consulting fees from DaVolterra, CSL Behring, and from MaaT Pharma; he serves on an Advisory board of and holds equity in Postbiotics Plus Research, he has filed intellectual property applications related to the microbiome (reference numbers #62/843,849, #62/977,908, and #15/756,845). M.R.M.B. has received research support and stock options from Seres Therapeutics and stock options from Notch Therapeutics and Pluto Therapeutics; he has received royalties from Wolters Kluwer; has consulted, received honorarium from or participated in advisory boards for Seres Therapeutics, Vor Biopharma, Rheos Medicines, Frazier Healthcare Partners, Nektar Therapeutics, Notch Therapeutics, Ceramedix, Lygenesis, Pluto Therapeutics, GlaskoSmithKline, Da Volterra, Thymofox, Garuda, Novartis (Spouse), Synthekine (Spouse), Beigene (Spouse), Kite (Spouse); he has IP Licensing with Seres Therapeutics and Juno Therapeutics; and holds a fiduciary role on the Foundation Board of DKMS (a nonprofit organization). MSK has institutional financial interests relative to Seres Therapeutics. The remaining authors declare no competing interests.

Figures

Extended Data Fig. 1.
Extended Data Fig. 1.. Alloreactive T cells alter intestinal and circulating BAs and host metabolism.
Lethally irradiated 6–8 week old female BALBc mice were transplanted with 10 × 106 BM cells alone (BM) or together with 1 × 10⁶ T cells (BM+T). (a-c) BAs were quantified on day 7 post-transplant by liquid chromatography-mass spectrometry (LC-MS) in the cecal contents and plasma. (a) Ratio of microbe- to host-derived BAs (b) Ratio of unconjugated to glycine- and taurine-conjugated BA. (c). Estimated cecal levels of the T cell modulatory BAs 3-oxoLCA and isoLCA (below limit of detection). Weight loss (a), clinical GVHD scores (b) and cumulative food intake per mouse at day 7 post-transplant (c). Plasma levels of AST (d), ALT (e), albumin (f), cholesterol (h), and triglycerides (g). Data combined from two independent experiments (n=10). Data shown as mean ± S.D and statistical significance determined by two-tailed Mann-Whitney test.
Extended Data Fig. 2.
(a) Principle of the FXR luciferase reporter assay used in Fig. 3a and b and Extended Data Fig. 2b. (b) Stably transfected HepG2 cells expressing luciferase under the control of an FXR-responsive element were treated with the indicated doses of CDCA. Luciferase units (luminescence) were normalized to cell viability assessed by Hoechst 33342 staining (fluorescence). Data representative of two independent experiments and presented as technical triplicates with medians connected. Weight loss (c) and clinical GVHD score (d) of survival experiment shown in Fig. 3. Mice transplanted transplanted with 10 × 106 B6 BM cells alone or together with 1 × 10⁶ T cells from either Nr1h4fl/fl (BM+TWT) or Cd4Cre Nr1h4fl/fl (BM+TΔFXR) mice on a C57Bl/6N background. Data combined from three independent experiments (BM group n=20, BM+T groups n=30 per group) and connected as means ± S.D. (e) Survival of cohoused WT or nr1h4−/−l (Δ FXR) B6 mice receiving BALBc BM+T. Data combined from three independent experiments (n=13 per group). Statistical significance was determined using log-rank test. (f-h) BALBc recipient mice transplanted with 10 × 106 B6 BM cells alone or together with 1 × 10⁶ T cells from either Nr1h4fl/fl (BM+TWT) or Cd4Cre Nr1h4fl/fl (BM+TΔFXR) mice on a C57Bl/6N background. (f) Organ-specific and compound histopathological scores at day 28 post-transplant of transplanted mice with representative histology images (g). Data from one experiment (n=10 per group) and statistical significance was determined by by two-tailed Mann-Whitney test. (h) Production of IFNγ by CD4+ and CD8+ T cells in the smallI and large intestine lamina propria 14 days after transplant. Data combined from two (n=10 per group) and presented as mean ± S.D. Statistical significance was determined by by two-tailed Mann-Whitney test.
Extended Data Fig. 3.
Consort diagram for the data shown in Fig. 4 and 5 (and Extended Data Fig. 5–8). PBSC: peripheral blood stem cell graft.
Extended Data Fig. 4.
Effects of UDCA exposure on the intestinal BA pool in n=280 samples from either peri-engraftment or peri-GVHD onset timepoints. Fecal concentrations of UDCA (a) and microbe-derived BAs (b). UDCA exposure status is shown in the x-axis (w = weeks; m = months since last exposure). Statistical significance determined by the 2-sided Wilcoxon Rank-sum test. The boxplot center line corresponds to the median, box limits correspond to the 25th and 75th percentile, and whiskers correspond to 1.5x interquartile range. Correlation of fecal UDCA concentrations with the levels of conjugated UDCA (conj-UDCA, c), total BAs (d), microbe-derived BAs (e), host-derived BAs (f), nonUDCA total BAs (g) nonUDCA microbe-derived BAs (h), and microbe- to host- derived (M/H) ratio excluding UDCA (nonUDCA, i). The solid line represents a linear regression model fitted to the data. The shaded region surrounding the line indicates a 95% confidence interval for the regression line. Total BAs nonUDCA (g) are measured in pmol/mg. (j,k) Correlation matrix of the BA species covarying with UDCA. (k) Showing BA species with a Pearson correlation coefficient (R>0.4).
Extended Data Fig. 5.
Fecal BA profiles at the peri-GVHD onset time point. Showing the levels of total microbe-derived BAs (a), microbe- to host-derived (M/H) BA ratio (b), M*/H (i.e., nonUDCA M/H) BA ratio (c), and the ratio of unconjugated to amidated BAs (d). Data representative of 57 control and 58 GVHD patients. Statistical significance determined with the 2-sided Wilcoxon Rank-sum test. The boxplot center line corresponds to the median, box limits correspond to the 25th and 75th percentile, and whiskers correspond to 1.5x interquartile range. (e-f) Differential abundance of BAs between GVHD and controls in peri-GVHD onset samples after multivariate adjustment. (e) Grid plot showing significance status, q-values, and log fold changes of BAs relative to indicated clinical variables. (f) Volcano plot showing log-transformed adjusted p-values vs log fold changes of BAs between GVHD and control patients. Statistical comparison was made using the two-sided empirical Bayes moderated t-test and p-values were adjusted using the Benjamini-Hochberg method.
Extended Data Fig. 6.
Fecal BA profiles at the peri-engraftment time point. Total BAs (a), host-derived (b), microbe-derived (c), microbe*-derived (d), microbe-derived to host-derived (M/H) BA ratio (e), M*/H (nonUDCA M/H) BA ratio in patients that develop GVHD vs controls (f). (g) Pie chart showing the averaged relative contributions of host-derived and microbe*-derived to the calculated total BA pool. Glycine- and taurine-conjugated (h), unconjugated (i), and sulfated (g) BAs. Pie chart showing the averaged percentages of glycine- and taurine-conjugated, unconjugated and sulfated BAs in patients with GVHD vs controls in peri-GVHD onset samples (k). Microbe*-derived BAs: Microbe-derived BAs excluding UDCA. Data representative of 90 control and 86 GVHD patients. The boxplot center line corresponds to the median, box limits correspond to the 25th and 75th percentile, and whiskers correspond to 1.5x interquartile range. Statistical significance determined with the 2-sided Wilcoxon Rank-sum test. (l,m) Differential abundance of BAs between GVHD and control patients in peri-engraftment samples after multivariate adjustment (l) Grid plot showing significance status, q-values, and log fold changes of BAs relative to indicated clinical variables. (m) Volcano plot showing log-transformed adjusted p-values vs log fold changes of BAs between GVHD and control patients. Statistical comparison was made using the two-sided empirical Bayes moderated t-test and p-values were adjusted using the Benjamini-Hochberg method.
Extended Data Fig. 7.
Microbiome features in peri-GVHD onset samples. Relative abundance of (a) Eggerthella lenta and (b) Ruminococcus gnavus. Data representative of 49 control and 42 GVHD patients (c) Correlation of the sum of bai operon gene and α-diveristy as measured by the Simpson reciprocal index. The solid line represents a linear regression model fitted to the data. The shaded region surrounding the line indicates a 95% confidence interval for the regression line. Data representative of 82 patients with peri-GVHD onset samples. (d) α-diversity, (e) sum of bai operon genes identified by shotgun metagenomic analysis (measured in counts per million), and (f) levels of microbe-derived BAs* (pmol/mg) in patients with or without intestinal pathogen domination. Data representative of 41 patients with and 74 patients without pathogen domination. Microbe-derived BAs*= microbe-derived BAs excluding UDCA. Statistical significance determined with the univariate 2-sided Wilcoxon Rank-sum test. The boxplot center line corresponds to the median, box limits correspond to the 25th and 75th percentile, and whiskers correspond to 1.5x interquartile range. R correspond to Pearson’s correlation coefficient.
Extended Data Fig. 8.
In vitro human T cell proliferation in response to FXR activation or inhibition with drugs or BAs. (a) Experimental design. Purified human T cells were activated with anti-CD3 and anti-CD28 antibodies in the presence of recombinant IL-2 for 2 days and further cultured either in the presence of anti-CD3/anti-CD28 antibodies (continuous activation control) or in their absence (vehicle control) with or without the indicated compounds for 96 hours. Showing T cell confluence in response to CDCA and UDCA (b) or GW4064 and DY268 (c) at the indicated concentrations. Cell viability (d, e, f) and representative histograms (g, h) showing CD25 levels determined by flow cytometric analysis. (i-l) CD25 expression in CD4+ and CD8+ T cells after 96 hours of treatment with CDCA and UDCA (i-j), or GW4064 and DY268 (k-l). Showing the geometric mean fluorescence intensity (MFI) of CD25 in CD25+ T cells. Values were normalized to the MFI of the vehicle-treated group. (m, n) Frequency of CD25 positive celles on day 4 post-activation. (o) CD25 expression from T cells of FXRWT or FXRWT mice treated with anti-CD3 and anti-CD28 antibodies in the presence of IL-2 for 2 days before incubation with CDCA (100nM), or UDCA (100nM), anti-CD3, anti-CD28 and IL-2 (continuous activation), or vehicle for 2 more days. CD25 expression was measured as geometric mean fluorescence intensity (MFI) of CD25 in CD25+ T cells normalized to the MFI of the vehicle-treated group. Statistical analysis was performed by two-way (b,c) or one-way ANOVA followed by multiple t-test with Bonferoni correction (d-f, i-o). Each data point in (i-n) shows the average of technical duplicates for a single donor. Bars denote the standard error of the mean. Data representative of 4 independent experiments with a total of 4 PBMC donors. Each data point in (g) shows the average of technical triplicates from two mice. Bars denote the standard error of the mean. Data representative of 3 independent experiments with a total of 6 mice.
Extended Data Fig. 9.
Quality control of single cell RNA-sequencing profiling of in vitro activated T cells treated with FXR ligands, DMSO or activating signals for 24h. Visualization of 60,767 cells using a uniform manifold approximation and projection (UMAP) of (a) cells from the two donors and (b) per hashtag before eliminating any cells. (c) Total counts (log10 scale) (d) total genes, (e) ribosomal fraction, (f) mitochondrial fraction per cell, (g) predicted doublet and (h) doublet score. (i-k) Cells expressing markers for B and Natural Killer cells were defined as contaminants. (l-m) UMAP and stacked plot showing the fraction of retained (33,634) and removed cells (27,133).
Extended Data Fig. 10.
Single cell RNA-sequencing profiling of in vitro activated T cells treated with CDCA (100nM), UDCA (100nM), GW4064 (1uM) and DY268 (1uM) for 24h. (a) Gene markers used to identify cell populations. Visualization of annotated cells using a uniform manifold approximation and projection (UMAP) of (b) subtypes after batch correction and (c) per treatment arm. (d) Gene Set Enrichment Analysis of pathways differentially regulated in the different conditions (CDCA 100nM, UDCA 100nM, GW4064 1uM, DY268 1uM) relative to the vehicle control in CD4+, CD8+ and regulatory T cell populations. Displaying significant pathways.
Fig. 1.
Fig. 1.. T cell-driven inflammation alters the intestinal BA pool.
Lethally irradiated 6–8 week old female BALBc mice were transplanted with 10 × 106 BM cells alone (BM) or together with 1 × 10⁶ T cells (BM+T). (a) Simplified schematic overview of BA metabolism. In humans, the host-derived BA pool is primarily composed of CA and CDCA, while in mice α- and β-MCA are dominant. Approximately 95% of the BAs are absorbed in the terminal ileum and enter the enterohepatic circulation, while the remaining 5% are transformed by gut bacteria into various microbe-derived BAs. BAs can bind to several BA receptors (BARs) including the Farnesoid X Receptor (FXR), the Vitamin D Receptor (VDR), the G protein-coupled BA Receptor 1 (TGR5), the Liver X Receptor β (LXRβ), the Pregnane X Receptor (PXR), the Constitutive Androstane Receptor (CAR), and the Nuclear Receptor 4A1 (NR4A1). (b) Experimental workflow for BA analyses during preclinical GVHD. (c-k) Analysis of cecal contents and plasma on day 7 by LC-MS. Concentration of total (c), host-derived (d), and microbe-derived BAs (e). Pie chart showing the relative abundances of host- and microbe-derived BAs (f). Concentration of glycine- and taurine-conjugated (g), unconjugated (h), and sulfated BAs (i). Pie chart showing the relative abundances of glycine- and taurine-conjugated, unconjugated, and sulfated BAs (j). Cecal levels of the T cell immunomodulatory BAs isoDCA and ω-MCA (k). (c-k) Data combined from two independent experiments (n=10) and shown as mean ± S.D or averaged percentages. IsoDCA levels in (k) are reported as AUCs and representative of two independent experiments (n=5). Statistical significance was determined by a two-tailed Mann Whitney test.
Fig. 2.
Fig. 2.. Alloreactive T cells alter host and microbial BA metabolism.
Lethally irradiated 6–8 week old female BALBc mice were transplanted with 10 × 106 BM cells alone (BM) or together with 1 × 10⁶ T cells (BM+T). Mice were analyzed on day 7 post-transplant. (a-c) Metagenomic analyses of intestinal microbiota from cecal contents. Abundance of BSH (a), sum of the gene counts mapping to the bai operon (b) and counts of individual bai operon genes (c). (d, e) Bulk RNA-sequencing analyses of liver tissue and epithelial fractions of the small and large intestines. (d) Gene Set Enrichment Analysis of pathways differentially regulated between BM and BM+T mice. Displaying significant pathways. (e) Heatmap showing hepatic BA metabolism genes enriched among differentially abundant transcripts. Data are from one experiment (a-c, n=5), (d, e, n=3). Data in (a-c) shown as mean ± S.D and statistical significance was determined by a two-tailed Mann Whitney test.
Fig. 3.
Fig. 3.. FXR activity contributes to GVHD.
(a, b) Stably transfected HepG2 cells expressing luciferase under the control of an FXR-responsive element were treated with the indicated BAs for 16h. Endpoint luciferase activity was normalized by live cell numbers determined by Hoechst 33342 staining. (a) Assay in agonist mode. FXR activation induced by the indicated BAs at 100μM. Showing % of FXR activity relative to the positive control (CDCA). (b) Assay in antagonist mode. FXR activation induced by a suboptimal concentration of CDCA (50μM) was counteracted by equimolar amounts of the indicated BA or the synthetic FXR antagonist DY268 (20nM). Showing % of FXR activity relative to the positive control (CDCA). (c-e) Lethally irradiated BALBc mice received B6 BM alone (BM) or in combination with T cells (BM+T). (c) Survival of BALBc mice that were treated with the FXR agonist GW4064 30mg/kg intraperitoneally once daily or vehicle for 15 days starting day −1 relative to transplant. (d) Survival of BALBc mice transplanted with donor T cells from either Nr1h4fl/fl (BM+TWT) or Cd4-Cre Nr1h4fl/fl (BM+TΔFXR) mice on a B6 background. (e) Survival of 129S mice transplanted with B6 BM+TWT or TΔFXR. (a, b) Data shown as mean ± S.D, pooled from two independent experiments carried out in technical triplicates. Statistical significance in (a, b) was determined by a one-way ANOVA followed by the Dunnett’s multiple comparisons test. Data combined from two (c, e, n=20) or three (d, n=30) independent experiments. Statistical significance in (c-e) was determined using the log-rank test.
Fig. 4.
Fig. 4.. Comparison of BA pools in patients with GVHD vs controls.
Concentration of total (a), host-derived (b), and microbe-derived* (non-UDCA) (c) BAs. (d) Pie chart showing the averaged percentages of host- and microbe-derived* BA pools in patients with GVHD vs. controls in peri-GVHD onset samples. (e) Glycine- and taurine-conjugated, (f) unconjugated, and (g) sulfated BA levels. (h) Pie chart showing the averaged percentages of glycine- and taurine-conjugated, unconjugated and sulfated BAs in patients with GVHD vs controls in peri-GVHD onset samples. (i) Levels of T cell immunomodulatory BAs in peri-GVHD onset samples of patients with GVHD vs controls. The boxplot center line corresponds to the median, box limits correspond to the 25th and 75th percentile, and whiskers correspond to 1.5x interquartile range. Data representative of 57 control and 58 GVHD patients. Statistical significance was determined with the 2-sided Wilcoxon Rank-sum test.
Fig. 5.
Fig. 5.. BA biotransformation potential in transplant patients with GVHD vs controls.
BSH gene abundance in (a) peri-onset (n=46 with GVHD and n=49 controls) and (b) peri-engraftment (n=51 with GVHD and n=57 controls) samples of patients with GVHD vs controls. (c) Correlation between the sum of the gene counts mapping to the bai operon and microbe-derived* BAs. The solid line represents a linear regression model fitted to the data. The shaded region surrounding the line indicates a 95% confidence interval for the regression line. bai operon gene sum (d) and abundance of bai operon genes (e) in patients with GVHD vs controls in peri-GVHD onset samples (n=46 with GVHD and n=49 controls). The boxplot center line corresponds to the median, box limits correspond to the 25th and 75th percentile, and whiskers correspond to 1.5x interquartile range. Statistical significance determined with the 2-sided Wilcoxon Rank-sum test. R was calculated with Pearson correlation. (f-j) Landscape of sample-specific characteristics in peri-GVHD onset samples, ranked from higher to lower microbe-derived* BAs. Showing GVHD incidence (f), concentration of microbe-derived*(g), and BSH and bai operon gene abundance (h). α-diversity calculated with the Simpson reciprocal index (i) and microbiome composition (j). Microbe-derived* BAs: microbe-derived BAs excluding UDCA. The solid line in (i) represents a smoothed trend line generated using the loess method. The shaded region surrounding the line indicatesa 95% confidence interval.
Fig. 6.
Fig. 6.. UDCA limits human effector T cell responses and is associated with improved GVHD-related mortality.
(a-s) Human T cells were activated and further cultured either in the presence of anti-CD3/anti-CD28 (continuous activation control) or in their absence (vehicle control) with or without the indicated compounds for 96 hours. T cell confluence in response to CDCA and UDCA (a) or GW4064 and DY268 after 96 hours (b). CD25 expression of CD4+ and CD8+ T cells after 96 hours of treatment with CDCA and UDCA (c-d), or GW4064 and DY268 (e-f). CD25 expression was measured as geometric mean fluorescence intensity (MFI) of CD25 in CD25+ T cells normalized to the MFI of the vehicle-treated group. (g-s) Single cell RNA-sequencing profiling of activated T cells after 24 hours of treatment with CDCA, UDCA, GW4064 or DY268. Uniform Manifold Approximation and Projection (UMAPs) showing the distribution of the major T cell populations (g) according to treatment group (h). Relative abundances of various T cell clusters in CDCA and UDCA (i), or GW4064 and DY268 (j) treated samples compared to the continuous activation and vehicle. Relative gene expression of selected immune-related genes in CD4 (k,n), CD8 (l,o) and regulatory (m,p) T cells in response to BAs (k-m) and selective FXR ligands. (n-p) Fold-change (FC) vs FC plots comparing the gene expression changes elicited by (q) CDCA and GW4064, (r) CDCA and UDCA, and (s) GW4064 and UDCA relative to vehicle in CD4 T cells. Overall survival (t) and cumulative incidence of GVHD-related mortality (u) in patients who did (n=982) or did not (n=319) receive UDCA. Statistical analysis was performed by two-way (a,b) or one-way ANOVA followed by multiple t-test with Bonferoni correction (c-f). Each data point in (a-f) shows the average of technical duplicates for a single donor. Bars denote the standard error of the mean. Data representative of 4 independent experiments with a total of 4 PBMC donors (a,c,d) or 3 independent experiments with a total of 3 PBMC donors (b,e,f). (g-s) Data from 1 experiment including 2 PBMC donors. (q-s) Statistical analysis was conducted using a 2-sided Wilcoxon rank sum test, with correction for multiple hypotheses using the False Discovery Rate (FDR) method. Outcome analysis was conducted using a log-rank test (t) and the Gray’s test (u).

References

    1. Hamilton JP, et al. Human cecal bile acids: concentration and spectrum. Am J Physiol Gastrointest Liver Physiol 293, G256–263 (2007). - PubMed
    1. Chen ML, Takeda K & Sundrud MS Emerging roles of bile acids in mucosal immunity and inflammation. Mucosal Immunol 12, 851–861 (2019). - PubMed
    1. Belkaid Y & Hand TW Role of the microbiota in immunity and inflammation. Cell 157, 121–141 (2014). - PMC - PubMed
    1. Russell DW The enzymes, regulation, and genetics of bile acid synthesis. Annu Rev Biochem 72, 137–174 (2003). - PubMed
    1. Ridlon JM, Kang DJ & Hylemon PB Bile salt biotransformations by human intestinal bacteria. J Lipid Res 47, 241–259 (2006). - PubMed

Substances