. 2024 Mar 1;14(1):5090.
doi: 10.1038/s41598-024-55148-9.

Delineating immune variation between adult and children COVID-19 cases and associations with disease severity

Affiliations

Delineating immune variation between adult and children COVID-19 cases and associations with disease severity

Alper Cevirgel et al. Sci Rep. .

Abstract

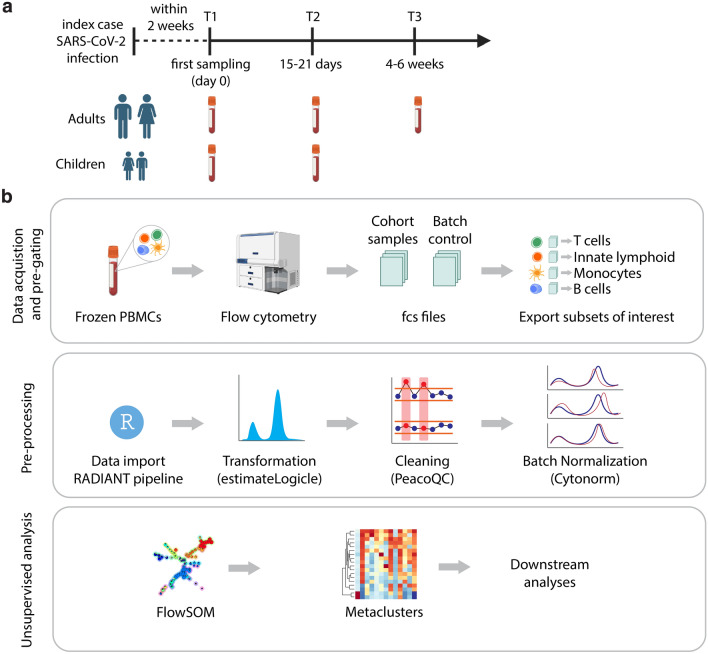
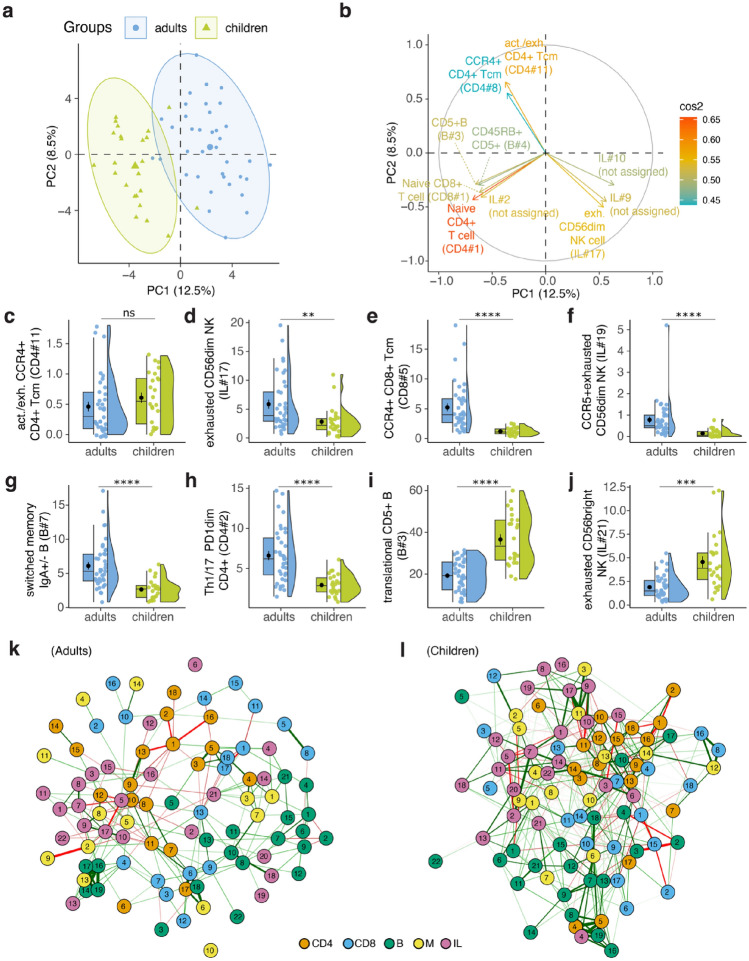
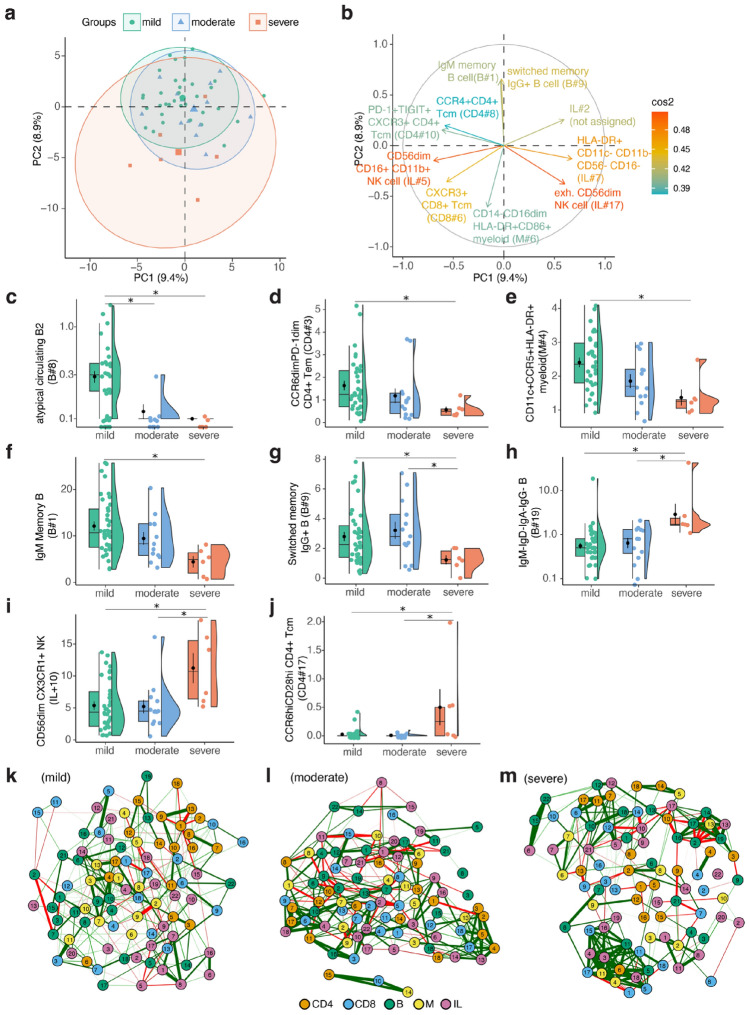
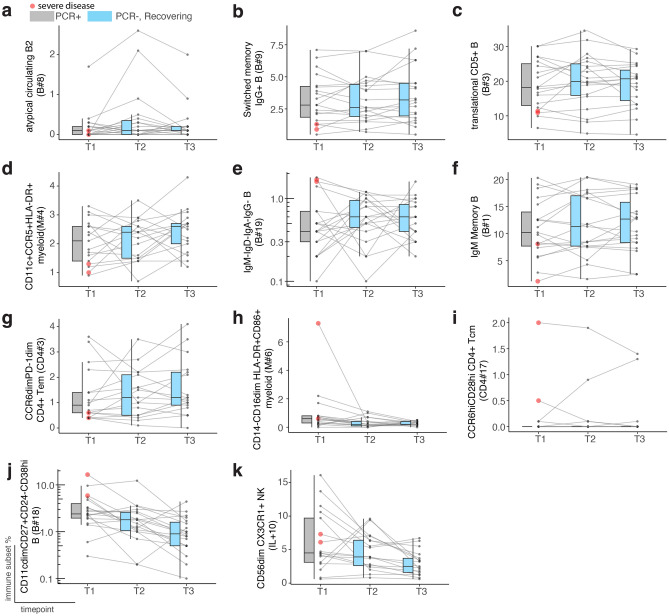
The SARS-CoV-2 pandemic has emphasized the need to explore how variations in the immune system relate to the severity of the disease. This study aimed to explore inter-individual variation in response to SARS-CoV-2 infection by comparing T cell, B cell, and innate cell immune subsets among primary infected children and adults (i.e., those who had never experienced SARS-CoV-2 infection nor received vaccination previously), with varying disease severity after infection. We also examined immune subset kinetics in convalescent individuals compared to those with persistent infection to identify possible markers of immune dysfunction. Distinct immune subset differences were observed between infected adults and children, as well as among adult cases with mild, moderate, and severe disease. IgM memory B cells were absent in moderate and severe cases whereas frequencies of B cells with a lack of surface immunoglobulin expression were significantly higher in severe cases. Interestingly, these immune subsets remained stable during recovery implying that these subsets could be associated with underlying baseline immune variation. Our results offer insights into the potential immune markers associated with severe COVID-19 and provide a foundation for future research in this area.


Conflict of interest statement

The authors declare no competing interests.

Figures

Figure 1
Figure 1
Study population and analysis pipeline. (a) SARS-CoV-2 infection cohort study design. (b) Step-by-step RADIANT pipeline description which includes data acquisition, pre-processing steps and unsupervised analysis.
Figure 2
Figure 2
Age and SARS-CoV-2 infection-related immune subsets explain the highest variation in PCR+ adults and children. (a) Projection of unsupervised immune subset clusters onto the principal components (PC). (b) Contribution of top 10 immune subsets explaining the variance on PC1-2. (cj) Plots depicting selected immune subsets that explain the variance om PC1-2 or are significantly different between children and adults. (k) Immune network correlations of adult and (l) children showing correlations stronger than the absolute value of 0.4 and p < 0.05 were shown. The numbers in nodes represent the immune subset IDs for a given cell subset type.
Figure 3
Figure 3
Increased immune variation in higher disease severity driven by exhausted immune subset phenotypes. (a) Projection of unsupervised immune subset clusters onto the principal components (PC). (b) Contribution of top 10 immune subsets explaining the variance on PC1-2. (cj) Plots depicting selected immune subsets that are significantly different between severity groups. Benjamini–Hochberg corrected p values are reported. (k) Immune network correlations of mild, (l) moderate and (m) severe adult cases depicting correlations stronger than absolute value of 0.4 and p < 0.05 were shown. The numbers in nodes represent the immune subset IDs for given cell subset type.
Figure 4
Figure 4
Immune subsets linked to disease severity exhibit consistent kinetics during recovery, potentially reflecting underlying immune variation. (ak) Immune subsets correlated with disease severity are depicted across three timepoints. T1 (grey) represents PCR+ samples, while T2–T3 display (blue) PCR- recovering samples for each individual. Red circle represents severe adult cases at T1.

Similar articles

References

    1. Witkowski JM, Fulop T, Bryl E. Immunosenescence and COVID-19. Mech. Ageing Dev. 2022;204:111672–111672. doi: 10.1016/j.mad.2022.111672. - DOI - PMC - PubMed
    1. Fulop T, Larbi A, Hirokawa K, Cohen AA, Witkowski JM. Immunosenescence is both functional adaptive and dysfunctional maladaptive. Semin. Immunopathol. 2020 doi: 10.1007/s00281-020-00818-9. - DOI - PMC - PubMed
    1. Bartleson JM, et al. SARS-CoV-2, COVID-19 and the aging immune system. Nat. Aging. 2021;1:769–782. doi: 10.1038/s43587-021-00114-7. - DOI - PMC - PubMed
    1. Lynch SM, Guo G, Gibson D, Bjourson AJ, Rai TS. Role of senescence and aging in SARS-CoV-2 infection and COVID-19 disease. Cells. 2021;10:3367. doi: 10.3390/cells10123367. - DOI - PMC - PubMed
    1. Liechti T, et al. Immune phenotypes that are associated with subsequent COVID-19 severity inferred from post-recovery samples. Nat. Commun. 2022;13:7255. doi: 10.1038/s41467-022-34638-2. - DOI - PMC - PubMed