. 2024 Mar 2;27(1):18.
doi: 10.1007/s10071-024-01854-w.

Gestural communication in wild spider monkeys (Ateles geoffroyi)

Affiliations

Gestural communication in wild spider monkeys (Ateles geoffroyi)

Felipe Villa-Larenas et al. Anim Cogn. .

Abstract

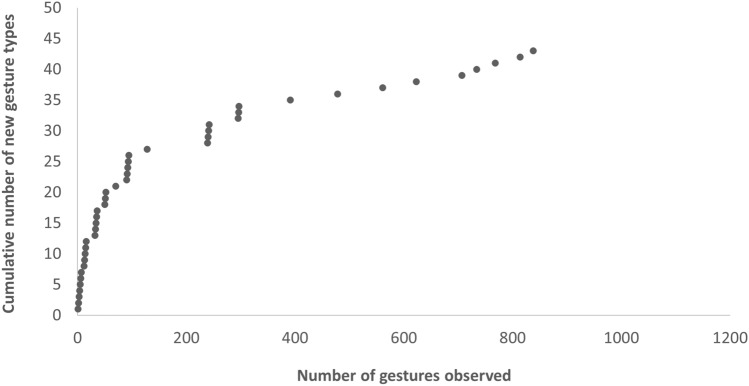
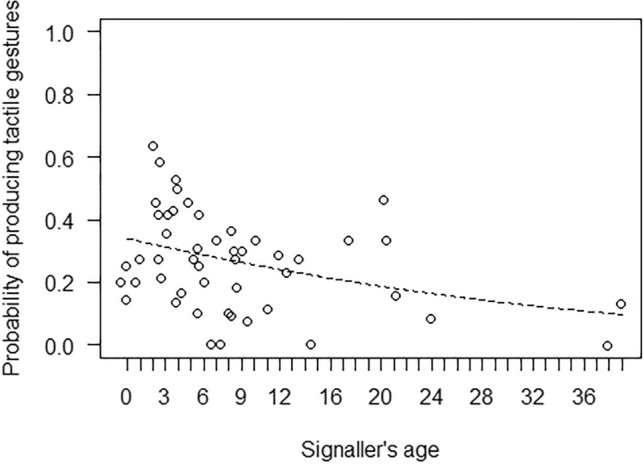
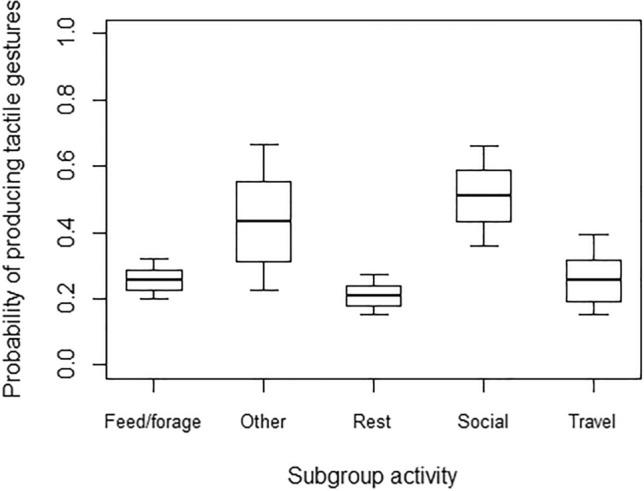
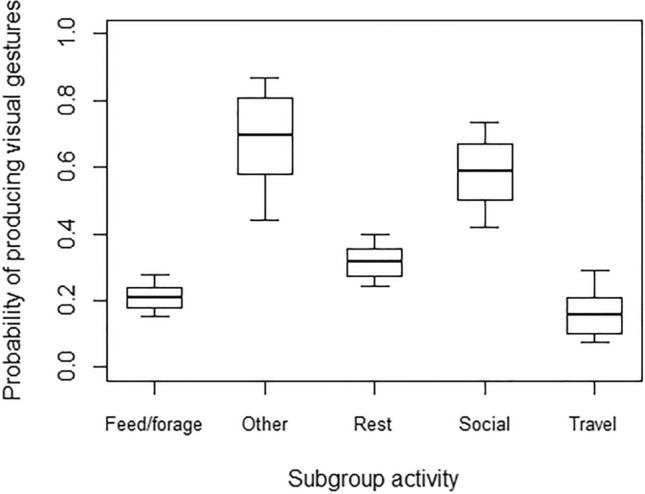
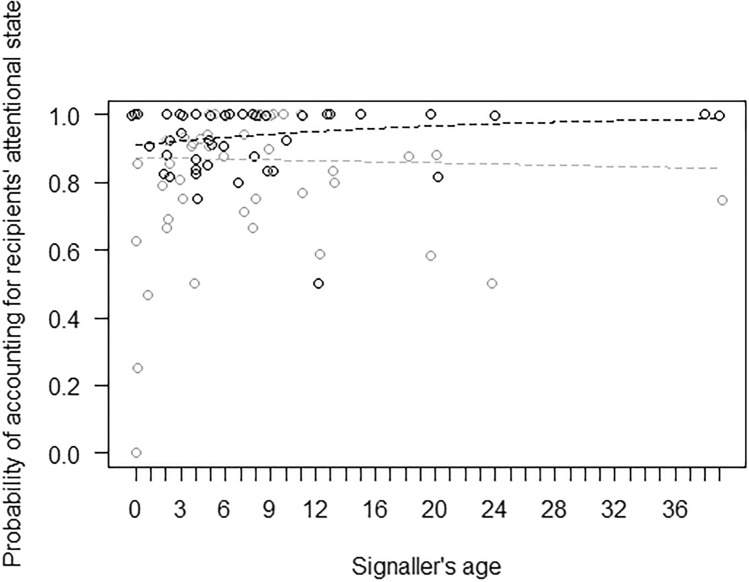
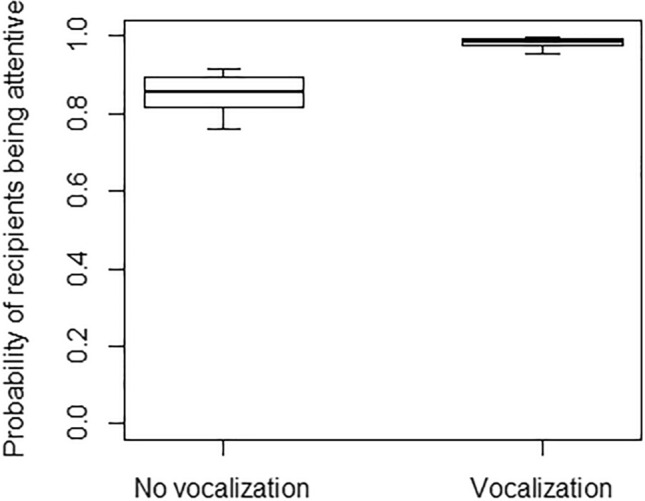
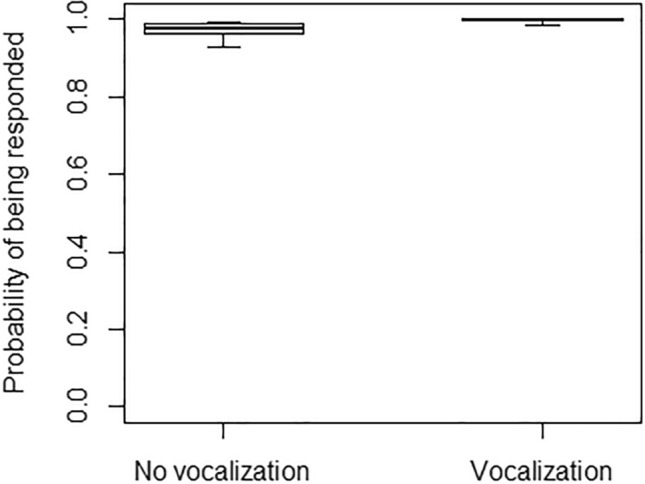
Gestures play a central role in the communication systems of several animal families, including primates. In this study, we provide a first assessment of the gestural systems of a Platyrrhine species, Geoffroy's spider monkeys (Ateles geoffroyi). We observed a wild group of 52 spider monkeys and assessed the distribution of visual and tactile gestures in the group, the size of individual repertoires and the intentionality and effectiveness of individuals' gestural production. Our results showed that younger spider monkeys were more likely than older ones to use tactile gestures. In contrast, we found no inter-individual differences in the probability of producing visual gestures. Repertoire size did not vary with age, but the probability of accounting for recipients' attentional state was higher for older monkeys than for younger ones, especially for gestures in the visual modality. Using vocalizations right before the gesture increased the probability of gesturing towards attentive recipients and of receiving a response, although age had no effect on the probability of gestures being responded. Overall, our study provides first evidence of gestural production in a Platyrrhine species, and confirms this taxon as a valid candidate for research on animal communication.

Keywords: Communication; Intentionality; Platyrrhines; Repertoire size; Visual and tactile gestures.


Conflict of interest statement

None of the authors had any financial or non-financial interest directly or indirectly related to the work submitted for publication.

Figures

Fig. 1
Fig. 1
Cumulative number of new gesture types being observed in the study group, as a function of the number of gestures observed
Fig. 2
Fig. 2
Probability of producing at least one gesture in the tactile modality during the 15-min focal, as a function of the signaller’s age (in years; infants: < 2 years; juveniles: 2–5 years; subadults: 6–7 years; adults: > 8 years). Circles represent the mean probability of producing tactile gestures for each signaller (N = 49), after aggregating the data points used for Model 1. The line represents the fitted model, which was like Model 1 but unconditional on all the factors that were standardized, and with observational effort expressed in 15-min intervals. The probability of producing tactile gestures was significantly higher for younger than older individuals
Fig. 3
Fig. 3
Probability of producing at least one gesture in the tactile modality during the 15-min focal, as a function of subgroup activity. The thick lines of the box plots represent the mean probabilities for each subgroup activity, as estimated by the fitted model, which was like Model 1, but unconditional on all the other factors that were standardized. The ends of the boxes represent the estimated standard errors, and the ends of the whiskers represent the 95% confidence intervals. The probability of producing tactile gestures was significantly higher when the subgroup was mainly engaged in social interactions, rather than feeding/foraging or resting
Fig. 4
Fig. 4
Probability of producing at least one gesture in the visual modality during the 15-min focal, as a function of subgroup activity. The thick lines of the box plots represent the mean probabilities for each subgroup activity, as estimated by the fitted model, which was like Model 2, but unconditional on all the other factors that were standardized. The ends of the boxes represent the estimated standard errors, and the ends of the whiskers represent the 95% confidence intervals. The probability of producing visual gestures was significantly higher when the subgroup was mainly engaged in social interactions or other behaviours, as compared to feeding/foraging, resting or travelling
Fig. 5
Fig. 5
Separately for the tactile modality (in grey) and the visual modality (in black), probability of accounting for recipients’ visual attentional state when producing a gesture, as a function of the signaller’s age (in years; infants: < 2 years; juveniles: 2–5 years; subadults: 6–7 years; adults: > 8 years). Circles represent the mean probability of accounting for recipients’ attentional state for each signaller and modality, after aggregating the data points used for Model 4 (5 individuals were observed in only one modality and the total number of data points is therefore 93). The line represents the fitted model, which was like Model 4, but unconditional on all the factors that were standardized. The probability of accounting for recipients’ attentional state was higher for older individuals, but only for visual gestures, remaining instead similar for tactile gestures
Fig. 6
Fig. 6
Probability of recipients being attentive, as a function of vocalizations being produced (Vocalization) or not being produced (No vocalizations) in the 2 sec preceding the gesture. The thick lines of the box plots represent the mean probabilities in the two conditions, as estimated by the fitted model, which was like Model 4, but unconditional on all the other factors that were standardized. The ends of the boxes represent the estimated standard errors, and the ends of the whiskers represent the 95% confidence intervals. The probability of recipients being attentive when the gesture was produced was significantly higher when gestures were preceded by a vocalization, as compared to when they were not
Fig. 7
Fig. 7
Probability of gestures being responded, as a function of vocalizations being produced (Vocalization) or not being produced (No vocalizations) in the 2 sec preceding the gesture. The thick lines of the box plots represent the mean probabilities in the two conditions, as estimated by the fitted model, which was like Model 4, but unconditional on all the other factors that were standardized. The ends of the boxes represent the estimated standard errors, and the ends of the whiskers represent the 95% confidence intervals. The probability of gestures being responded was significantly higher when gestures were preceded by a vocalization, as compared to when they were not

Similar articles

Cited by

References

    1. Altmann J (1974) Observational study of behavior: sampling methods. Behaviour 49:227–266 - PubMed
    1. American Society of Primatologists (2001) Principles for the ethical treatment of nonhuman primates. https://www.asp.org/2021/04/20/principles-for-the-ethical-treatment-of-n.... Accessed 13 Feb 2023
    1. Amici F, Liebal K (2022a) The social dynamics of complex gestural communication in great and lesser apes (Pan troglodytes, Pongo abelii, Symphalangus syndactylus). Philos Trans R Soc Lond B Biol Sci 377:20210299 - PMC - PubMed
    1. Amici F, Liebal K (2022b) Testing hypotheses for the emergence of gestural communication in great and small apes (Pan troglodytes, Pongo abelii, Symphalangus syndactylus). Int J Primatol. 10.1007/s10764-022-00342-7 - PMC - PubMed
    1. Amici F, Oña L, Liebal K (2022) Compositionality in primate gestural communication and multicomponent signal displays. Int J Primatol. 10.1007/s10764-022-00316-9 - PubMed

LinkOut - more resources