. 2024 Mar;26(3):378-392.
doi: 10.1038/s41556-024-01356-4. Epub 2024 Mar 1.

Combinatorial selective ER-phagy remodels the ER during neurogenesis

Affiliations

Combinatorial selective ER-phagy remodels the ER during neurogenesis

Melissa J Hoyer et al. Nat Cell Biol. 2024 Mar.

Erratum in

Abstract

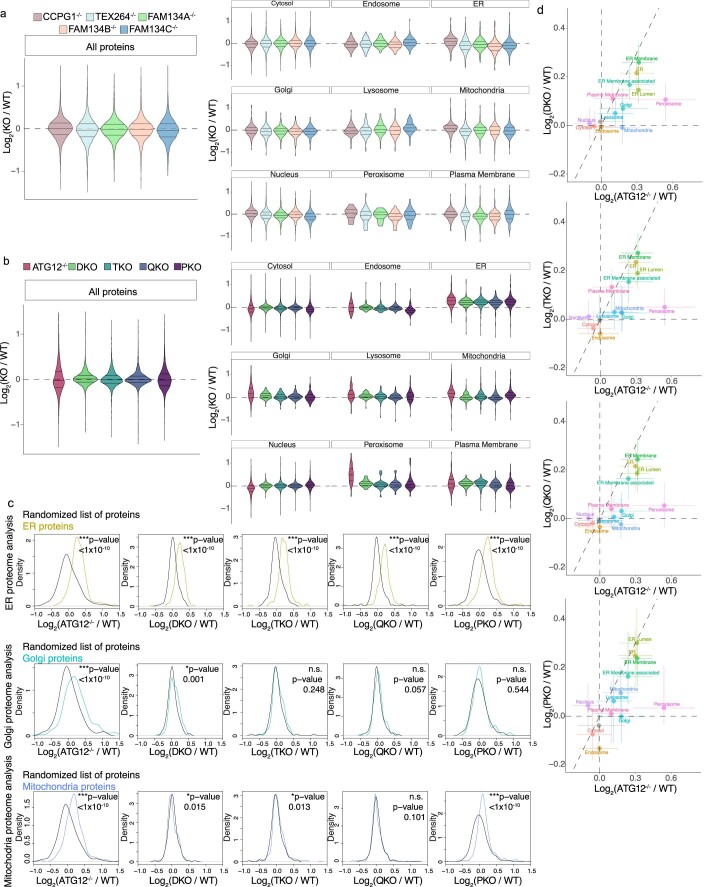
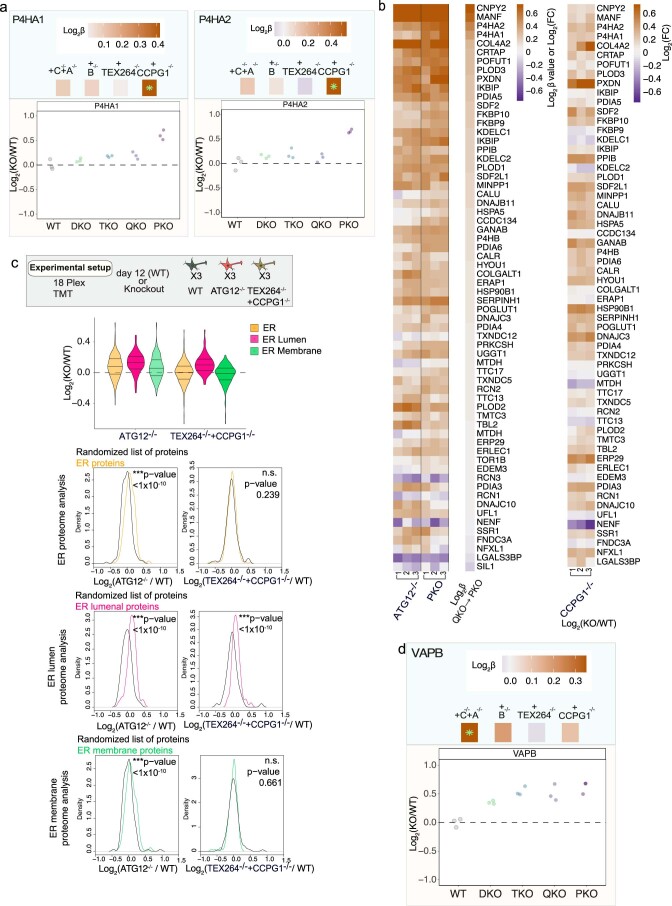
The endoplasmic reticulum (ER) employs a diverse proteome landscape to orchestrate many cellular functions, ranging from protein and lipid synthesis to calcium ion flux and inter-organelle communication. A case in point concerns the process of neurogenesis, where a refined tubular ER network is assembled via ER shaping proteins into the newly formed neuronal projections to create highly polarized dendrites and axons. Previous studies have suggested a role for autophagy in ER remodelling, as autophagy-deficient neurons in vivo display axonal ER accumulation within synaptic boutons, and the membrane-embedded ER-phagy receptor FAM134B has been genetically linked with human sensory and autonomic neuropathy. However, our understanding of the mechanisms underlying selective removal of the ER and the role of individual ER-phagy receptors is limited. Here we combine a genetically tractable induced neuron (iNeuron) system for monitoring ER remodelling during in vitro differentiation with proteomic and computational tools to create a quantitative landscape of ER proteome remodelling via selective autophagy. Through analysis of single and combinatorial ER-phagy receptor mutants, we delineate the extent to which each receptor contributes to both the magnitude and selectivity of ER protein clearance. We define specific subsets of ER membrane or lumenal proteins as preferred clients for distinct receptors. Using spatial sensors and flux reporters, we demonstrate receptor-specific autophagic capture of ER in axons, and directly visualize tubular ER membranes within autophagosomes in neuronal projections by cryo-electron tomography. This molecular inventory of ER proteome remodelling and versatile genetic toolkit provide a quantitative framework for understanding the contributions of individual ER-phagy receptors for reshaping ER during cell state transitions.


Conflict of interest statement

J.W.H. is a consultant and founder of Caraway Therapeutics (a wholly owned subsidiary of Merck & Co) and is a member of the scientific advisory board for Lyterian Therapeutics. B.A.S. is a co-founding scientific advisory board member of Interline Therapeutics and on the scientific advisory boards of Biotheryx and Proxygen. W.B. holds additional appointments as an honorary Professor at the Technical University Munich and a Distinguished Professor at ShanghaiTech University and is a member of the Life Science Advisory Board of Thermo Fisher Scientific. The other authors declare no competing interests.

Figures

Fig. 1
Fig. 1. Landscape of ER remodelling via autophagy during hESC differentiation to iNeurons in vitro.
a, Changes in abundance of the most highly remodelled ER proteins during conversion of WT hESCs to iNeurons are shown in heatmaps (log2 fold change (FC) at the indicated day of differentiation relative to hESCs). The top 50 proteins that either decrease or increase in abundance are shown (see Extended Data Fig. 1b for a full heatmap). Data are from our previous analysis of iNeuron differentiation. Annotations depicting the type of ER protein are indicated by the relevant colours. b, Heatmap (log2FC) of ER-shaping proteins specifically in differentiating iNeurons. c, Volcano plot (−log10(adjusted P value) versus log2FC (ATG12−/−/WT)) of day-12 WT and ATG12−/− iNeuron total proteomes, displaying accumulation of autophagy-related and ER proteins (green dots) as a cohort. Each dot represents the average of triplicate TMT measurements. P values were calculated from the Student’s t-test (two sided) and adjusted for multiple hypothesis correction using the Benjamini–Hochberg approach. d, Violin plots for individual classes of ER proteins showing the relative increases in abundance in ATG12−/− day-12 iNeurons compared with WT iNeurons. Each dot represents the average of triplicate TMT measurements. e, Heatmap (log2FC) of ER-shaping proteins specifically in day-12 WT versus ATG12−/− iNeurons. An asterisk after a gene name indicates significant changes in abundance: *Adjusted P < 0.05, Student’s t-test (two-sided), multiple hypothesis correction using the Benjamini–Hochberg approach. f, Topology of ER-shaping proteins and ER-phagy receptors within the ER membrane. The annotation colour scheme for individual classes of ER proteins in e also applies to b. MS, mass spectrometry.
Fig. 2
Fig. 2. Autophagy-dependent clearance of ER in axons during iNeuron differentiation.
a, WT or ATG12−/− day-20 iNeurons immunostained with ER-tubule marker α-RTN4 (white) and with DAPI (nuclei, blue). Scale bars, 50 μm (full images) and 10 μm (zooms). b, Enlarged ER-positive structures in ATG12−/− day-20 iNeuron axons revealed by immunostaining with α-calnexin, ER (white); α-MAP2, dendrites (green); α-NEFH, axons (magenta); and DAPI, nuclei (blue). Scale bars, 10 μm (full image) and 5 μm (zooms). c, As in b, day-20 iNeurons were immunostained with α-NEFH and α-calnexin to identify aberrant ER structures; here we compare the zoomed-in region of axons in ATG12−/− iNeurons to a similar region for WT iNeurons. Scale bar, 5 μm. d, Min-to-max box-and-whiskers plot for the number of axonal ER accumulations per nucleus, where the box represents the 25th to 75th percentiles, whiskers extend from min to max values, the line represents the median and + the mean. Points represent mean values from four independent differentiations (n = 4). *P < 0.05, two-sided Mann–Whitney test. e, Min-to-max box-and-whiskers plot for the area of ER accumulations in axons, where the box represents the 25th to 75th percentiles, whiskers extend from min to max values, the line represents the median and + the mean. Four points for each condition give the resulting mean areas from four independent differentiations. *P < 0.05; two-sided Mann–Whitney test. f,g, Scanning transmission EM of thin sections from WT and ATG12−/− iNeuron cultures (day 20, one differentiation). Panel f presents low-magnification images through multiple axons. Panel g presents high-magnification images of WT example 1 and example 2 and one ATG12 region, all outlined in f, as well as one additional zoom example 2 from another ATG12−/− iNeuron field of view. Scale bars, 500 nm.
Fig. 3
Fig. 3. ER-phagic flux in iNeurons.
a, hESCs expressing Keima-RAMP4 were differentiated to iNeurons. Keima was imaged at days 0, 1, 4 and 12. Scale bar, 10 μm. b, hESCs expressing Keima-REEP5 were differentiated to iNeurons and the Keima signal was imaged at days 0, 1, 4 and 12. Representative cell images are from one differentiation experiment. Scale bar, 10 μm. c,d, WT or ATG12−/− Keima-RAMP4 flux (c) or Keima-REEP5 flux (d) was measured by flow cytometry at days 0, 4 and 12 of differentiation. The ratio of acidic to neutral Keima fluorescence was normalized to samples treated with BAFA (100 nM, 4 h). e, Images of reduced Keima-RAMP4 flux in ATG12−/− iNeurons or upon VPS34 inhibitor (VPS34i, 1 μM) treatment. Scale bar, 10 μm. f, WT or ATG12−/− hESCs differentiated with or without VPS34i as indicated in the scheme. In some conditions, VPS34i was washed out at the time indicated (24 or 48 h), before collection at day 12 and subsequent analysis by flow cytometry. In f and g, the ratio of acidic to neutral Keima fluorescence was measured via flow cytometry as in c. g, Ongoing ER-phagic flux in day 15 iNeurons was measured. WT or ATG12−/− hESCs were differentiated in the presence or absence of VPS34i, as indicated in the scheme. In some cases, VPS34i was added at day 19 or day 15, before collection at day 20 and subsequent analysis by flow cytometry. In c, d, f and g, each point represents one of three biological triplicate measurements (n = 3). Data are presented as mean values ± s.d. *P < 0.05; **P < 0.01; ***P < 0.001; NS, not significant; Brown–Forsythe and Welch one-way analysis of variance (ANOVA) and Dunnett’s T3 multiple comparisons test. h, Live cells expressing Keima-RAMP4 in WT and ATG12−/− day-20 iNeurons were imaged. Representative cell images are from three replicate differentiation experiments. Scale bars, 10 μm (full images) and 5 μm (zooms). Insets: the results of acidic/neutral ratiometric line-scan analysis for somata (lines labelled 1) or axons (lines labelled 2) of WT or ATG12−/− iNeurons.
Fig. 4
Fig. 4. Axonal trafficking of TEX264-GFP and FAM134C-GFP-containing autophagosomes via live-cell imaging.
a,b, TEX264-GFP (green) and mCh-LC3B (magenta) day-30 iNeurons imaged live (a), in a representative event from three replicate differentiation experiments. Inset in b: positions of mCh-LC3B/TEX264-GFP-positive puncta trafficking within an axon. Arrows indicate puncta positions over two indicated time sequences. Scale bars, 10 μm (a) and 5 μm (b). c, Rate of TEX264-GFP/mCh-LC3B-positive puncta movements (n = 429), and the percentage of events at the indicated speeds are binned in a histogram (events from three replicate differentiation experiments). d, As in b, but for FAM134C-GFP/mCh-LC3B-positive puncta, in a representative event from three replicate differentiation experiments. e, TEX264-GFP/mCh-LC3B-positive puncta are in dilated regions of WT iNeuron axons and traffic away (left), but puncta are not detected in ATG12−/− iNeurons (right). Representative events from two replicate differentiation experiments are shown. Scale bars, 10 μm.
Fig. 5
Fig. 5. Observation of tubular ER within autophagosomes in neuronal projections by correlative cryo-ET.
a, Experimental strategy used to capture autophagosomes in the projections of iNeurons. Induced pluripotent stem cells (iPSCs) were differentiated on EM grids and transduced with fluorescence markers before plunge-freezing at day 18. After imaging the sample by cryo-fluorescence microscopy (cryo-FLM), autophagosomes in the neuronal projections are identified in TEM images based on morphological features, and captured by cryo-ET. Two-dimensional (2D) correlation of TEM images with previously acquired fluorescence data shows whether the autophagosomes correlate or not with fluorescence markers such as TEX264-GFP. b, Cargo and TEX264-GFP correlation analysis of the captured autophagosomes. The barplot on top shows the number of autophagosomes in which ER tubular cargo is present (green, n = 21) or not (grey, n = 16). The pie charts show the number of structures corresponding to TEX264-GFP signal in each category. ch, Examples of TEX264-GFP-positive autophagosomes with tubular ER cargo captured in situ by cryo-ET from one differentiation experiment. c,f, 3D segmentations reveal double-membrane autophagosomes (magenta) containing ER tubules as cargo (yellow) and close to microtubules (white). The tubular ER cargo of autophagosome 1 (c) exhibits a morphology similar to the adjacent cytosolic ER (green). For a full tomogram movie of autophagosome 1, see Supplementary Video 4. For full segmentation of the ER tubules, see Extended Data Fig. 3e. d,g, Zoomed-in 11500X TEM images corresponding to autophagosomes 1 (d) and 2 (g) overlaid with the TEX264-GFP cryo-fluorescence signal. For a complete view of fluorescence overlays, see Extended Data Fig. 3k,m. e,h, Tomogram slices of autophagosomes 1 (e) and 2 (h), denoised with cryo-CARE. White lines indicate the plasma membrane (PM) of the neuronal projections containing the autophagosomes. Asterisks indicate the tubular ER cargo visible in these slices. AP, autophagosome; MT, microtubule. All scale bars, 200 nm.
Fig. 6
Fig. 6. Combinatorial regulation of ER clearance via ER-phagy receptors during neurogenesis in vitro.
a,b, A toolkit for analysis of ER-phagy receptors. hESCs were subjected to CRISPR-Cas9 gene editing to delete individual (a) or multiple (b) receptors. Keima-RAMP4 was expressed in each of the mutant hESCs, before analysis during differentiation. c,d, Ratiometric analysis of Keima-RAMP4 flux in the indicated WT or mutant hESCs was measured by flow cytometry at day 12 of differentiation. The ratio of acidic to neutral Keima fluorescence was normalized to samples treated with BAFA (100 nM) for 4 h. Each measurement reflects biological triplicate measurements. Data are presented as mean values ± s.d. *P < 0.05; **P < 0.01; NS, not significant; Brown–Forsythe and Welch one-way ANOVA and Dunnett’s T3 multiple comparisons test. e,f, PKO iNeurons accumulate aberrant ER structures, particularly in axons. Day 20 iNeurons of the indicated genotypes were immunostained with α-calnexin (ER, white), α-MAP2 (dendrites, green), α-NEFH (axons, magenta) and with DAPI (nuclei, blue) (e). A further zoomed-in region of the WT axonal region is also shown in Fig. 2 to compare only WT and ATG12−/−. Scale bars, 25 μm (full images) and 5 μm (zooms). The number of axonal ER accumulations per nucleus (f, top) or mean area of ER accumulation (f, bottom) are represented with min-to-max box-and-whiskers plots (the box represents the 25th to 75th percentiles, whiskers extend from min to max values, the line represents the median and + the mean). Four points shown for each WT or KO condition represent the measured values from four independent differentiations. *P < 0.05; two-sided Mann–Whitney test. g, TEM images of sections though WT, ATG12−/− and PKO axons from one differentiation experiment containing enlarged structures with areas of ER membranes. Scale bar, 500 nm.
Fig. 7
Fig. 7. Selectivity of ER-phagy receptors in ER remodelling in iNeurons revealed by combinatorial multiplexed proteomics.
a, Scheme depicting an 18-plex TMT experiment examining the total proteomes of the indicated single ER-phagy receptor mutant day-12 iNeurons. Violin plots (lower panel) depicting log2FC (mutant/WT) for the indicated classes of ER proteins in single-mutant iNeurons (day 12) are shown in the lower plot. b, Scheme depicting an 18-plex TMT experiment examining the total proteomes of the indicated combinatorial ER-phagy receptor mutant day-12 iNeurons. Violin plots (lower panel) depicting log2FC (mutant/WT) for the indicated classes of ER proteins in combinatorial mutant iNeurons (day 12) are shown in the lower plot. c, log2FC (mutant/WT) distributions of ER proteins compared to randomized selections of the same number of proteins (100 iterations). P values for each comparison are calculated with a Kolmogorov–Smirnov test (two-sided). d, Application of a linear model to identify selective cargo for individual ER-phagy receptors via quantitative proteomics. In the linear model, a coefficient FC (β) is calculated for sequential loss of ER-phagy receptors starting from WT to DKO, then DKO to TKO, then TKO to QKO, then QKO to PKO. e, β coefficient values (top panel) and log2FC (lower panel) for FAM134A. The green asterisk in the top panel indicates a significant change (adjusted P value of <0.05) in the β coefficient for that mutant. P values for β values extracted from the linear model are calculated with a Student’s t-test (two-sided), with multiple hypothesis correction using the Benjamini–Hochberg method. This analysis is distinct from traditional comparisons between each mutant and WT (lower panel). f, Violin plots depicting the β coefficient FC for the indicated classes of ER proteins. P values for each comparison are calculated with a one-sided Wilcoxon test with Bonferroni correction. g, Top 25 accumulating ER proteins in WT to DKO and QKO to PKO and their respective ER compartment compared to the landscape of the whole ER. The TMT ratio check and normalization are available in the source data. Source data
Fig. 8
Fig. 8. ER-phagy receptor remodelling of the ER proteome landscape and ER-phagy receptor cargo specificity during iNeuron differentiation.
a, Top 25 accumulated and bottom five depleted ER proteins ranked on WT to DKO β-coefficient values (left panel), QKO to PKO β-coefficient values (middle panel) or on log2FC (ATG12−/−/WT). b, ER-associated, ER-membrane or ER-lumenal distribution and predicted TM character of ER proteins with significant β-coefficient values (*adjusted P value < 0.05) in WT to DKO (111 up, 4 down), TKO to QKO (1 down) and QKO to PKO (39 up, 5 down). Zero proteins were significant in DKO to TKO. Each protein name is coloured based on whether there is a significant change in these steps in the allelic series, as shown in the legend. The corresponding β-coefficient value heatmap for each protein is coloured in if there is a significant change and left blank if there is no significant change at that step in the allelic series (see legend). P values for the β values extracted from the linear model are calculated with a Student’s t-test (two-sided), and multiple hypothesis correction using the Benjamini–Hochberg method. c, Examples of ER-shaping proteins with significant β coefficients that accumulate at one or more steps in the allelic series. β-coefficient values (top panels) and log2FC (lower panels) are shown for single proteins, including RTN1-C, RTN3 and REEP5. d, Keima-REEP5 flux measurements in WT, ATG12−/− and PKO iNeurons (day 12) using acidic/neutral ratios in the presence of BAFA for normalization. e, As in c, but for proteins REEP1 and REEP3 (ER-shaping proteins with significant β coefficients that decrease). f, As in c and e, but for VAPA (an ER-membrane protein that forms contact sites with other organelles). g, Autophagic flux assay for Keima-VAPA in WT, ATG12−/− or PKO iNeurons (day 12). For the individual protein plots in c, e and f, the green asterisks in the top panels indicate a significant change (*adjusted P value < 0.05) in β coefficients for each mutant, Student’s t-test (two-sided), with multiple hypothesis correction using the Benjamini–Hochberg method. For autophagic flux experiments using Keima-REEP5 and Keima-VAPA, n = 3, data are presented as mean values ± s.d. *P < 0.05; **P < 0.01; Brown–Forsythe and Welch one-way ANOVA and Dunnett’s T3 multiple comparisons test.
Extended Data Fig. 1
Extended Data Fig. 1. Landscape of ER remodelling via autophagy during hESC differentiation to iNeurons in vitro.
a, Landscape of the ER proteome and the effect of autophagy on accumulation of individual proteins. The ER proteome (359 proteins, Supplementary Data Table 1) is organized into functional modules and protein attributes (involved in ER membrane curvature, ER-associated, ER-membrane, ER-Lumen or ER-phagy receptor) are indicated by the respective outline box colour (see inset legend). For proteins with transmembrane segments, the number of segments are indicated after the protein name (_1, _2, etc) based on data in Uniprot. The text of each protein name is coloured based on day12 ATG12−/− vs WT Log2FC (see inset legend). (Supplementary Data Table 3). b, Changes in the abundance of the ER proteome (267 detected proteins) during conversion of WT hESCs to iNeurons are shown in as heatmaps (Log2FC) at the indicated day of differentiation relative to hESCs. Data are from our previous analysis of iNeuron differentiation. Annotations of the type of ER protein are indicated by the relevant colours. c, hESCs were differentiated to iNeurons and stained with antibodies against CKAP4 enriched in ER sheets (magenta) and RTN4 enriched in ER-tubules (green) at day 0, 4 and 12 of one differentiation. RTN4 staining is evident throughout neuronal projections. Scale bar, 100 microns in full images, 25 microns in all zooms. d, Violin plots for relative abundance of proteins located in the indicated organelles in ATG12−/− versus WT day 12 iNeurons. e, Immunoblots of cell extracts from WT or ATG12 −/− hESCs for the indicated day of differentiation for one differentiation. Blots were probed with the indicated antibodies, with α-HSP90 employed as a loading control. f, For the immunoblots in e, relative levels of each protein to HSP90 were quantified. Source numerical data and unprocessed blots are available in source data. Source data
Extended Data Fig. 2
Extended Data Fig. 2. Quality control of in vitro neurogenesis methods.
a, The indicated hESCs were either cultured in the pluripotent state (day 0) or converted to day 12 iNeurons prior to total proteome analysis by multiplex TMT in biological triplicate cultures (n=3). The relative abundance (Log2 FC) of the indicated neurogenesis or pluripotency factors at day 12 relative to day 0 is shown, indicating that all genotypes undergo differentiation to a similar extent as measured by markers of the process. b, Comparable number of viable iNeurons were observed upon quantitative analysis of intact DAPI-positive nuclei compared to all DAPI-positive (intact and fragmented) DNA structures in cultures of the indicated genotypes. Four points shown for each WT or KO condition represent the measured ratios from the same four independent differentiations also analysed for ER structure per nuclei in Fig. 2b. Data are presented as mean values +/-SEM. *, p<0.05, two sided Mann–Whitney test. c,d Quantification of DAPI -positive TUNEL-negative nuclei in day 20 iNeurons from the indicated genotypes (c) and representative images of DAPI-positive nuclei in green and TUNEL-stained DAPI-positive fragmented nuclei, with TUNEL signal in magenta (d). The lower panels are magnified regions (merges and separate image channels) of the area boxed in the respective image above. Four points shown for each WT or KO condition represent the measured values from four independent differentiations. Data are presented as mean values +/-SEM. *, p<0.05, two sided Mann–Whitney test. Scale bar, 100 microns (top), 10 microns (bottom) e, ATF4 abundance was examined by immunoblotting of extracts from day 12 iNeurons from the indicated genotypes with or without treatment with tunicamycin as a positive control for induction of the ER-stress stress response. Tunicamycin was used at 0.1 or 1.0 μg/ml for 6 or 12 h, as indicated. Blots were reprobed with α-tubulin as a loading control. The relative α-ATF4 signal, normalized for tubulin, is shown in the histogram (right panel) with the dashed line representing ATF4 signal in untreated WT cells. n=1. f, XBP1 and XBP1s mRNA from the indicated iNeurons in biological triplicate (n=3) cultures was subjected to reverse transcription-PCR (see Methods) and examined by agarose gel electrophoresis to resolve spliced and unspliced XBP1. 1.0 μg/ml tunicamycin (6h) was employed as a positive control for induction of ER stress and XBP1 splicing. GAPDH was used as a positive control. The XBP1s/XBP1 ratio was quantified as shown in the histogram (right panel). No evidence of increased XBP1 splicing was observed in any genotype under untreated conditions. Data are presented as mean values +/-SEM. *, p<0.05; **, p<0.01; n.s., not significant; Brown–Forsythe and Welch One-way ANOVA and Dunnett’s T3 multiple comparisons test. g, TEX264-GFP, TEX264F273A-GFP, or FAM134C-GFP were expressed in WT or ATG12−/− hESCs and cells imaged at day 4 of differentiation to iNeurons. In some experiments, VPS34i was added to WT cells for 24h prior to imaging. Arrows mark examples of ER-phagy receptor puncta. h, Expression of TEX264-GFP was verified by immunoblotting of iNeuron extracts using α-HSP90 as a loading control. i, Number of TEX264-GFP puncta was quantified in day 4 iNeurons (n = 1 independent differentiation). Min-to-max box-and-whiskers representing detectable number of puncta per cell, with box representing the 25th to 75th percentile, whiskers going from min to max values, line at median and + at mean. j, Day 30 iNeurons expressing TEX264-GFP and mCh-LC3B were immunostained with α-MAP2 to detect dendrites (white) and α-NEFH to mark axons (blue) and projections imaged by confocal microscopy. One differentiation was fixed and imaged this way. Insets show TEX264-GFP/mCh-LC3B-positive puncta (arrows) or mCh-LC3B-positive but TEX264-GFP-negative puncta (arrowheads) in axons. All scale bars, 10 microns. Source numerical data and unprocessed blots are available in source data. Source data
Extended Data Fig. 3
Extended Data Fig. 3. Analysis of autophagosomes in iNeurons by correlative cryo-ET.
a,125X TEM image of the grid used in this study from one differentiation experiment. The yellow square indicates the region shown in b. b, 800X TEM overview of a grid square. The darker area corresponds to the thicker iNeuron cell bodies; around it, many thinner projections corresponding to axon and dendrites can be observed. The white square indicates a particular area rich in neuronal projections, shown in c. c, 11500X TEM montage acquired to map a potentially interesting area. Extracellular vesicles are also present (white dashed circles). Pieces of ice are sitting on top of the frozen sample (asterisks). Autophagosome 1 (AP) was found in this area. d, Slice of the tomogram of autophagosome 1, denoised with Cryo-CARE. Scale bar, 200 nm. e, 3D rendering of autophagosome 1 with manually refined segmentations of a cytosolic ER tubule (dark green) and a portion of the tubular ER cargo (yellow). f, Cumulative barplot showing number of autophagosomes containing tubular ER cargo (n=21), linked to microtubules (n=24) or both (n=14). g, Example of the 2D-correlation workflow for autophagosome 1. Correlation of the 800X TEM overview with cryo-confocal data, represented by a single in-focus slice of the transmitted light stack (cyan) and maximum intensity projection (MIP) of fluorescence channels. The coloured dots indicate the position of the 2 µm holes that were selected in both images for 2D-registration. After 2D registration, the TEM overview is transformed to match the fluorescence data. h, Overlay of the fluorescence data with the transformed TEM overview. The white square indicates the cropped area used for the second step of the correlation procedure. i, 11500X TEM image of the area around autophagosome 1. The coloured dots indicate features of the image that were used for finer correlation with the cropped fluorescence data. j, Cropped fluorescence data corresponding to the square in g. The colored dots indicate the same correlation points shown in h. The fluorescence data is subsequently transformed to match the 11500X TEM image. k, Final overlay of the fluorescence data over the 11500X TEM image. The white square represents the tomogram position. l, Cumulative barplot showing number of TEX264-GFP positive autophagosomes that contain ER tubular cargo (n=5) and are linked to microtubules (n=4). m, 11500X TEM and fluorescence overlays for TEX264-GFP-positive autophagosomes 2, 3, 4 and 5. n, 3D segmentations, zoomed-in 11500X TEM images overlaid with GFP cryo-fluorescence signal and cryo-CARE denoised slices for autophagosomes 3, 4, and 5. All images are rotated right by 90 degrees compared to their respective full 11500X overlays in m. Autophagosome 3 and 4 are microtubule-linked, while autophagosome 5 is distant from the microtubules (MT). o, Plot showing thickness of all tomograms (n=32) analysed in this work. Each dot represents a tomogram. Black dots indicate the tomograms corresponding to the five TEX264-GFP-positive autophagosomes (AP) shown in this study.
Extended Data Fig. 4
Extended Data Fig. 4. Generation of a genetic toolkit for functional analysis of ER-phagy receptors in iNeurons.
a, MiSeq analysis of single ER-phagy receptor mutants in hESCs. The green highlights the target of the CRISPR gRNA. The sequence of the major MiSeq output is indicated for each allele. b, Immunoblot validation of targets knockout clones at day 12 of differentiation. Confirmation immunoblots for protein deletion in these different genetic backgrounds were performed for each proteomics experiment. Cell extracts were subjected to immunoblotting with the indicated antibodies, employing a Rhodamine-labelled α-tubulin as loading controls. *, position of the ATG12-ATG5 conjugate. c, MiSeq analysis of combinatorial ER-phagy receptor mutants in hESCs, as performed for the single knockouts in a. d, Immunoblot validation of targets in combinatorial knockout clones at day 12. Cell extracts were subjected to immunoblotting as in b. Confirmation immunoblots for protein deletion in these different genetic backgrounds were performed for each proteomics experiment. e, Karyotype analysis of QKO and PKO hESCs revealed no detectable alterations in chromosome number. f, Ratiometric flow cytometry analysis of Keima-RAMP4 flux was measured in WT, ATG12−/−, or the indicated ER-phagy receptor knockout ES cells (day 0 of differentiation). The ratio of acidic to neutral Keima fluorescence was normalized to samples treated with BAFA (100 nM) for 4 h prior to analysis, and where indicated, cells were cultured with VPS34i prior to analysis. Each measurement (represented by a point) reflects a biological triplicate sample. g, As in panel f, but at day 4 of differentiation to iNeurons. For f, and g, Data are presented as mean values +/−SD. n.s., not significant; Brown–Forsythe and Welch One-way ANOVA and Dunnett’s T3 multiple comparisons test. h, Day 12 iNeurons treated Propidium iodine staining and were analysed via flow cytometry. The same gating strategy for live cells was applied to all genotypes, as was done in all Keima flux experiments. Mean values +/-SEM of the percent of live cells (not stained with PI) is displayed. N=3 biological replicates; n.s. not significant; two sided Mann–Whitney test. i, Examples of enlarged axonal structures from WT, ATG12−/− and PKO day 30 iNeurons containing dense tubular ER, as visualized by TEM. Some of these examples were also shown in Fig. 2 to compare only WT and ATG12−/−. Three independent examples are shown. Scale bar, 500nm. Source numerical data, flow cytometry gating strategy, and unprocessed blots are available in source data. Source data
Extended Data Fig. 5
Extended Data Fig. 5. Combinatorial analysis of ER remodelling via ER-phagy receptors during neurogenesis in vitro.
a, Violin plots for changes in individual organelle abundance in the indicated single ER-phagy knockout iNeurons (day 12). b, Violin plots for changes in individual organelle abundance in the indicated combinatorial ER-phagy knockout iNeurons (day 12). c, Log2FC (mutant/WT) distributions of ER proteins (top), Golgi proteins (middle), or mitochondria proteins (bottom) compared to randomized selections of the same number of proteins (100 iterations). p-values for each comparison are calculated with a Kolmogorov–Smirnov Test (two-sided). The ER protein section of the figure (top panel) is reproduced from Fig. 7c. d, Correlation plots for changes in organelle abundance (Log2FC) comparing DKO, TKO, QKO and PKO log2FCs from WT individually with ATG12−/− log2FCs from WT.
Extended Data Fig. 6
Extended Data Fig. 6. Analysis of ER-proteome remodelling in PKO and CALCOCO1−/− iNeurons.
a, Proteomic analysis of two PKO clones (A2 and E4) in parallel with ATG12−/− and WT iNeurons (day 20). The upper panel provides a schematic of the TMT multiplex approach employed. n = 4 biological replicates. Middle panel displays Log2FC for ER protein and selected ER protein categories. Lower panel displays Log2FC for the indicated organelles. b, Heatmap for Log2FC values for the indicated proteins from the experiment in panel a. c, Immunoblot validating deletion of FAM134B, FAM134C, TEX264, and CCPG1 in both clone A2 and E4 for the PKO mutant. d, Modulation of iNeuron proteome in response to inhibition of MTOR with Torin1 (100 nM,15 h). Upper panel shows a schematic of the experimental set-up employing TMT based proteomics to quantity alterations in the proteome if WT or ATG12−/−, PKO iNeurons. Lower panel: Correlation plots comparing the effect of Torin1 on organelles of ATG12−/− cells relative to WT cells and PKO cells relative to WT cells. e, MiSeq analysis of a CALCOCO1−/− H9 hESC clone, showing the position of the gRNA used for CRISPR-Cas9 deletion, and the position of out of frame deletions in the two alleles of CALCOCO1. f, Schematic showing the TMT total proteome strategy for analysis of the effect of CALCOCO1 deletion on organelle abundance in hESCs and day 12 iNeurons (n=3 biological replicates). ATG12−/− cells were included as a positive control. g, Heatmap of Log2FC values for selected proteins from the TMT experiment outlined in panel f, which also demonstrates loss of the CALCOCO1 protein in the CALCOCO1−/− iNeurons. h, Violin plots (Log2FC) for the indicated organelles (top panel) and selected classes of ER proteins (lower panel) for ATG12−/− and CALCOCO1−/− iNeurons (day 12). Loss of CALCOCO1 does not affect the abundance of any of the organelles tested. i, Comparison of Log2FC (mutant/WT) distributions of ER proteins (top) or Golgi proteins (bottom) to distributions of randomized selections of the same number of proteins (100 iterations). p-values for comparisons were calculated with a Kolmogorov–Smirnov Test (two-sided). Unprocessed blots are available in source data. Source data
Extended Data Fig. 7
Extended Data Fig. 7. Overview of ER proteome remodeling via ER-phagy receptors during neurogenesis in vitro.
a, Changes in the abundance (Log2FC) of the ER proteome (267 detected proteins) during conversion in ATG12−/− or combinatorial ER-phagy receptor knockout iNeurons (day 12) are shown as heatmaps. Annotations of the type of ER protein are indicated by the relevant colours. b, Landscape of the ER proteome and the effect of deletion of five ER-phagy receptors (FAM134A/B/C, TEX263 and CCPG1) on accumulation of individual proteins. The ER proteome (359 proteins, Supplementary Data Table 1) is organized into functional modules, and protein attributes (involved in ER membrane curvature, ER-associated, ER-membrane, ER-Lumen or ER-phagy receptor) are indicated by the respective outline box colour (see inset legend). For proteins with transmembrane segments, the number of segments is indicated after the protein name (_1, _2, etc) based on data in Uniprot. The text of each protein name is colored based on day12 PKO vs WT Log2FC (see inset legend). (Supplementary Data Table 3).
Extended Data Fig. 8
Extended Data Fig. 8. Application of a linear model for alterations in ER proteome abundance in sequential ER-phagy receptor knockout cells during iNeuron differentiation.
a, Effect of sequential ER-phagy receptor deletion on the β coefficient values for individual organelles measured by quantitative proteomics in day 12 iNeurons. b, Violin plots reflecting changes in β coefficient values for individual organelles measured by quantitative proteomics in day 12 iNeurons. Curved arrows reflect sequential removal of the indicated ER-phagy receptor. c, Correlation plots for the indicated β coefficient or Log2FC plots comparing organelle abundance for combinatorial or single ER-phagy deletion iNeurons. d, Experiment characterizing FAM134C−/−, FAM134A/C−/−, and FAM134B/C−/− day 12 iNeurons with ATG12−/− iNeurons included as a control. Top left, Immunoblot of extracts from iNeurons of the indicated genotypes (n = 3) were probed with α-ATG5, α-FAM134B, α-FAM134C, or α-tubulin. ATG12−/− cells display loss of the ATG12-ATG5 conjugate as observed with α-ATG5. Top right, experimental scheme for multiplexed total proteome analysis of FAM134C−/−, FAM134A/C−/−, and FAM134B/C−/− iNeurons and ER proteome specific violin plots derived from this analysis. Bottom, organelle-specific violin plots from the experiment. p-values for comparisons between violins were calculated using paired two sided Wilcoxon tests. Unprocessed blots are available in source data. Source data
Extended Data Fig. 9
Extended Data Fig. 9. Differential regulation of ER membrane shaping and disease-linked proteins upon loss of ER-phagy receptors.
a, Heatmaps displaying Log2 FC values for selected ER-shaping proteins for the indicated iNeuron genotypes. b, Heatmaps displaying Log2 FC values for Hereditary Spastic Paraplegia (HSP)-linked proteins or Hereditary Sensory and Autonomic Neuropathy (HSAN)-linked proteins for the indicated iNeuron genotypes. c, Immunoblot of extracts from WT, ATG12−/−, or PKO day 12 iNeurons (n=3) were probed with α-REEP1, α-REEP5, α-RTN3 or α-tubulin as a loading control (blot1) or were probed with α-RTN1C, α-VAPA or α-tubulin as a loading control (blot2). The relative levels of each protein to tubulin were quantified (right). Data are presented as mean values +/-SEM. d-e, Further examples ER shaping proteins that accumulate (d) or decrease (e) with additional ER-phagy receptor knockout. f, Immunoblot of cell extracts isolated from the indicated time point during differentiation (n=1), using α-HSP90 as a loading control. The relative levels of proteins were quantified (right). g, Immunoblot of extracts from WT or FAM134A/C−/− (DKO) iNeurons with or without expression of FAM134C-GFP using a PiggyBac vector (n = 3). Blots were probed with α-TEX264, α-REEP1, α-REEP4 or α-tubulin as a loading control. The relative levels of proteins to tubulin were quantified in the lower panel. Data are presented as mean values +/-SEM. h, Experimental scheme for multiplexed total proteome analysis of WT or FAM134A/C−/− with or without expression of FAM134C-GFP iNeurons (n = 3) and ER protein-specific violin plots derived from this analysis. p-values for comparisons between violins were calculated using paired two sided Wilcoxon tests. i, Heatmap displaying Log2 FC values for selected ER-shaping proteins for the indicated iNeuron genotypes. Source numerical data and unprocessed blots are available in source data. Source data
Extended Data Fig. 10
Extended Data Fig. 10. Differential regulation of ER membrane shaping proteins upon loss of ER-phagy receptors.
a, ER lumenal proteins that accumulate with additional ER-phagy receptor knockout. Top panels are β coefficient values and lower panels are Log2FC; green asterisks in β coefficient for single protein heatmaps indicate significant change (adjusted p-value < 0.05) in β coefficient. b, ER lumenal protein heatmaps reflecting the change in abundance (Log2FC) for deletion of ATG12 or PKO, reflecting β coefficient values for QKO to PKO, (left panel) or reflecting the change in abundance (Log2FC) for single deletion of CCPG1 (right panel). c, Experimental scheme for multiplexed total proteome analysis of WT, ATG12−/− or TEX264−/−/CCPG1−/− iNeurons (n = 3) and violin plots for total ER, ER-lumen, and ER-membrane proteins derived from this analysis. Violin plots from a TMT 18-plex experiment comparing WT, ATG12−/−, and another ER-phagy receptor allelic combination (TEX264−/− +CCPG1−/−) with complementary comparisons of Log2FC (mutant/WT) distributions of ER proteins (top), ER lumenal proteins (middle), or ER membrane proteins (bottom) to distributions of randomized selections of the same number of proteins (100 iterations). p-values for each comparison are calculated with a Kolmogorov–Smirnov Test (two-sided) test. Together these reflect accumulation of the ER, ER lumen and ER membrane for Log2FC (ATG12−/−/WT) but only the ER lumenal proteome accumulates for Log2FC (TEX264−/− +CCPG1−/− /WT). d, ER contact site protein VAPB accumulates with additional ER-phagy receptor knockout. Plot is annotated as in panel a.

Update of

References

    1. Westrate, L. M., Lee, J. E., Prinz, W. A. & Voeltz, G. K. Form follows function: the importance of endoplasmic reticulum shape. Annu. Rev. Biochem.84, 791–811 (2015). - PubMed
    1. Zhang, H. & Hu, J. Shaping the endoplasmic reticulum into a social network. Trends Cell Biol.26, 934–943 (2016). - PubMed
    1. Shibata, Y. et al. Mechanisms determining the morphology of the peripheral ER. Cell143, 774–788 (2010). - PMC - PubMed
    1. Park, S. H. & Blackstone, C. Further assembly required: construction and dynamics of the endoplasmic reticulum network. EMBO Rep.11, 515–521 (2010). - PMC - PubMed
    1. Gubas, A. & Dikic, I. ER remodeling via ER-phagy. Mol. Cell82, 1492–1500 (2022). - PMC - PubMed

Publication types