. 2024 Mar;56(3):395-407.
doi: 10.1038/s41588-023-01651-0. Epub 2024 Mar 1.

Digenic inheritance involving a muscle-specific protein kinase and the giant titin protein causes a skeletal muscle myopathy

Ana Töpf  1 Dan Cox  2 Irina T Zaharieva  3 Valeria Di Leo  2   4 Jaakko Sarparanta  5   6 Per Harald Jonson  5   6 Ian M Sealy  7   8 Andrei Smolnikov  9 Richard J White  7   8 Anna Vihola  5   6   10 Marco Savarese  5   6 Munise Merteroglu  7   11 Neha Wali  12 Kristen M Laricchia  13   14 Cristina Venturini  15 Bas Vroling  16 Sarah L Stenton  13   17 Beryl B Cummings  11 Elizabeth Harris  2   18 Chiara Marini-Bettolo  2 Jordi Diaz-Manera  2 Matt Henderson  19 Rita Barresi  20 Jennifer Duff  2 Eleina M England  13 Jane Patrick  12 Sundos Al-Husayni  21 Valerie Biancalana  22 Alan H Beggs  21 Istvan Bodi  23 Shobhana Bommireddipalli  24 Carsten G Bönnemann  25 Anita Cairns  26 Mei-Ting Chiew  27 Kristl G Claeys  28   29 Sandra T Cooper  24 Mark R Davis  27 Sandra Donkervoort  25 Corrie E Erasmus  30 Mahmoud R Fassad  31   32 Casie A Genetti  21 Carla Grosmann  33 Heinz Jungbluth  34   35 Erik-Jan Kamsteeg  36 Xavière Lornage  22 Wolfgang N Löscher  37 Edoardo Malfatti  38 Adnan Manzur  3 Pilar Martí  39   40 Tiziana E Mongini  41 Nuria Muelas  39   40   42   43 Atsuko Nishikawa  44 Anne O'Donnell-Luria  13   17 Narumi Ogonuki  45 Gina L O'Grady  46 Emily O'Heir  13 Stéphanie Paquay  47 Rahul Phadke  3 Beth A Pletcher  48 Norma B Romero  49 Meyke Schouten  36 Snehal Shah  50 Izelle Smuts  51 Yves Sznajer  52 Giorgio Tasca  2 Robert W Taylor  31   32 Allysa Tuite  48 Peter Van den Bergh  47 Grace VanNoy  13 Nicol C Voermans  53 Julia V Wanschitz  37 Elizabeth Wraige  54 Kimihiko Yoshimura  55 Emily C Oates  9 Osamu Nakagawa  56 Ichizo Nishino  44 Jocelyn Laporte  22 Juan J Vilchez  39   40 Daniel G MacArthur  13   57   58 Anna Sarkozy  3 Heather J Cordell  59 Bjarne Udd  5   6   10 Elisabeth M Busch-Nentwich  7   8 Francesco Muntoni  3   60 Volker Straub  61
Affiliations

Digenic inheritance involving a muscle-specific protein kinase and the giant titin protein causes a skeletal muscle myopathy

Ana Töpf et al. Nat Genet. 2024 Mar.

Abstract

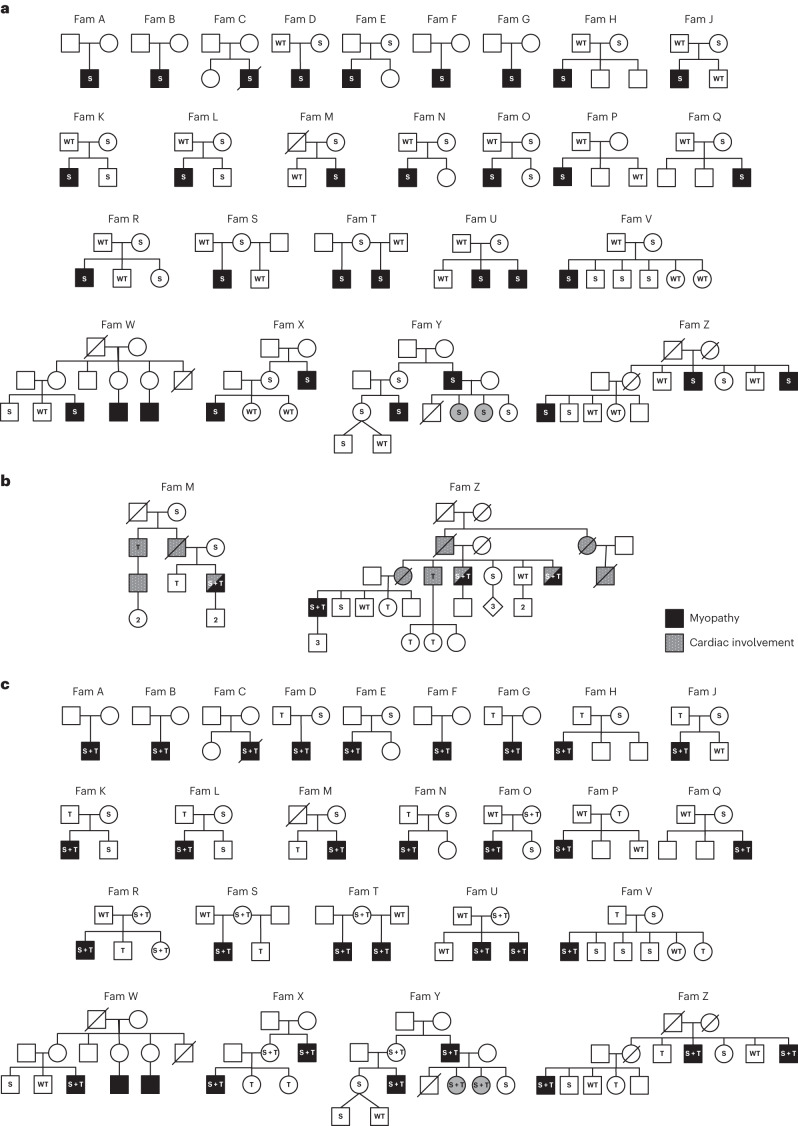
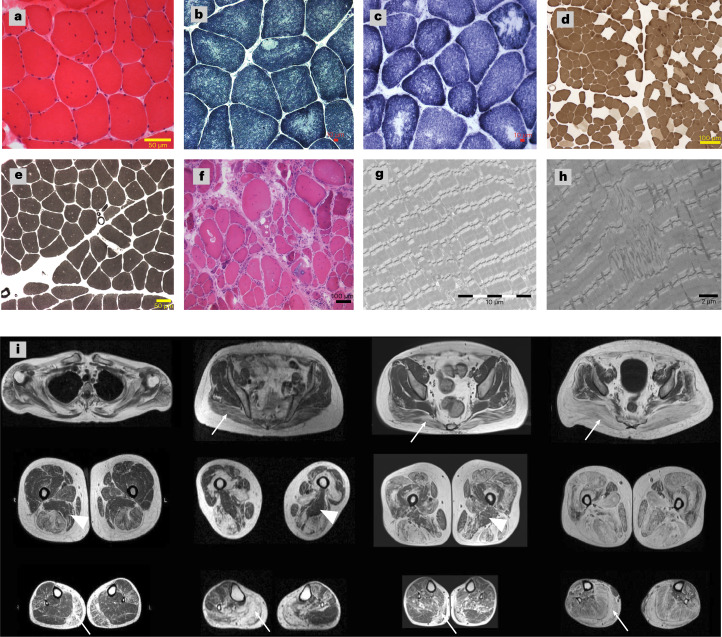
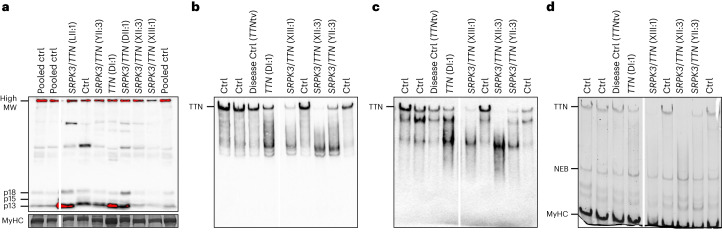
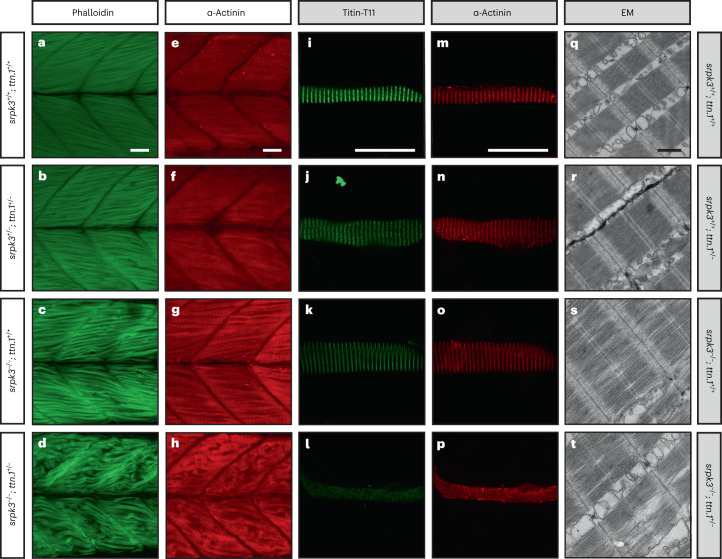
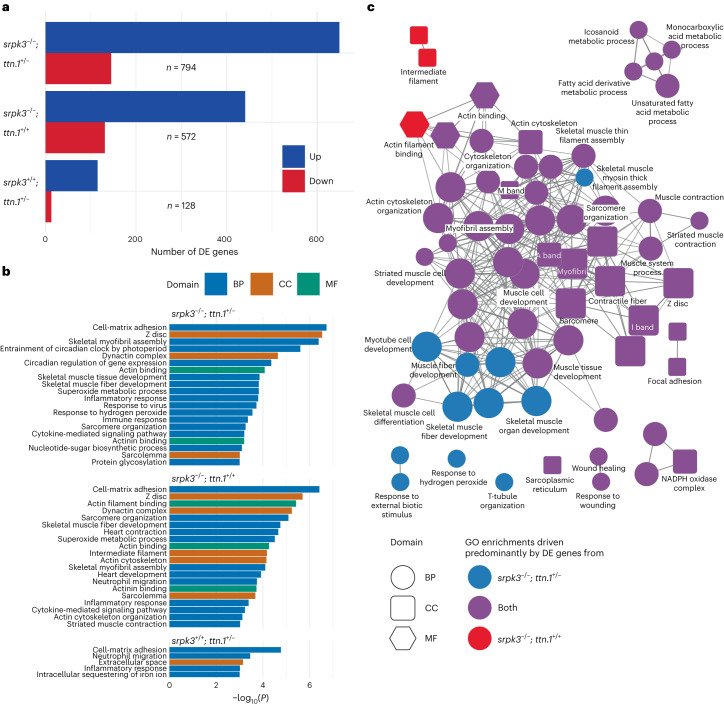
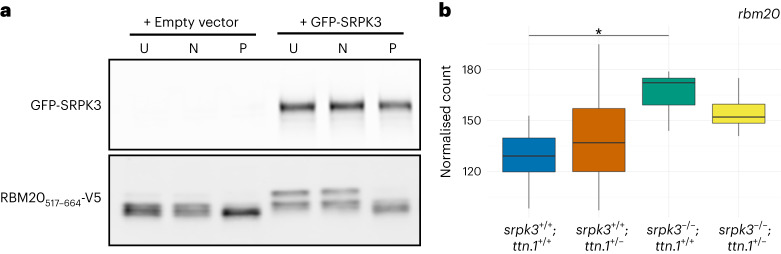
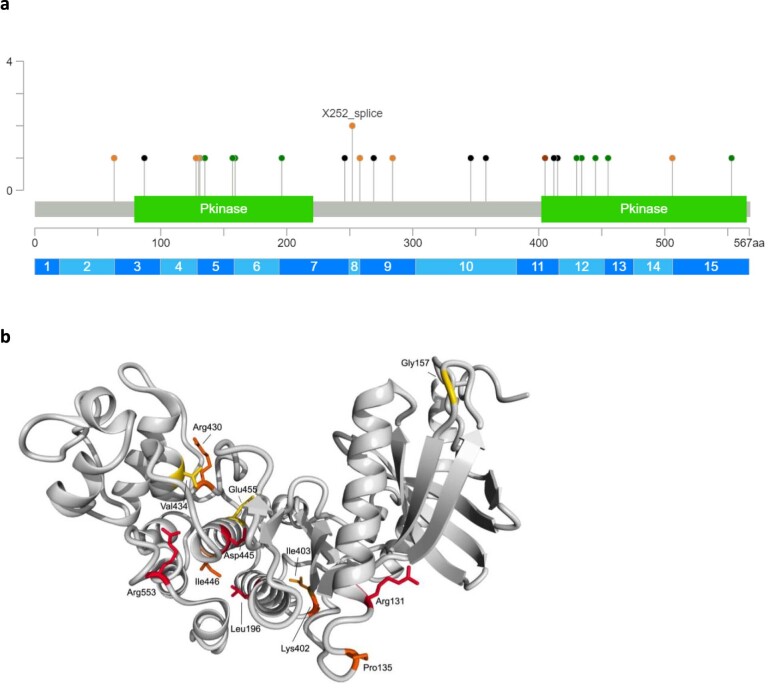
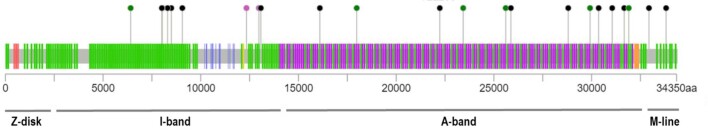
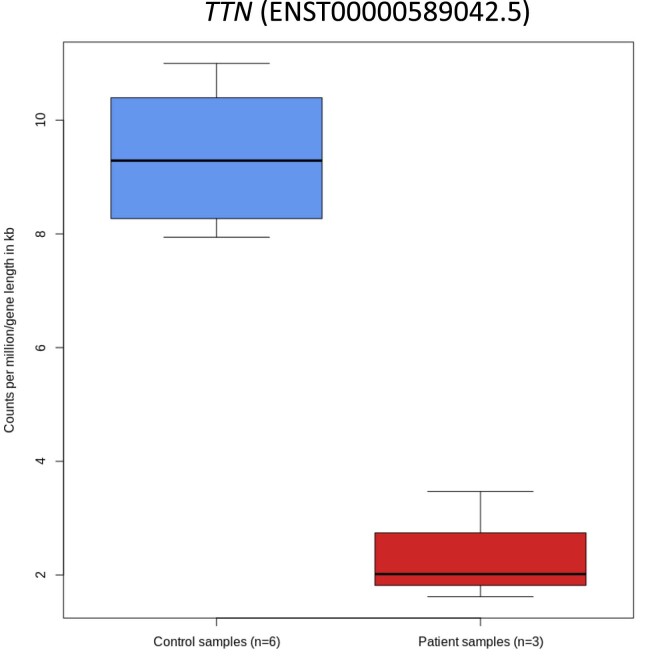
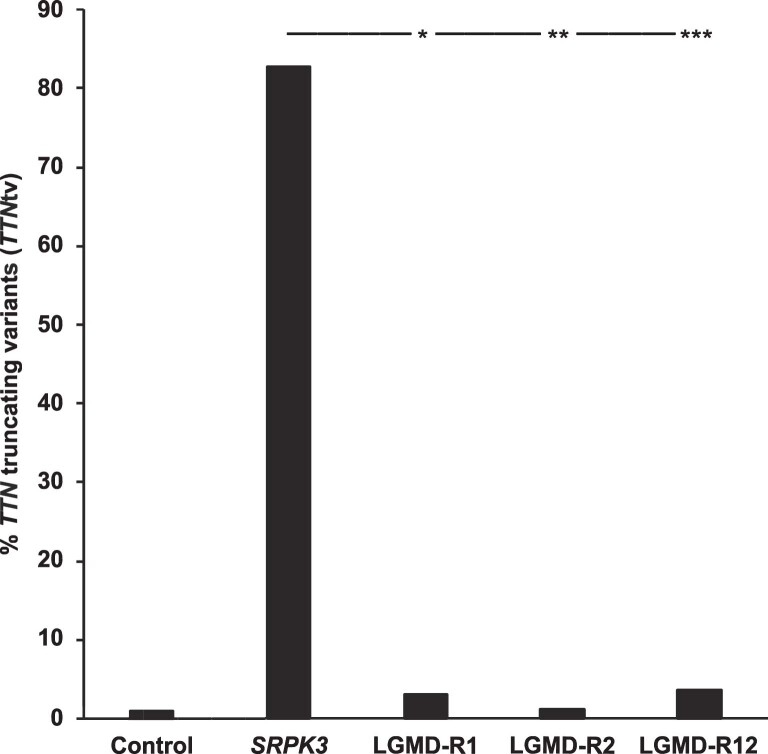
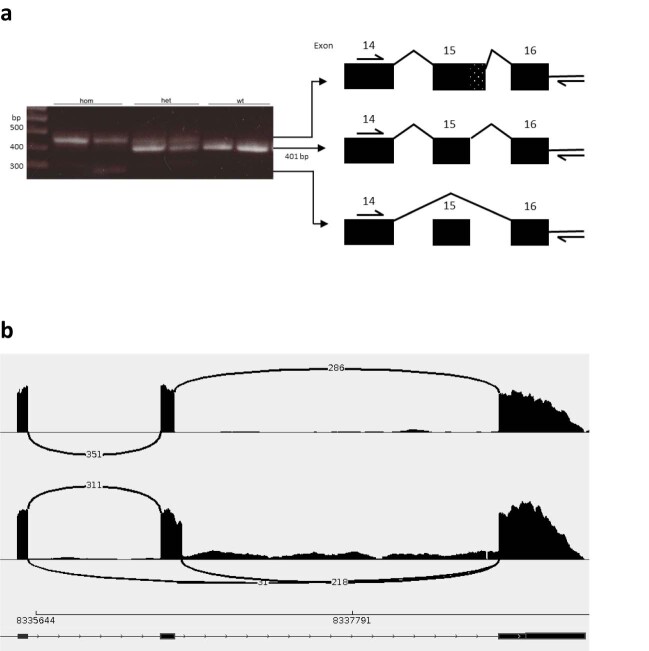
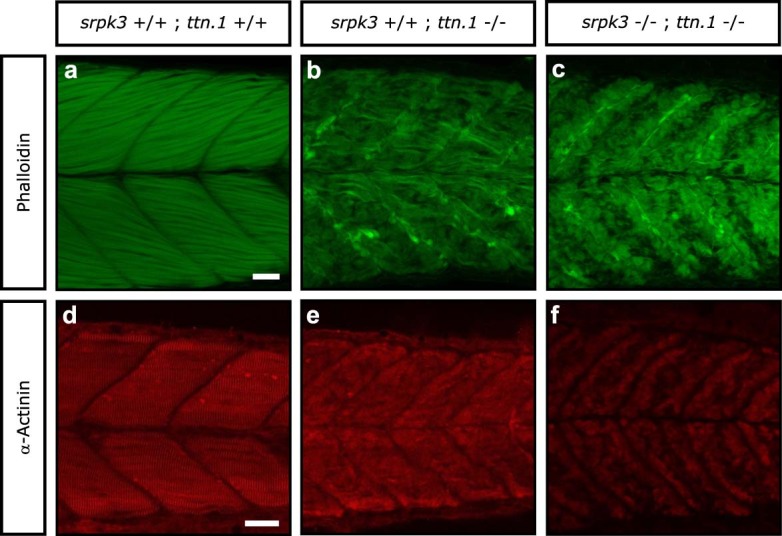
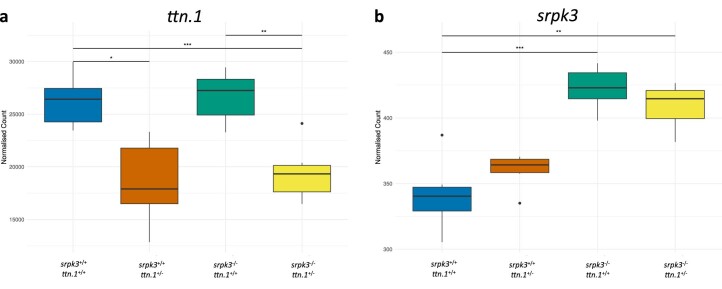
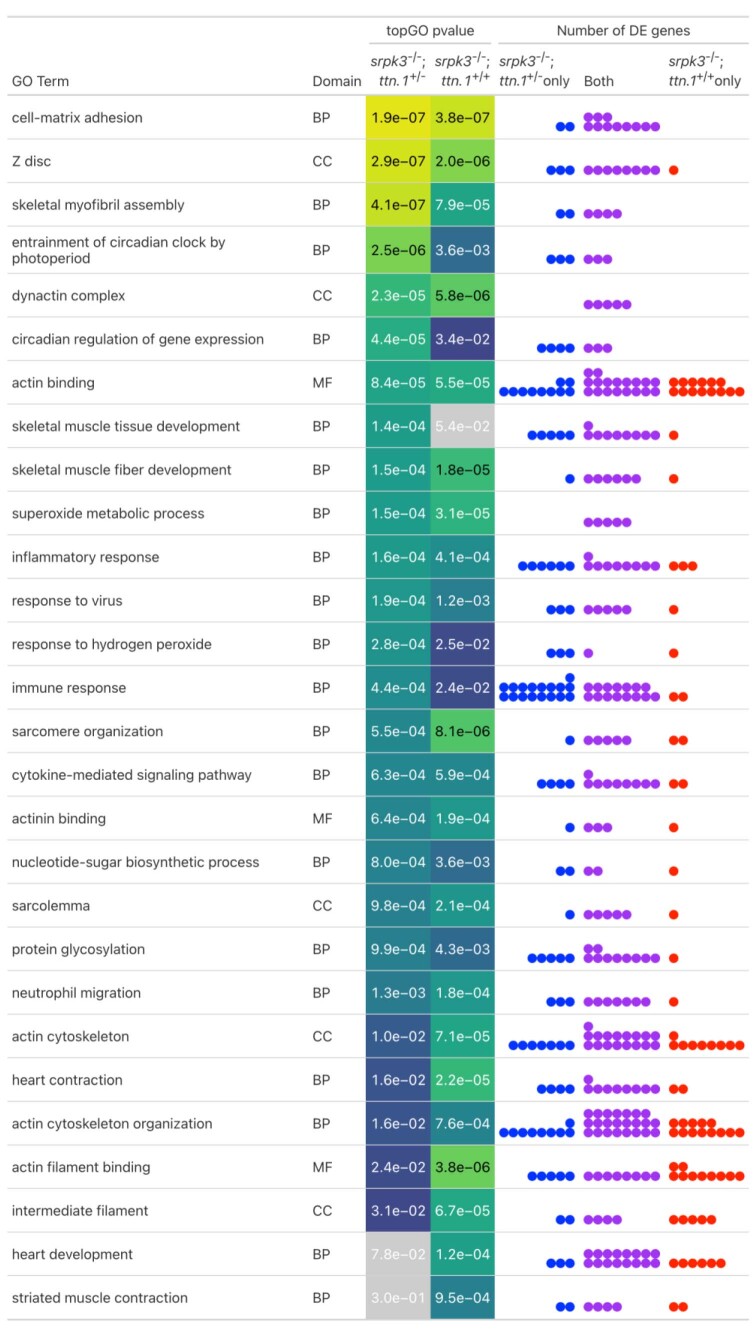
In digenic inheritance, pathogenic variants in two genes must be inherited together to cause disease. Only very few examples of digenic inheritance have been described in the neuromuscular disease field. Here we show that predicted deleterious variants in SRPK3, encoding the X-linked serine/argenine protein kinase 3, lead to a progressive early onset skeletal muscle myopathy only when in combination with heterozygous variants in the TTN gene. The co-occurrence of predicted deleterious SRPK3/TTN variants was not seen among 76,702 healthy male individuals, and statistical modeling strongly supported digenic inheritance as the best-fitting model. Furthermore, double-mutant zebrafish (srpk3-/-; ttn.1+/-) replicated the myopathic phenotype and showed myofibrillar disorganization. Transcriptome data suggest that the interaction of srpk3 and ttn.1 in zebrafish occurs at a post-transcriptional level. We propose that digenic inheritance of deleterious changes impacting both the protein kinase SRPK3 and the giant muscle protein titin causes a skeletal myopathy and might serve as a model for other genetic diseases.


Conflict of interest statement

The authors declare no competing interests.

Figures

Fig. 1
Fig. 1. Pedigrees of the SRPK3/TTN myopathy families.
a, Segregation of the familial SRPK3 variants is shown. S indicates the SRPK3 variant and WT indicates the wild-type allele. Individuals presenting with skeletal muscle disease are indicated in black. Mild presentations are shown in gray (corresponding to YIII:4 and YIII:5, two female carriers with skewed X-inactivation, 80:20 and 65:35, in lymphocytes, respectively). b, Extended pedigree details of families M and Z. Individuals presenting with skeletal muscle disease are indicated in black. Cardiac involvement is indicated by gray/dotted symbols. Segregation of the familial SRPK3 (S) and TTN (T) variants is shown. S + T indicates cosegregating SRPK3/TTN variants; WT indicates both SRPK3 and TTN WT alleles. Individuals ZIV:1, ZIV:4, ZIV:6 and ZIV:7 carry the familial TTN variant (p.Arg16905*) previously reported in association with DCM (ref. ) but are presymptomatic at ages 52, 44, 40 and 38 years old, respectively. Likewise, individual MIII:2 carries the familial TTN variant (p.Asp28805Metfs*6) but is also presymptomatic at age 46 years old. c, Cosegregation of the SRPK3 and TTN variants (S + T) with the myopathic phenotype (shown in black). All known genotypes are shown; WT, both SRPK3 and TTN WT alleles; empty symbols indicate that the sample was not available for testing (or failed testing). All affected individuals carry the SRPK3 and TTN variants (S + T), whereas their unaffected relatives carry one or the other, but never both. Two females carrying cosegregating SRPK3/TTN variants and showing a skewed X-inactivation pattern are mildly affected (YIII:4 and YIII:5), and those with random X-inactivation are unaffected (TI:2, UI:2, XII:2 and YII:2). A female carrying only the SRPK3 variant (but no TTN variant; ZII:5) and a complete X-inactivation pattern (3:97, in lymphocytes) is unaffected. Individual RI:2, with cosegregating SRPK3 and TTN variants whose fully inactivated chr X carries the SRPK3 deleterious variant, is also unaffected. Individuals RII:3 and SI:2 are noninformative for the CAG repeat analyzed in the X-inactivation assay.
Fig. 2
Fig. 2. Muscle pathology of the patients with SRPK3/TTN myopathy.
ah, Examples of muscle histopathology (n = 23). a, Myopathic changes with increased internalized nuclei and fiber size variability (22/23) shown by hematoxylin and eosin (H&E) staining, as seen in patient XIII:1. b,c, Minicores and core-like structures (15/23) shown by NADH histochemistry, as seen in patients BII:1 and WIII:3. d,e, Type I fiber predominance and type I uniformity (19/23) shown by ATPase pH 4.6 and pH 9.2 staining, as seen in patients CII:2 and BII:1, respectively. f, More severe end of the disease spectrum, with vacuoles, necrosis, regeneration and fibrosis shown by H&E in patient YII:3. g,h, EM images confirmed the presence of core structures and revealed Z-line misalignment, accumulation of Z-band material and branching of myofibrils, as seen in patients XIII:1 and WIII:3. Representative images have been obtained as part of the diagnostic workup in accredited pathology laboratories. i, Lower limb MRI T1-weighted images from four patients with SRPK3/TTN myopathy (VII:1, YII:3, MIII:3 and ZIV:1). A pattern of fatty replacement involving the subscapularis muscle in the shoulder girdle was observed. In the pelvic girdle, the gluteus maximus was affected (arrows), but the gluteus minimus and medius muscles were spared even in the advanced stages of the disease. In the thigh, there was a predominant involvement of the hamstring muscles, while the sartorius and gracilis muscles were not involved in the advanced stages of the disease, with the adductor magnus muscle (arrowheads) almost completely spared. In the lower legs, there was predominant involvement of the medial gastrocnemius muscle (arrows) associated with the involvement of the soleus muscle. The peroneus and tibialis anterior muscles were also involved, but only in advanced stages.
Fig. 3
Fig. 3. Titin immunoanalysis of patients with SRPK3/TTN myopathy.
Muscle biopsy lysates of individuals DI:1, DII:1, LII:1, XII:3, XIII:1 and YII:3 were analyzed using different anti-titin antibodies. a, SRPK3/TTN patients LII:1, YII:3, DII:1, XII:3 and XIII:1 showed a normal pattern of C-terminal titin proteolytic fragments (13, 15 and 18 kDa in size), ruling out a C-terminal titinopathy. b,c, Antibodies against the N-terminal titin (Z1Z2 TTN-1, b) and distal I-band of titin (F146.9B9, c) showed that the full-length titin band is missing or highly reduced in the patients with SRPK3/TTN myopathy (XIII:1, XII:3 and YII:3), but it is present in an unaffected relative TTNtv carrier (DI:1, father of DII:1) and a disease control also carrying a heterozygous TTNtv. This could be attributed to changes in N-terminal protein sequence or structure, or otherwise, protein modifications preventing antibody recognition. d, Coomassie staining also showed the absence or reduction of the high molecular weight band representing the full-length titin protein, whereas the NEB and MyHC bands were normal. Western blots were repeated twice, from the same muscle lysates. Full-length blots are provided as source data. MW, molecular weight; MyHC, myosin heavy chain; NEB, nebulin. Source data
Fig. 4
Fig. 4. ttn.1 heterozygosity induces a severe phenotype in homozygous srpk3-null mutant zebrafish larvae.
ah, Lateral view of Alexa Fluor phalloidin filamentous actin (green) and α-actinin Z-band marker (red) staining in skeletal fast muscle fibers in WT (a,e), srpk3+/; ttn.1+/ (b,f), srpk3/; ttn.1+/+ (c,g) and srpk3/; ttn.1+/ larvae (d,h) at 5 dpf. Compared to WT (a,e) or double heterozygotes (srpk3+/; ttn.1+/; b,f), homozygous srpk3-null alone only causes very mild muscle fiber defects (c,g), while ttn.1 heterozygosity in homozygous srpk3/ larvae severely affects muscle fiber integrity (d,h). it, Isolated myofiber immunostaining and electron microscopy (EM) in skeletal fast muscle fibers in WT (i,m,q), srpk3+/+; ttn.1+/ (j,n,r), srpk3/; ttn.1+/+ (k,o,s) and srpk3/; ttn.1+/ (l,p,t) larvae at 5 dpf. Isolated myofiber immunostaining showed that titin expression is largely reduced in the double mutant (srpk3−/−; ttn.1+/−; l,p) but not in the single heterozygous ttn.1 mutant (srpk3+/+; ttn.1+/−; j,n) or the srpk3-null (srpk3−/−; ttn.1+/+; k,o). EM showed that srpk3-null zebrafish (srpk3−/−; ttn.1+/+; s) had well-defined sarcomeres, with mildly disorganized myofibrils. The double-mutant fish (srpk3−/−; ttn.1+/−; t) displayed pronounced disruption of the sarcomere structure. White scale bars are 25 µm. Black scale bar is 500 nm. Representative images from >15 pooled fish per genotype.
Fig. 5
Fig. 5. Transcriptome analysis of mutant zebrafish larvae.
a, Number of DE genes between WT and double mutant (top: srpk3/; ttn.1+/; n = 794), srpk3-null (middle: srpk3/; ttn.1+/+; n = 572) and heterozygous ttn.1 (bottom: srpk3+/+; ttn.1+/; n = 128) zebrafish. Upregulated genes are in blue and downregulated genes are in red. b, GO term enrichment analysis. GO term enrichment was done using the topGO package using a one-sided Fisher’s exact test without adjustment for multiple testing. The top enriched GO terms (P < 0.001) for the three comparisons in a ordered by −log10(P). The bars are colored according to the GO domain. Blue indicates BP; orange indicates CC; green indicates MF. c, ClueGO network diagram showing the overlap in enriched GO terms between double mutant (srpk3/; ttn.1+/) and srpk3-null (srpk3/; ttn.1+/+). Nodes represent individual enriched GO terms; edges connect nodes that share annotated genes from the DE genes. Nodes are colored according to the contribution to the enrichment from DE genes from each comparison. Blue indicates >60% DE genes from the srpk3/; ttn.1+/ comparison; red indicates >60% DE genes from srpk3/; ttn.1+/+; purple indicates 40–60% from each comparison. BP, biological process; CC, cellular component; MF, molecular function.
Fig. 6
Fig. 6. SRPK3 phosphorylates RBM20 in vitro.
a, The RBM20517–664-V5 reporter was transfected into 293T cells with or without GFP-SRPK3. GFP-SRPK3/RBM20517–664-V5 co-expression resulted in RBM20517–664-V5 hyperphosphorylation (lanes 4 and 5), as indicated by a mobility shift that was abolished by incubation with lambda phosphatase (P, lane 6). U indicates untreated samples; N indicates control samples incubated without phosphatase. In the absence of the SRPK3 construct, a less pronounced but still noticeable mobility shift can be observed (lanes 1 and 2), consistent with RBM20 phosphorylation by endogenous kinases such as SRPK1, CLK1 or AKT2. Assay was performed in quadruplicate. b, mRNA counts of the zebrafish RBM20 ortholog (BX649294.1 ENSDARG00000092881) are increased in srpk3-null zebrafish (srpk3/; ttn.1+/+ and srpk3/; ttn.1+/), likely as a feedback loop due to the srpk3 deficiency. The box blots represent the first and third quartiles (25% and 75% percentile) with the center line at the median value. The whiskers extend from the hinge to the furthest value not beyond 1.5 times the interquartile range from the hinge. Differential expression was done using a two-sided Wald test with Benjamini–Hochberg adjustment for multiple testing. For srpk3/; ttn.1+/+ versus srpk3+/+; ttn.1+/+, *P = 0.0379. n = 6 for each condition. Full-length blots are provided as source data. Source data
Extended Data Fig. 1
Extended Data Fig. 1. RNA analysis of SRPK3 truncating variants.
a, RT-PCR of muscle-derived cDNA from patient CII:2 carrying a donor splice site variant (c.1144+1G>A). PCR amplification with Ex4F/Ex11R primers showed that the variant leads to the exclusion of exon 10 and results in a frameshift change (p.Asp284_Thr383delinsAla). b, RT-PCR of muscle-derived cDNA from patient SII:1 carrying an extended splice site variant (c.774+5G>C); top: using primers in exons flanking the variant (Ex6F 5′-CGTGAAGAGCATCGTGAGG and Ex10R 5′- GCCCCCGTCTAGTCTCAAG) a single band was detected in the patient (P), corresponding to abnormal exon 8 skipping (r.749_774del, p.Val250Alafs*4); bottom: using the same forward primer in exon 6 and a reverse primer in intron 8 (In8R 5′- GACGGCCCGGTACTGCCGAGTCTG), two and three bands were detected in the proband and control samples, respectively. The larger bands correspond to gDNA; the band at 373 bp corresponds to abnormal retention of both intron 7 and intron 8 in the proband (r.748_749ins[748+1_749-1]; r.774_775ins[g>c;774+1_775-1], p.Val250Glyfs*46). The lower band corresponds to a natural missplicing event leading to retention of intron 8 observed both in the patient and controls (r.774_775ins[g>c;774+1_775-1], p.Val250Glyfs*46). c, Sashimi plot for RNA sequencing data from muscle tissue from patient LII:1 carrying a donor splice variant (c.190+2T>C). The plot shows skipping of exon 2, leading to an out-of-frame mRNA. Any SPRK3 transcripts escaping nonsense-mediated decay will encode a truncated protein lacking the kinase domain. RT-PCR amplification was performed at least in duplicate. Source data
Extended Data Fig. 2
Extended Data Fig. 2. SRPK3 mRNA expression levels in patients with SRPK3 truncating variants.
RNA sequencing data from patients carrying SRPK3 truncating variants (LII:1, DII:1 and YII:3) were analyzed for SRPK3 expression between patient (n = 3) and control (n = 6) samples. Counts per million (CPM) values were normalized by gene length. The boxes represent the first and third quartiles (25% and 75% percentile) with the center line at the median value. The whiskers extend from the hinge to the furthest value not beyond 1.5 times the interquartile range from the hinge. Differential expression was performed in edgeR using a two-sided exact test, with no adjustment for multiple comparisons. Uncorrected P-value = 7.106 × 10⁻¹¹.
Extended Data Fig. 3
Extended Data Fig. 3. Localization and 3D modeling of SRPK3 variants.
a, Localization of SRPK3 variants. Kinase domains are indicated in green. Missense changes are shown in green, truncating variants (nonsense, splice sites and frameshift) in black and the in-frame variant in red. Two splice site variants were identified at position c.749-2 (shown as X252_splice). b, For the structure-based analysis of SRPK3 variants, a homology model was built using YASARA (v15.4.10) with a SRPK1 structural template (5MYV, chain C). Amino acid position for changes p.Arg131Pro, p.Pro135His, p.Gly157Arg, p.Leu196Pro, p.Arg430Gln, p.Val434Glu, p.Asp445Asn, p.Glu455Lys, p.Arg553Trp and the p.Lys405_Ile406del are indicated. p.Arg131Pro + p.Pro135His: Pro135 is located in a loop where it bends the loop in a way to allow for stabilizing interactions, where a change to His will lead to disruption of local loop orientation. Arg131 is located at the C-terminal of the alpha-helix, close to Pro135. In an additive fashion, the introduction of Arg131Pro will probably destabilize local structure even further. p.Gly157Arg: will force changes in backbone orientation for residues in the loop and surrounding sheet structures, leading to local stability issues by forcing surrounding residues to adopt orientations that impair favorable interactions. p.Leu196Pro: will lead to a disruption of the helical structure and decrease protein stability. p.Arg430Gln: Arg430 plays a stabilizing role by interacting with the negatively charged residues Asp474 and Asp423. Loss of this positive charge will lead to destabilizing effects. p.Val434Glu: introduces a negatively charged residue that will likely disrupt the wild-type charged interaction network of Arg430, Asp474 and Asp423. p.Asp445Asn: loss of negative charge, loss of hydrogen bond with backbone Thr211, leading to a destabilizing effect. p.Glu455Lys: change of a highly conserved negative charge into positive charge. Forms a hydrogen bond with Tyr429, which is lost when mutated to Lys. Probably destabilizing, although the role of the negative charge is not clear. p.Arg553Trp: Arg533 forms a salt bridge with Glu433, stabilizing local structure. Losing that salt bridge will destabilize. Additionally, exchanging a large, positively charged residue for a bulky very hydrophobic residue will lead to additional destabilization. p.Lys405_Ile406del (also annotated as p.Lys402Ile403del): results in a deletion of two residues (Lys-Ile) in a short repeat sequence (Lys-Ile-Lys-Ile-Lys-Ile). Protein structure modeling suggests that the deleted residues are Lys402 and Ile403. The modeled structure shows Asp401 reoriented into a position originally occupied by Ile403. This will destabilize local structure. Additionally, it results in the loss of the salt bridge between Asp401 and Arg193, which also contributes to a destabilizing effect.
Extended Data Fig. 4
Extended Data Fig. 4. Distribution of TTN variants identified in the SRPK3/TTN cohort.
TTN truncating variants (nonsense, splice sites and frameshift) are shown in black and missense variants in green. No missense variants in TTN exons 344 or 364, associated with HMERF and tibial muscular dystrophy, respectively, were found. TTN variants were located mainly in the A-band and I-band; however, no clustering was observed. Two frameshift variants occurred in meta transcript only exons (in pink).
Extended Data Fig. 5
Extended Data Fig. 5. TTN mRNA expression levels in SRPK3/TTN patients.
RNA sequencing data from SRPK3/TTN myopathy patients (LII:1, DII:1 and YII:3) were analyzed for TTN expression between patient (n = 3) and control (n = 6) samples. Counts per million (CPM) values were normalized by gene length. The boxes represent the first and third quartiles (25% and 75% percentile) with the center line at the median value. The whiskers extend from the hinge to the furthest value not beyond 1.5 times the interquartile range from the hinge. Differential expression was performed in edgeR using a two-sided exact test, with no adjustment for multiple comparisons. Uncorrected P-value = 0.0008015. This was likely not due to nonsense-mediated mRNA decay, as there was no evidence of allele-specific expression at any of the heterozygous TTN loci examined.
Extended Data Fig. 6
Extended Data Fig. 6. TTNtv in other muscle disease populations.
Comparison between the number of TTNtv (stop gain, splice sites and frameshift variants) in the SRPK3/TTN myopathy families (n = 25) and three cohorts of patients with genetically confirmed forms of limb girdle muscular dystrophy: LGMD-R1 (n = 170), LGMD-R2 (n = 94) and LGMD-R12 (n = 56). A Fisher’s test (two-sided, with no adjustment for multiple comparisons), following the proposal of Agresti and Coull to add two successes and two failures to each data set was calculated. P-values: (*) = 6.13 × 10⁻¹⁹, (**) = 9.18 × 10⁻¹⁷ and (***) = 4.89 × 10⁻¹².
Extended Data Fig. 7
Extended Data Fig. 7. Effect of the zebrafish srpk3 sa18907 mutation on mRNA.
a, The mutation lies between exon 15 and 16 in the zebrafish genomic sequence. RT-PCR of muscle-derived cDNA from zebrafish (wild-type, heterozygous and homozygous for the sa18907 mutation) showed three different sized products (primers: Fwd 5′- CTGCTGACATATGGAGCACTG and Rev 5′-GGATACTAAATGTCCCGTAGGTTG). Wild-type samples showed the expected 401-bp product (middle band). The mutation results in aberrant splicing of srpk3 with partial retention of intron 15 (top band) seen both in the homozygous and heterozygous state, or loss of exon 15 (lower band) only seen in the homozygous mutants. Representative of two experiments. b, Sashimi plot for RNA sequencing data from srpk3 mutant and wild-type zebrafish, also showing skipping of exon 15, as well as several forms of partial retention of intron 15. Source data
Extended Data Fig. 8
Extended Data Fig. 8. ttn.1-null zebrafish shows a severe skeletal muscle phenotype.
af, Lateral view of Alexa Fluor phalloidin filamentous actin (green) and α-actinin Z-band marker (red) staining in skeletal fast muscle fibers in wild-type (a,d), srpk3+/+;ttn.1/ (b,e) and srpk3/;ttn.1/ (c,f) larvae at 5 dpf. Compared to wild-type fish (a,d), the muscle fiber structure was largely lost in the ttn.1-null zebrafish, regardless of the srpk3 status (that is both srpk3+/+;ttn.1/ and srpk3/;ttn.1/). Scale bars are 25 µm. Representative images from >15 pooled fish per genotype.
Extended Data Fig. 9
Extended Data Fig. 9. mRNA expression in the srpk3 and ttn zebrafish models.
a, Transcriptome data showed that ttn.1 mRNA (ENSDARG00000000563) expression is equally reduced in the heterozygous (srpk3+/+; ttn.1+/) and the double mutants (srpk3/; ttn.1+/) when compared to the wild-type ttn.1. P-values: (*) sprk3+/+; ttn.1+/− vs. srpk3+/+; ttn.1+/+ = 0.024, (**) sprk3−/−; ttn.1+/− vs. srpk3−/−; ttn.1+/+ = 0.004, (***) sprk3−/−; ttn.1+/− vs. srpk3+/+; ttn.1+/+ = 3.221 × 10⁻⁴. b, srpk3 mRNA (ENSDARG00000005916) was upregulated in the srpk3/ zebrafish mutants (both srpk3/; ttn.1+/+ and srpk3/; ttn.1+/), likely as a compensatory effect. P-values: (**) sprk3−/−; ttn.1+/− vs. srpk3+/+; ttn.1+/+ = 0.005, (***) sprk3−/−; ttn.1+/+ vs. srpk3+/+; ttn.1+/+ = 5.178 × 10−4. The boxes represent the first and third quartiles (25% and 75% percentile) with the center line at the median value. The whiskers extend from the hinge to the furthest value not beyond 1.5 times the interquartile range from the hinge. Any outlier values beyond 1.5 times the interquartile range are plotted as individual points. Differential expression was done using a two-sided Wald test with Benjamini-Hochberg adjustment for multiple testing. n = 6 for each condition.
Extended Data Fig. 10
Extended Data Fig. 10. Overlap of differentially expressed (DE) genes annotated to enriched Gene Ontology (GO) terms.
The table shows the top enriched GO terms from the comparisons of srpk3−/−; ttn.1+/− and srpk3−/−; ttn.1+/+ embryos to wild-type (P < 0.001 in one of the comparisons). The topGO P-value columns show the P-value from the enrichment test for each comparison. The dots in the number of DE genes columns represent the number of DE genes annotated to the term that appear either in srpk3−/−; ttn.1+/− alone (blue), srpk3−/−; ttn.1+/+ alone (red) or in both (purple). For most GO terms, most of the DE genes causing the enrichment are shared between both lists. GO term enrichment was done using the topGO package using a one-sided Fisher’s exact test without adjustment for multiple testing.

References

    1. Waldrop MA, et al. Diagnostic utility of whole exome sequencing in the neuromuscular clinic. Neuropediatrics. 2019;50:96–102. doi: 10.1055/s-0039-1677734. - DOI - PubMed
    1. Deltas C. Digenic inheritance and genetic modifiers. Clin. Genet. 2018;93:429–438. doi: 10.1111/cge.13150. - DOI - PubMed
    1. Van der Ven PF, Bartsch JW, Gautel M, Jockusch H, Fürst DO. A functional knock-out of titin results in defective myofibril assembly. J. Cell Sci. 2000;113:1405–1414. doi: 10.1242/jcs.113.8.1405. - DOI - PubMed
    1. Roberts AM, et al. Integrated allelic, transcriptional, and phenomic dissection of the cardiac effects of titin truncations in health and disease. Sci. Transl. Med. 2015;7:270ra6. doi: 10.1126/scitranslmed.3010134. - DOI - PMC - PubMed
    1. Savarese M, et al. The complexity of titin splicing pattern in human adult skeletal muscles. Skelet. Muscle. 2018;8:11. doi: 10.1186/s13395-018-0156-z. - DOI - PMC - PubMed

LinkOut - more resources