Meta-Analysis
. 2024 Mar;30(3):797-809.
doi: 10.1038/s41591-024-02823-z. Epub 2024 Mar 1.

A gut microbial signature for combination immune checkpoint blockade across cancer types

Affiliations
Meta-Analysis

A gut microbial signature for combination immune checkpoint blockade across cancer types

Ashray Gunjur et al. Nat Med. 2024 Mar.

Abstract

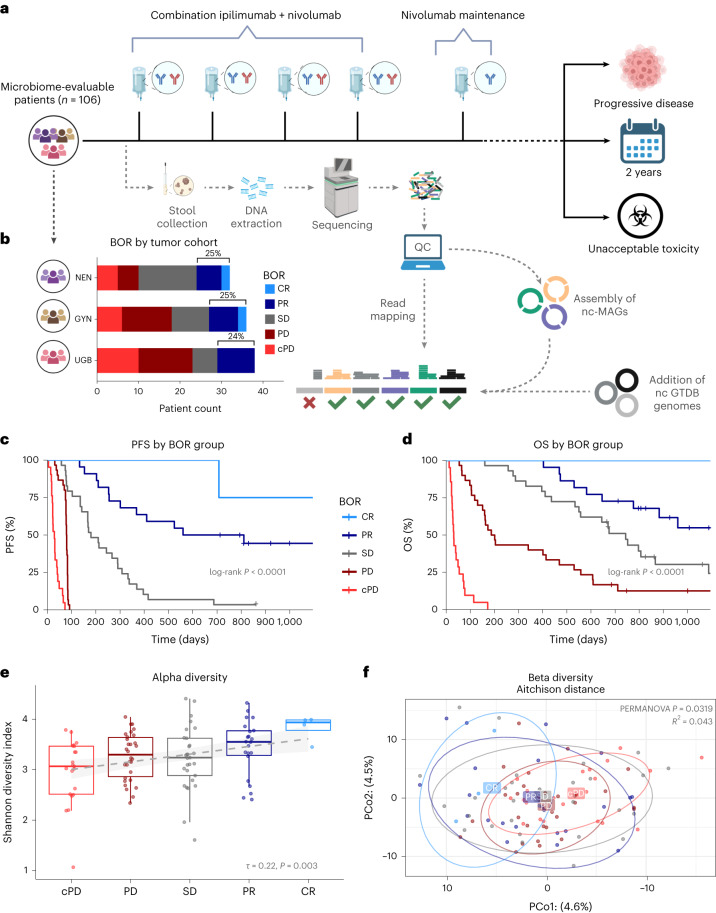
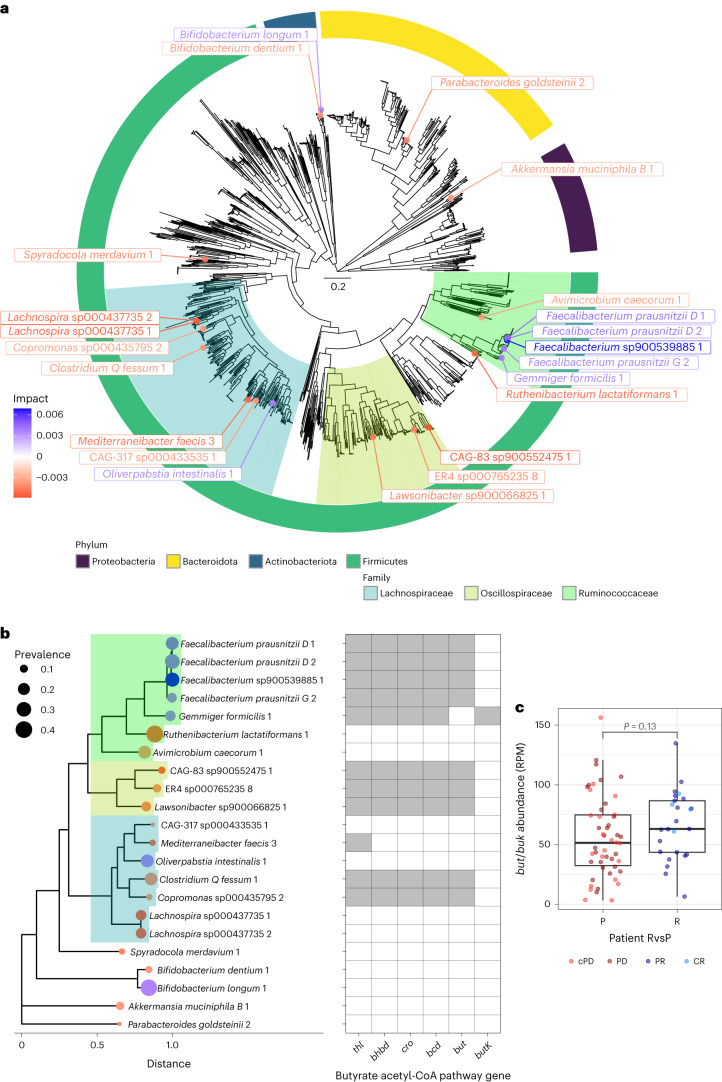
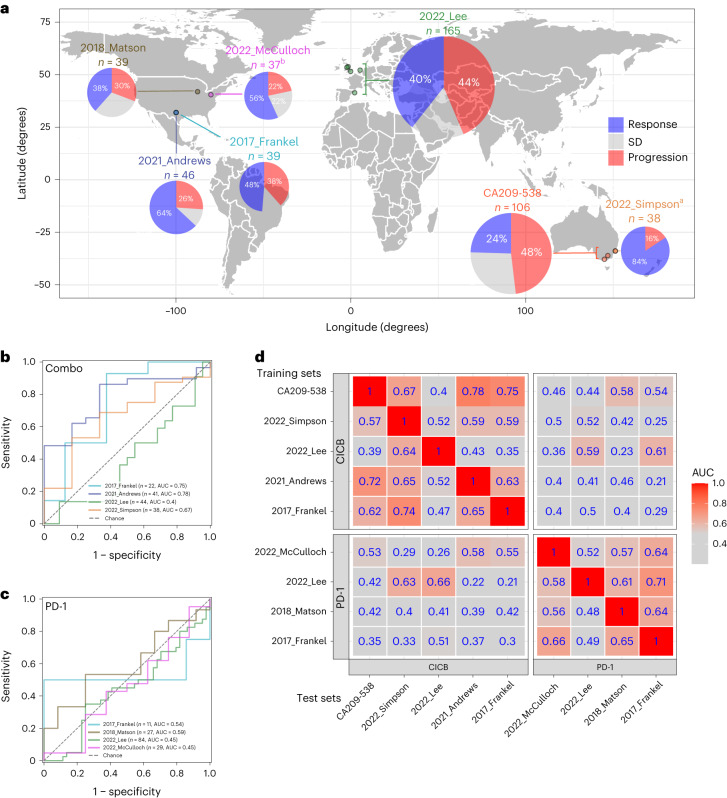
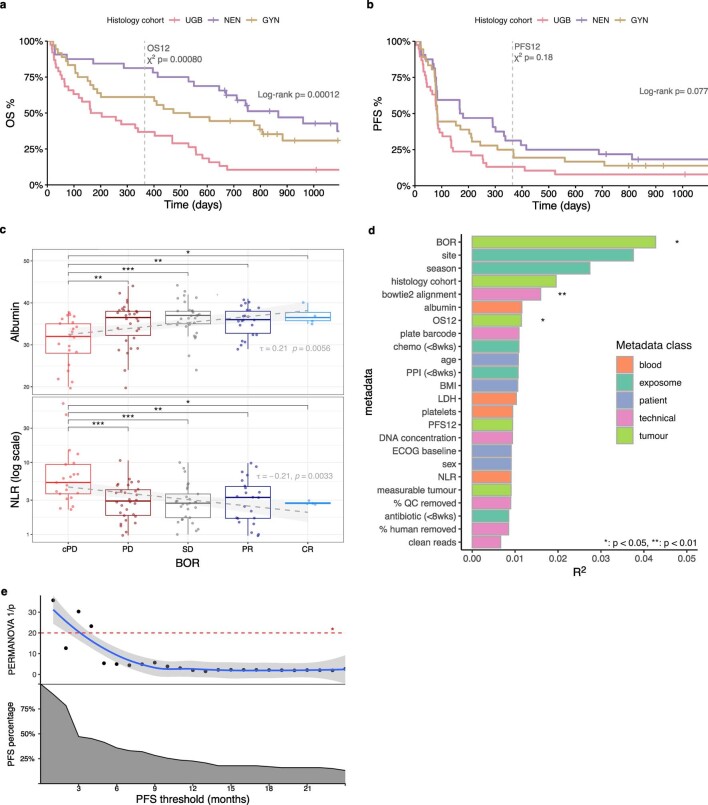
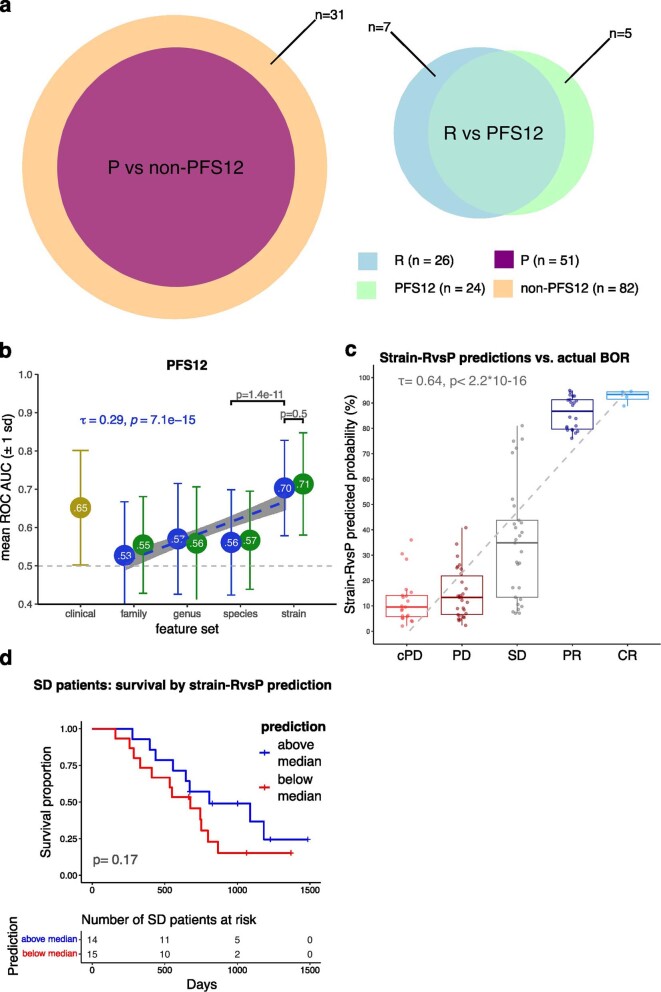
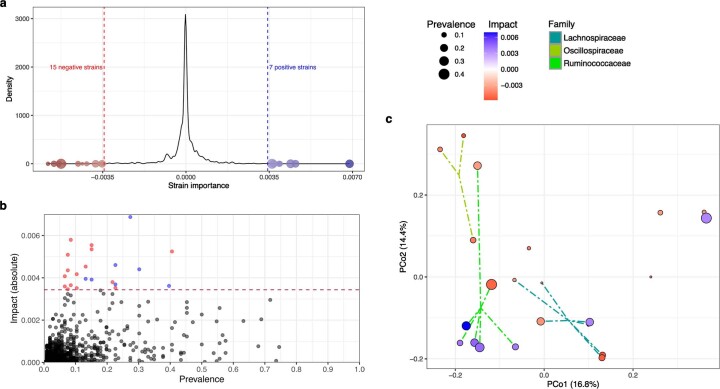
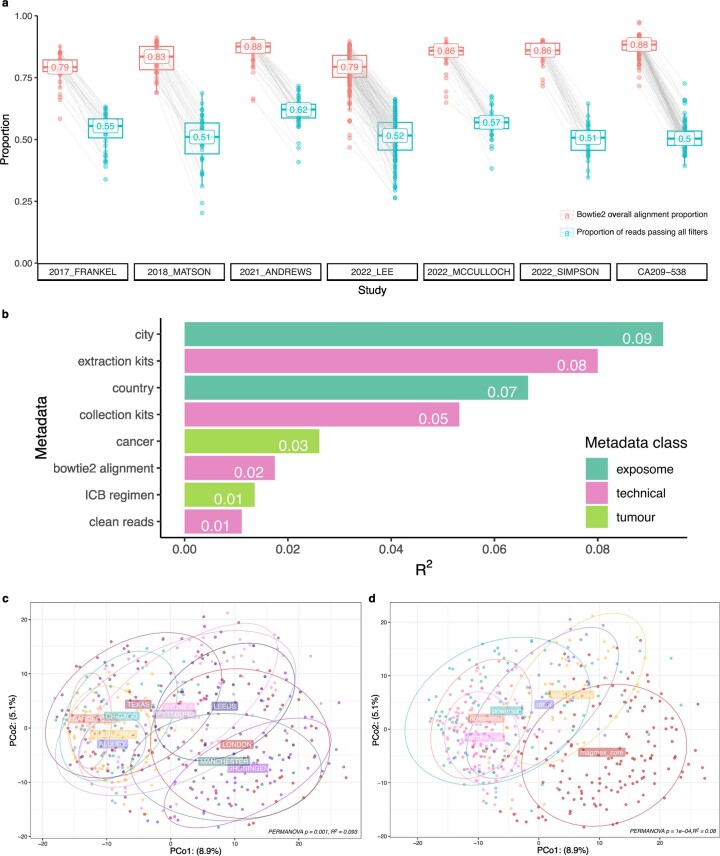
Immune checkpoint blockade (ICB) targeting programmed cell death protein 1 (PD-1) and cytotoxic T lymphocyte protein 4 (CTLA-4) can induce remarkable, yet unpredictable, responses across a variety of cancers. Studies suggest that there is a relationship between a cancer patient's gut microbiota composition and clinical response to ICB; however, defining microbiome-based biomarkers that generalize across cohorts has been challenging. This may relate to previous efforts quantifying microbiota to species (or higher taxonomic rank) abundances, whereas microbial functions are often strain specific. Here, we performed deep shotgun metagenomic sequencing of baseline fecal samples from a unique, richly annotated phase 2 trial cohort of patients with diverse rare cancers treated with combination ICB (n = 106 discovery cohort). We demonstrate that strain-resolved microbial abundances improve machine learning predictions of ICB response and 12-month progression-free survival relative to models built using species-rank quantifications or comprehensive pretreatment clinical factors. Through a meta-analysis of gut metagenomes from a further six comparable studies (n = 364 validation cohort), we found cross-cancer (and cross-country) validity of strain-response signatures, but only when the training and test cohorts used concordant ICB regimens (anti-PD-1 monotherapy or combination anti-PD-1 plus anti-CTLA-4). This suggests that future development of gut microbiome diagnostics or therapeutics should be tailored according to ICB treatment regimen rather than according to cancer type.


Conflict of interest statement

A.G. has received a speaker honorarium from Microbiotica Limited. B.M. has served on advisory boards for Amgen, Bristol Myers Squibb (BMS), Merck, Beigene and AstraZeneca (AZ). M.S.C. has served on advisory boards or as a consultant for Amgen, BMS, Eisai, Ideaya, Merck, Sharp & Dohme (MSD), Nektar, Novartis, Oncosec, Pierre-Fabre, Qbiotics, Regeneron, Roche, Merck, Moderna and Sanofi and received honoraria from BMS, MSD and Novartis. D.K. has served on advisory boards for BMS, MSD and Novartis. C.U. has served in a consulting/advisory role for Merck Serano and AZ and a speakers’ bureau role for IQvia and AZ. His institution has received research funding from Akeso Biopharma, Arcus Biosciences, Atridia, BeyondSpring Pharmaceuticals, Boehringer Ingelheim, Deciphera and Novotech. S.F. has received financial support from Amgen, MSD and AZ; honoraria for advisory boards from Akesobio, Ambrax and MSD; and institutional sponsorship/trials and research activities from Akesobio, Ambrax, Amgen, Axelia, AZ, Aulos, BeiGene, Cullinan, Daiichi Sankyo, Edison Oncology, Genentech, MSD, Takeda, HaiHe Biopharma, Vivace and WellMarker Bio. D.J.A. is a paid consultant for Ono Therapeutics and Microbiotica Limited and receives research support from AZ, OpenTargets and BMS. T.D.L. is cofounder and chief scientific officer at Microbiotica Limited. All other authors declare no competing interests.

Figures

Fig. 1
Fig. 1. Clinical and gut microbiome compositional differences between responders and nonresponders.
a, CA209-538 study and microbiome analysis schema (created using BioRender.com). Pretreatment fecal samples were collected from n = 106 trial participants and subjected to DNA extraction, shotgun metagenomic sequencing, and analysis using a genome-resolved metagenomics pipeline, involving quality control (QC), de novo assembly of near-complete MAGs (nc-MAGs) and precise read mapping. Further to the standard filters, reads mapping to genomes with <50% coverage breadth were removed. b, Bar plot of patient RECIST 1.1 BOR by histology cohort for microbiome-evaluable patients. The percentages of patients with an objective response (PR or CR) are indicated. c, Kaplan–Meier curve of PFS stratified by BOR category (cPD n = 21, PD n = 30, SD n = 29, PR n = 22, CR n = 4). Log-rank test P = 2.1 × 10−42. d, Kaplan–Meier curve of OS stratified by BOR category (cPD n = 21, PD n = 30, SD n = 29, PR n = 22, CR n = 4). Log-rank test P = 1.2 × 10−34. e, Boxplots of microbiome alpha diversity, as measured by the Shannon diversity index, across BOR categories (cPD n = 21, PD n = 30, SD n = 29, PR n = 22, CR n = 4). Boxplot center line indicates the median; box limits indicate the upper and lower quartiles; and whiskers indicate 1.5× the interquartile range. The linear model (line of best fit) for the Shannon diversity index and BOR (with shaded 95% confidence interval) is superimposed (in gray). Kendall τ and P values for the association between the Shannon diversity index and BOR are indicated. f, Principal coordinate 1 (PCo1) versus 2 (PCo2) using the Aitchison distance of strain abundances, colored by patient BOR category. Ellipses depict 0.8 of each group’s multivariate t distribution. PERMANOVA P value and R2 using 9,999 permutations are indicated.
Fig. 2
Fig. 2. Strain-resolution gut microbial signatures outperform clinical predictors and cross-validate across tumor histology types.
a, Schematic of the supervised ML framework. Input features (clinical, microbiome or combined) and the target variables (RvsP or PFS12) were split into five folds (four training folds, one testing fold). The process was repeated 20 times per iteration, with the AUC score used to select the best hyperparameters. CV, cross-validation. b, AUC scores for the best iteration of RvsP classifiers for each feature set combination during 20 times repeated fivefold cross-validation (100 folds each): clinical (yellow), microbiome (blue) and combined (green), at different taxonomic resolutions. Data represent the mean (circle) and s.d. (error bars) over the 100 folds. The linear model (line of best fit) for the AUC score and taxonomic rank of microbiome-only feature sets (with shaded 95% confidence interval) is superimposed. Kendall τ and P values for the association between the AUC score and taxonomic rank of microbiome-only feature sets are indicated. The Mann–Whitney U test P value for comparing the AUCs of specific pairwise feature sets (depicted by calipers) is also indicated. c, ROC curves for the strain–RvsP classifiers retrained using leave-one-histology-cohort-out cross-validation. Model training and testing were repeated 100 times, with predictions averaged to account for model stochasticity.
Fig. 3
Fig. 3. Firmicutes bacteria dominate the gut microbiome strain–response signature.
a, Phylogenetic tree of bacterial strains in our custom reference library (n = 1,391 strains, excluding n = 6 archaea), highlighting the top 22 strains (labels are colored by impact (that is, feature importance) on RvsP predictions). Four main phyla are shown by the colored ring, with the Ruminococcaceae, Oscillospiraceae and Lachnospiraceae families highlighted. The scale for phylogenetic distance is shown in the center of the tree. b, Phylogenetic tree of the top 22 strains, with the tips colored by strain impact and sized by strain prevalence. The adjacent heat map depicts the presence or absence of genes within the primary butyrate-producing (acetyl-CoA) pathway. Full enzyme (encoding gene) names: acetyl-CoA acetyltransferase (thl), β-hydroxybutyryl-CoA dehydrogenase (bhbd), crotonase (cro), butyryl-CoA dehydrogenase (bcd), and the alternative terminal enzymes butyryl-CoA:acetate CoA transferase (but) and butyrate kinase (buk). c, Boxplots of the sample-wise abundance of butyrate acetyl-CoA terminal enzymes (but + buk), split by patient response (progression (P) n = 51, response (R) n = 26). Boxplot center line indicates the median; box limits indicate the upper and lower quartiles; and whiskers indicate 1.5× the interquartile range. Abundance is normalized as reads per million (RPM). P value by the Mann–Whitney U test is indicated.
Fig. 4
Fig. 4. Meta-analysis reveals that gut microbiome strain–response signatures are ICB regimen specific.
a, World map showing the studies included in our meta-analysis. Bordered circles depict the coordinates of recruiting sites (cities). Pie charts depict the proportion of patients with tumor response, progression or SD. The area of the pie charts depicts the sample size. a2022_Simpson studied neoadjuvant ipilimumab + nivolumab for stage III melanoma and thus used pathological response criteria (International Neoadjuvant Melanoma Consortium criteria); all other studies used the RECIST 1.1 criteria. bFor this study, only the subset of patients (n = 37) with stool collected within 15 days of the start of ICB therapy was included in the meta-analysis. b, ROC curve of strain–RvsP classifiers trained on the discovery cohort (CA209-538) and tested on external CICB cohorts separately. c, ROC curve of strain–RvsP classifiers trained on the discovery cohort (CA209-538) and tested on external anti-PD-1 monotherapy cohorts separately. d, Heat map denoting the AUC scores for strain–RvsP classifiers trained on one dataset (column) and tested on another (rows). Panels are faceted by ICB regimen (CICB or anti-PD-1 monotherapy).
Extended Data Fig. 1
Extended Data Fig. 1. Clinical and gut microbiome characteristics of the CA209-538 clinical trial cohort.
a, Kaplan-Meier curve of progression-free survival stratified by histology (UGB n = 38, NEN n = 32, GYN n = 36). Log-rank test p-value for OS duration across groups printed. Chi-squared test p-value shown for proportion of OS12 per group printed. b, Kaplan-Meier curve of progression-free survival stratified by histology (UGB n = 38, NEN n = 32, GYN n = 36). Log-rank test p-value for PFS duration across groups printed. Chi-squared test of independence p-value shown for proportion of PFS12 per group printed. c, Boxplots of patient baseline blood albumin (g/L) and NLR levels (log-transformed) by BOR category (cPD n = 21, PD n = 30, SD n = 29, PR n = 22, CR n = 4). Boxplot centre line= median; box limits= upper and lower quartiles; whiskers= 1.5x interquartile range. Linear model line-of-best-fit for respective variables (albumin and NLR) versus BOR (with shaded 95% confidence interval) superimposed (in grey). Kendall τ and p-value for association between respective variables (albumin and NLR) and BOR printed. Pairwise Mann-Whitney U test p-values for cPD vs other groups summarized (*: p < 0.05, **: p < 0.01, ***: p < 0.001). Exact p-values as follows: Albumin: cPD vs PD p = 0.0076, cPD vs SD p = 0.00079, cPD vs PR p = 0.0039, cPD vs CR p = 0.034; NLR: cPD vs PD p = 0.00093, cPD vs SD p = 0.00042, cPD vs PR p = 0.0075, cPD vs CR p = 0.025. d, Proportion of explained variance (R2) of microbial composition by each available clinical and technical metadata variable. Calculated using PERMANOVA on inter-sample Aitchison distance (9999 permutations). Metadata variables coloured by category (blood, exposome, patient, technical or tumour). PERMANOVA p-values summarized (*: p < 0.05). Exact p-values available in Supplementary Table 6 (‘ca209-538_permanova’). e, Analysis of baseline microbial variance by moving PFS cut-off (1-monthly intervals, from 1-24 months). Top panel show microbial variance between groups formed by cut-off (inverse PERMANOVA p-value, 999 permutations) using Aitchison distance. Bottom panel shows proportion of progression-free-survivors at respective threshold (that is the proportion in each group). Dashed line with * indicates p = 0.05 threshold. Exact p-values available in Supplementary Tables 7 (‘moving_pfs_permanova’). Acronyms: UGB = upper gastrointestinal & biliary, NEN = neuro-endocrine neoplasms, GYN = gynaecological, PFS = progression-free survival, OS = overall survival, BOR = best overall response, CR = complete response, PR = partial response, SD = stable disease, PD = progressive disease, cPD = clinical progressive disease, chemo = chemotherapy, PPI = proton-pump inhibitor, BMI = body-mass index, LDH = lactate dehydrogenase, NLR = neutrophil:lymphocyte ratio, ECOG = eastern cooperative oncology group, PERMANOVA = permutational multivariate analysis of variance.
Extended Data Fig. 2
Extended Data Fig. 2. Sensitivity analyses of gut microbial strain-efficacy classifiers.
a, Comparison of the RvsP and PFS12 binary endpoints. Venn diagrams show the overlap between the ‘negative and ‘positive’ outcome populations (P/non-PFS12 and R/PFS12 respectively). Size of circles (area) in proportion to population size, with set differences labelled. b, AUC scores for the best iteration of PFS12 classifiers for each feature-set combination during 20-repeated 5-fold cross-validation (100 folds each): clinical (yellow), microbiome (blue) and combined (green), at different taxonomic resolutions. Mean (circle) and standard deviation (error bars) over the 100 folds. Linear model line-of-best-fit for AUC score and taxonomic rank of microbiome-only feature sets (with shaded 95% confidence interval) superimposed. Kendall τ and p-value for association between AUC score and taxonomic rank of microbiome-only feature sets printed. Mann-Whitney U p-value for comparison of AUCs of specific pairwise feature-sets (depicted by callipers) printed. c, Patient’s predicted RvsP (using strain-RvsP RF classifiers trained on the full evaluable cohort) vs. actual BOR outcome (cPD n = 21, PD n = 30, SD n = 29, PR n = 22, CR n = 4). Boxplot centre line= median; box limits= upper and lower quartiles; whiskers= 1.5x interquartile range. Kendall rank correlation τ and p-value for association between predicted RvsP and actual BOR printed. d, Kaplan-Meier overall survival curves for those patients with a best overall response (BOR) of stable disease (n = 29), stratified by those with above median (blue) and below median (red) strain-RvsP RF classifier predictions. Bottom panel shows number of patients at risk at each marked interval. P-value by log-rank test printed. Acronyms: P= progressors (RECIST progressive disease (PD) or clinical progressive disease (cPD)), R= responders (RECIST complete response (CR) or partial response (PR)), GYN= gynaecological, NEN= neuro-endocrine neoplasm, UGB= upper gastrointestinal & biliary, ROC= receiver operating characteristic, AUC= area under curve, OS= overall survival, SD= stable disease, RvsP= response versus progression, cPD= clinical progressive disease, PD= progressive disease, SD= stable disease, PR= partial response, CR = complete response.
Extended Data Fig. 3
Extended Data Fig. 3. Identification and metabolic-potential profiling of the top 22 response predictive strains.
a, Kernel density plot of impact (feature importance) of strains in the strain-RvsP classifier. The top 22 strains with absolute impact within half maximal value shown (coloured by importance, and size by prevalence). b, Strain impact (absolute) versus prevalence in the CA209-538 cohort. Top 22 strains coloured (blue and red for positive and negative associations with response, respectively), with importance threshold depicted (red dashed line). c, Plot of principal coordinate 1 vs 2 using Jaccard dissimilarity of metabolic pathway presence/absence for top 22 strain genomes. Points (individual strains) coloured by impact on RvsP, and size by prevalence. Acronyms: PCo= principle coordinate.
Extended Data Fig. 4
Extended Data Fig. 4. Heterogeneity of baseline gut microbial compositions across meta-analysis cohorts.
a, Proportion of quality-controlled paired-end reads aligned by Bowtie 2 (red), and ultimately used for abundance estimation after stringent filtering (cyan). Organised by study (2017_FRANKEL n = 39, 2018_MATSON n = 39, 2021_ANDREWS n = 46, LEE n = 165, 2022_MCCULLOCH n = 37, 2022_ 2022_SIMPSON n = 38, CA209-538 n = 106). Boxplot central line= median, box limits= upper and lower quartiles, and whiskers= 1.5x interquartile range. Median printed within each boxplot. b, Proportion of explained variance (R2) of microbial composition by metadata variables (grouped into ‘exposome’, ‘technical’ and ‘tumour’ categories. R2 values (printed on bar) calculated using PERMANOVA (9999 permutations). c, PCA plot of samples by CLR-transformed abundances (Aitchison’s distance), with points coloured by sample city (the variable explaining the most variance). Ellipses depict 0.8 of each group’s multivariate t-distribution. PERMANOVA p-value and R2 using 9999 permutations printed. d, PCA plot of samples by CLR-transformed abundances (Aitchison’s distance), with points coloured by extraction kit (the variable explaining the second-most variance). Ellipses depict 0.8 of each group’s multivariate t-distribution. PERMANOVA p-value and R2 using 9999 permutations printed. Acronyms: ICB= immune checkpoint blockade, PCo= principle coordinate.

References

    1. Curran MA, Montalvo W, Yagita H, Allison JP. PD-1 and CTLA-4 combination blockade expands infiltrating T cells and reduces regulatory T and myeloid cells within B16 melanoma tumors. Proc. Natl Acad. Sci. USA. 2010;107:4275–4280. doi: 10.1073/pnas.0915174107. - DOI - PMC - PubMed
    1. Wolchok JD, et al. Overall survival with combined nivolumab and ipilimumab in advanced melanoma. N. Engl. J. Med. 2017;377:1345–1356. doi: 10.1056/NEJMoa1709684. - DOI - PMC - PubMed
    1. Motzer RJ, et al. Nivolumab plus ipilimumab versus sunitinib in advanced renal-cell carcinoma. N. Engl. J. Med. 2018;378:1277–1290. doi: 10.1056/NEJMoa1712126. - DOI - PMC - PubMed
    1. Hellmann MD, et al. Nivolumab plus ipilimumab in advanced non-small-cell lung cancer. N. Engl. J. Med. 2019;381:2020–2031. doi: 10.1056/NEJMoa1910231. - DOI - PubMed
    1. Baas P, et al. First-line nivolumab plus ipilimumab in unresectable malignant pleural mesothelioma (CheckMate 743): a multicentre, randomised, open-label, phase 3 trial. Lancet. 2021;397:375–386. doi: 10.1016/S0140-6736(20)32714-8. - DOI - PubMed

Publication types

MeSH terms

Substances