. 2024 Mar;25(3):1256-1281.
doi: 10.1038/s44319-024-00082-0. Epub 2024 Mar 1.

PHF6-mediated transcriptional control of NSC via Ephrin receptors is impaired in the intellectual disability syndrome BFLS

Affiliations

PHF6-mediated transcriptional control of NSC via Ephrin receptors is impaired in the intellectual disability syndrome BFLS

Dilan Rasool et al. EMBO Rep. 2024 Mar.

Abstract

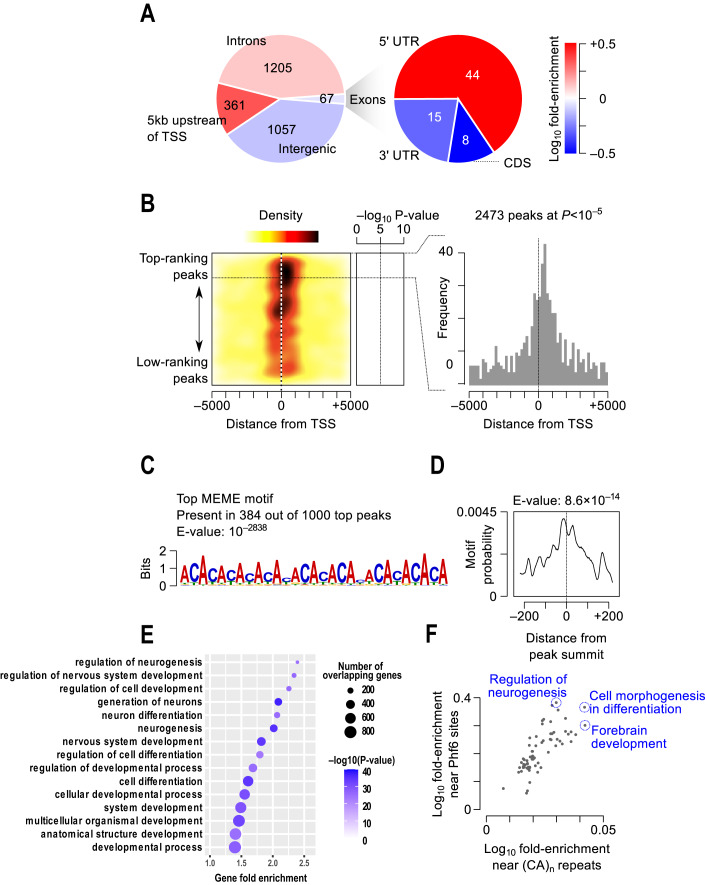
The plant homeodomain zinc-finger protein, PHF6, is a transcriptional regulator, and PHF6 germline mutations cause the X-linked intellectual disability (XLID) Börjeson-Forssman-Lehmann syndrome (BFLS). The mechanisms by which PHF6 regulates transcription and how its mutations cause BFLS remain poorly characterized. Here, we show genome-wide binding of PHF6 in the developing cortex in the vicinity of genes involved in central nervous system development and neurogenesis. Characterization of BFLS mice harbouring PHF6 patient mutations reveals an increase in embryonic neural stem cell (eNSC) self-renewal and a reduction of neural progenitors. We identify a panel of Ephrin receptors (EphRs) as direct transcriptional targets of PHF6. Mechanistically, we show that PHF6 regulation of EphR is impaired in BFLS mice and in conditional Phf6 knock-out mice. Knockdown of EphR-A phenocopies the PHF6 loss-of-function defects in altering eNSCs, and its forced expression rescues defects of BFLS mice-derived eNSCs. Our data indicate that PHF6 directly promotes Ephrin receptor expression to control eNSC behaviour in the developing brain, and that this pathway is impaired in BFLS.

Keywords: BFLS; Ephrin Receptors; Intellectual Disability; Neural Stem Cells; PHF6.


Conflict of interest statement

The authors declare no competing interests.

Figures

Figure 1
Figure 1. Genomic distribution of PHF6 binding sites in the developing cortex.
(A) The numbers of PHF6 sites that overlap different genomic regions are shown in the pie chart. The right pie chart shows a breakdown of sites that overlap exonic regions. The colour gradient, shown on the right, represents the logarithm of enrichment of PHF6 sites in each region relative to random expectation. Only PHF6 sites with P < 10–5 are included in the charts. (B) The heatmap on the left shows the distribution of PHF6 sites relative to TSS’. The peaks are sorted by ascending order of their P-values (shown in the middle) from the top to the bottom. The colour gradient depicts the frequency of PHF6 sites relative to the position of the nearest TSS, also shown for top-ranking PHF6 sites using the histogram on the right. (CF) PHF6 binds to (CA)n-microsatellite repeats. (C) The sequence logo depicts the top motif identified by MEME-ChIP [PMID: 21486936]. (D) The distribution of the (CA)n motif relative to the peak summits is shown, as revealed by CentriMo [PMID: 22610855]. (E) Dot plot representation of the GO terms that are enriched near PHF6 sites. Only the top 15 terms with the most significant p-values are shown. The x-axis shows the fold-enrichment of the term, while the dot size and colour represent the number of PHF6 targets that overlap the GO term and the hypergeometric p-value, respectively. (F) Each dot in the scatterplot represents a GO term that is significantly enriched in both the GREAT analysis of (CA)n simple repeats and the GREAT analysis of PHF6 sites. The x- and y-axes reflect the logarithm of the hypergeometric fold-enrichment of the terms. The GO terms with the largest enrichment are highlighted. n = 6 mouse cortices were pooled for each PHF6 ChIP and IgG control ChIP, where n represents an independent biological sample.
Figure 2
Figure 2. Position-dependent effect of PHF6 on transcription.
(A,B) Phf6 KD and control cortical progenitors were subjected to mRNA-seq analysis (n = 3). Plots represent differentially regulated candidate target genes (A), and functional annotation of downregulated versus upregulated genes (B). GO term enrichment analysis was performed using CPDB (Kamburov et al, 2011). (C,D) PHF6 peak-gene associations within +/− 2Kb of TSS and the effect of Phf6 KD (n = 3) on expression is presented. (E) PolII signal near the TSS of the PHF6-bound genes is shown using the colour gradient in the heatmap. The rows represent the genes, sorted based on the position of the PHF6 site. The PHF6 binding sites are depicted in blue. The vertical dotted lines delineate the +/−300 bp region around the TSS’. The horizontal dotted lines delineate the genes with a PHF6 site within this +/−300 bp region. (F) The expression changes in Phf6 KD cells as a function of the binding position of PHF6. Each data point shows the average for 50 genes that have PHF6 binding, with the binding site location relative to the TSS shown on the x-axis. Data information: Error bars represent ± SEM. mRNA-seq raw reads were mapped to mm10 genome using HISAT2 (Kim et al, 2015), followed by duplicate read removal using samtools. Gene-level read counts were obtained by HTSeq (Anders et al, 2015), using gene annotations from GENCODE (release M9). Genes with a minimum of 150 reads in at least one sample were retained. Gene set analysis was performed using ConsensusPathDB (Kamburov et al, 2011). n represents an independent biological sample.
Figure 3
Figure 3. PHF6 suppresses self-renewal of eNSCs.
(AC) eNSC were isolated and cultured from WT mice at E14 and Phf6 KD was induced using an siRNA approach. Samples were analyzed using a limiting dilution assay (LDA) (A,B) and immunoblotting (C) using antibodies indicated on the blot. (DJ) eNSCs were cultured from Phf6-/Y / Nestin-CreERT2+ and control Phf6loxP/Y / Nestin-CreERT2- mouse brains at ~E15 and were subjected to immunoblotting analysis (D), ELDA (E) (p = 0.00686), LDA (F), sphere diameter (G,H) (p < 0.0001), RT-qPCR analysis using Nestin and Sox2 primers (I), and 5-ethynyl-2’-deoxyuridine (EdU) analysis (J). (K,L) eNSCs were cultured from C99F (K), R342X (L) and corresponding wild-type control mice. mRNA expression of Nestin and Sox2 were analyzed by RT-qPCR. (MP) eNSC were cultured from R342X mice and wild-type control mice and were subjected to ELDA (M,N) (p = 0.0211), LDA (O), and alamarBlue analysis (P) 7 days post-plating. Scale bar represents 100 µm. Data information: Data are presented as mean ± SEM. *p < 0.05, **p < 0.01, ***p < 0.001 (two-tailed unpaired student t-test). Representative plots of n > 3 independent replicates are shown in (A,CE,G,J,M,N), data in panels (B,F,H,I,K,L,O,P) are plotted with n > 3 mean +/− SEM. n represents an independent biological sample. Source data are available online for this figure.
Figure 4
Figure 4. Cell type specific co-expression analysis of EphR and Phf6 in mouse cerebral cortex.
(AF) Low-dimensional representation of single cells from mouse cerebral cortex, based on UMAP embedding of single-cell RNA-seq data [Data ref: (Di Bella et al, 2021)] are shown. Cells are coloured based on animal age (A), or the expression of Phf6 (B), EphA4 (C), EphA7 (D), EphB1 (E), or EphB2 (F). (G) Heatmap representation of the Pearson correlation coefficients between Phf6 and EphR across various cell types are shown. Correlation values were calculated using imputed gene expression profiles after applying MAGIC (Van Dijk et al, 2018). (H) UMAP embedding of cells are coloured by cell type. UMAP coordinates and cell type annotations are from [Data ref: (Di Bella et al, 2021) (GEO GSE153164)].
Figure 5
Figure 5. EphR are direct PHF6 targets.
(A,B) eNSCs were cultured from Phf6-/Y / Nestin-CreERT2+ and control Phf6loxP/Y / Nestin-CreERT2- at ~E15 and mRNA and protein expression of EphR were analyzed by RT-qPCR (A) and immunoblotting (B). (C,D) mRNA and protein of brain tissue obtained from E14 R342X and wild-type control mice were analyzed as described in (A,B). (E,F) Cerebral cortical tissues were isolated from WT and R342X mice at E14 (E) or at P0 (F). Samples were subjected to ChIP-qPCR using a PHF6 antibody. Zfp735 loci was used as negative control for the PCR. (G) Dual luciferase reporter assay was performed in WT or R342X eNSC cultures 48 h following electroporation with pGL4.23-EphA4, pGL4.23-EphA7, pGL4.23-EphB1 or pGL4.23-basic reporter plasmids. RLU Relative luminescence units.  Data information: Data are presented as mean ± SEM. *p < 0.05, **p < 0.01, ***p < 0.001. Two-tailed unpaired student t-test (A,C,G), one-way ANOVA (E,F). Representative data of n > 3 independent replicates are shown in panels (B,D). Data in panels (A,C,EG) are plotted with n > 3 mean ± SEM. n represents an independent biological sample. Source data are available online for this figure.
Figure 6
Figure 6. EphA-family of receptors rescues the eNSC phenotype in R342X mice.
(AD) WT eNSCs cultured at E14 were electroporated with siRNA targeting each of the EphR followed by self-renewal analysis. ELDA plots are presented for EphA4 (A) (p > 0.00001), EphA7 (B) (p = 0.0219), EphB1 (C) (p = 0.426), and EphB2 (D) (p = 0.569). (E,F) Protein expression of each EPHR, SOX2 and NESTIN were analyzed by immunoblotting. B-ACTIN was used as loading control. (GJ) E14 WT eNSCs were electroporated with pLVX.GFP and pLVX.EphA4-GFP constructs followed by ELDA (G) (p = 0.00355), and stem cell frequency analysis (H) (p = 0.0527), immunoblotting using EPHA4, NESTIN, SOX2, and GFP antibodies (I), and sphere diameter analysis (J) (p = 0.0017). (KP) R342X and WT eNSCs cultured at E14 were electroporated with pLVX.GFP, pLVX.EphA4-GFP, and pLVX.EphA7-GFP and samples were subjected to immunoblotting analysis with EPHA4, EPHA7, and GFP antibodies (K,L), ELDA (M,O), and sphere analysis (N,P) following 7 days in culture [p = 0.00264 (M) and p = 0.00255 (O)]. Data information: Data are presented as mean ± SEM. *p < 0.05, **p < 0.01, ***p < 0.001. (H,J) two-tailed unpaired student t-test, (N,P) One-way ANOVA with Tukey’s multiple comparisons test. Representative data of n > 3 independent replicates are shown in panels (AG,I,KM,O). Data in panels (H,J,N,P) are plotted with n > 3 mean +/− SEM. n represents an independent biological sample. Source data are available online for this figure.
Figure 7
Figure 7. BFLS patient mouse models exhibit imbalance in the percent population of stem cell and neural progenitors.
(A,B) Protein expression of PHF6, SOX2, and NESTIN in C99F-m (A) or R342X (B) E14 brains were analyzed with immunoblotting. GAPDH or TUBULIN were used as loading controls. (CF) E14 brains were sectioned at a thickness of 8 μm and were subjected to staining using SOX2 and TBR2 antibodies. DAPI was used as a nuclei marker. Percentage of SOX2+ (C) (p = 0.0084), TBR2+ (D) (p = 0.001), and SOX2+/TBR2+ merged (E) cells were quantified using FIJI software. Representative images are shown (F). Scale bar represents 100 µm. Data information: Data are presented as mean ± SEM. *p < 0.05, **p < 0.01, ***p < 0.001 for panels (CE), two-tailed unpaired student t-test (n > 3 independent replicates). Data in (A,B) represents 3 biological replicates (n = 3 mice). Source data are available online for this figure.
Figure EV1
Figure EV1. PHF6 ChIP-Seq analysis.
(A) PHF6 ChIP-seq cross-correlation analysis was conducted using cross-correlation metrics as described in Landt et al, (Landt et al, 2012). (B) Example ChIP-seq tracks for PHF6 pull-down and IgG control. (CA)n repeats are demarcated with red boxes, while the blue boxes represent the identified PHF6 peak.
Figure EV2
Figure EV2. PHF6 regulation of proliferation in neuroblastoma (N2A) cells.
(AC) N2A cells were transfected with Phf6 (PHF6-GFP) or GFP-expressing control (GFP) constructs. (A) Gene expression was assessed by RT-qPCR (n = 3). (B) Samples were subjected to KI67 staining for assessment of proliferation (n > 3, representative image shown). Scale bar represents 20 µm. (C) Quantification of percent KI67 positive cells are shown (n > 3). Data information: Data are presented as mean ± SEM. *p < 0.05, **p < 0.01, ***p < 0.001 (two-tailed unpaired student t-test). n represents an independent biological sample.
Figure EV3
Figure EV3. Characterization of Phf6/Nestin-Cre and BFLS mouse brain development.
(A,B) Immunofluorescence (IF) staining of coronal sections from P0 (A) and E13.5 (B) for Phf6-/Y / Nestin-Cre+ and Phf6loxp/Y / Nestin-Cre- male mice using a PHF6 antibody (green) in the cerebral cortex. Nuclei were counterstained by Hoechst. Scale bars represent 50 µm. (C) Phf6-/Y / Nestin-Cre+ and Phf6loxp/Y / Nestin-Cre male mice were collected at P0 and subjected to Nissl staining with sagittal sections shown. Scale bars represent 500 µm in lower magnification and 250 µm in higher magnification photomicrographs. (D) IF staining of coronal sections from ~E15 male mice using a SOX2 antibody is shown. Scale bar represents 100 µm at lower magnification and 10 µm at higher magnification. (E) IF staining of coronal sections from P0 using cortical layer markers: SATB2 (green, layer II-V), TBR1 (red, layer VI), and CTIP2 (grey, layer V). Nuclei were counterstained by Hoechst. The cortical wall spanning from the basal of ventricle zone to the pial surface was equally divided into ten bins, the bin 1 covers the most superficial layer and bin 10 covers the deepest layer. (F) Comparative analysis of SATB2+ neurons in each segment of P0 male mice (n = 3). (G) Comparative analysis of Hoechst+ nuclei in each segment of P0 male mice (n=3). Scale bars represent 50 µm. (H,I) mRNA and protein of E14 R342X and wild-type control mice were subjected to RT-qPCR for Hopx expression (n > 3) (H) (p = 0.0021), and immunoblotting analysis of cell type-specific markers (I) (n = 3, representative blots shown). (J) R342X and WT mice were collected at P0 and subjected to Nissl staining (n = 2, representative image shown). Coronal sections are shown. Scale bars represent 500 µm. Data information: Data are presented as mean ± SEM. *p < 0.05, **p < 0.01, ***p < 0.001. two-tailed unpaired student t-test (H). two-way ANOVA with multiple comparisons (F,G). n represents an independent biological sample. Source data are available online for this figure.
Figure EV4
Figure EV4. Analysis of Phf6 and EphR mRNA expression across development.
(AE) Dot plots showing expression of Phf6 (A), EphA4 (B), EphA7 (C), EphB1 (D), and EphB2 (E) in the mouse cerebral cortex during development where the colour of each dot represents the mean normalized expression values per cell type for a given timepoint. The size of the circle represents the percentage of cells expressing each gene. Single cell mouse RNA-seq data was obtained from GEO GSE153164 [Data ref: (Di Bella et al, 2021)]. (FJ) Analysis of PHF6 and EPHR expression in the human cortex. Average reads per kilobase million (RPKM) values over human developmental time (post-conceptual weeks; pcw) for gene analysis of PHF6 (F), EPHB1 (G), EPHA4 (H), EPHA7 (I), and EPHB2 (J) are shown. Gene analysis was taken from publicly available RNA-seq data taken from the human ventral frontal cortex (VFC) of the Allen Brain Atlas BrainSpan dataset [Data ref: (BrainSpan Atlas of the Developing Human Brain, 2011)].
Figure EV5
Figure EV5. Analysis of PHF6 and EphR expression in BFLS mice.
(A,B) mRNA and protein of E14 C99F-m and wild-type control mice were subjected to RT-qPCR and immunoblotting analysis (n ≥ 3). (C) GFP or PHF6-GFP expressing N2A cells were subjected to ChIP using an antibody to PHF6 or IgG control followed by PCR analysis using primers to EphA4, EphA7 and EphB1. Zfp locus was used as control (n = 3). (D) GFP or PHF6-GFP- expressing cells were electroplated with a luciferase reporter plasmid driven by a promoter containing 583 bp of the EphA4 gene (pGL4.23-EphA4), 550 bp of the EphA7 gene (pGL4.23-EphA7) or 709 bp of the EphB1 gene (pGL4.23-EphB1). The pGL4.23-basic reporter plasmid (pGL4.23) was used as a control. Renilla expression plasmid was used as an internal control for all samples. RLU Relative luminescence unit. Dual luciferase reporter assay was performed 48 h following electroporation (n = 3). (E) N2A cells were electroporated with siRNA against Phf6 (siPhf6) or control siRNA (siCtl) followed by dual luciferase reporter assay at 48 h (n = 3). (F) EPHA4, EPHA7 and PHF6 levels were analyzed by immunoblotting in PHF6-GFP- expressing N2A cells. TUBULIN was used as a loading control. (G) Densitometric quantification of PHF6, EPHA4 and EPHA7 protein level normalized to TUBULIN is shown (n = 3). (H) E14-Cerebral cortical tissues from WT and C99F-m mice were subjected to ChIP-PCR analysis, as described in panel (C). (I) eNSCs cultured from Phf6-/Y / Nestin-CreERT2+ and control Phf6loxP/Y / Nestin-CreERT2- ~E15 mouse brains were subjected to immunoprecipitation (IP) using PHF6 antibody or IgG as control followed by immunoblotting analysis using a PHF6 antibody. (J) eNSCs from Phf6-/Y / Nestin-CreERT2+ and control Phf6loxP/Y / Nestin-CreERT2- mouse brains at ~E15, were subjected to ChIP-PCR using a PHF6 antibody. Zfp735 loci was used as control for the PCR (n = 2). (K,L) Protein expression of EPHB1 (K), EPHB2 (L), SOX2 and NESTIN were analyzed by immunoblotting in EphB1 and EphB2 knockdown (KD) cells. Loading controls of ß-ACTIN and GAPDH were used (n = 2). Data information: Data are presented as mean ± SEM. *p < 0.05, **p < 0.01, ***p < 0.001. [(C,H) one-way ANOVA, (A,D,E,G) two-tailed unpaired student t-test]. n represents an independent biological sample.

References

    1. Ahmed R, Sarwar S, Hu J, Cardin V, Qiu LR, Zapata G, Vandeleur L, Yan K, Lerch JP, Corbett MA, et al. Transgenic mice with an R342X mutation in Phf6 display clinical features of Borjeson-Forssman-Lehmann Syndrome (BFLS) Hum Mol Genet. 2021;30:575–594. doi: 10.1093/hmg/ddab081. - DOI - PMC - PubMed
    1. Anders S, Pyl PT, Huber W. HTSeq—a Python framework to work with high-throughput sequencing data. Bioinformatics. 2015;31:166–169. doi: 10.1093/bioinformatics/btu638. - DOI - PMC - PubMed
    1. Aoki M, Yamashita T, Tohyama M. EphA receptors direct the differentiation of mammalian neural precursor cells through a mitogen-activated protein kinase-dependent pathway. J Biol Chem. 2004;279:32643–32650. doi: 10.1074/jbc.M313247200. - DOI - PubMed
    1. Barquilla A, Pasquale EB (2015) Eph receptors and ephrins: therapeutic opportunities. Annu Rev Pharmacol Toxicol 55:465–487 - PMC - PubMed
    1. Berland S, Alme K, Brendehaug A, Houge G, Hovland R. PHF6 deletions may cause Borjeson-Forssman-Lehmann syndrome in females. Mol Syndromol. 2010;1:294–300. doi: 10.1159/000330111. - DOI - PMC - PubMed

Supplementary concepts