. 2024 Mar 1;30(1):33.
doi: 10.1186/s10020-023-00773-9.

Serotonin as a biomarker of toxin-induced Parkinsonism

Affiliations

Serotonin as a biomarker of toxin-induced Parkinsonism

Anna Marie Buchanan et al. Mol Med. .

Abstract

Background: Loss of dopaminergic neurons underlies the motor symptoms of Parkinson's disease (PD). However stereotypical PD symptoms only manifest after approximately 80% of dopamine neurons have died making dopamine-related motor phenotypes unreliable markers of the earlier stages of the disease. There are other non-motor symptoms, such as depression, that may present decades before motor symptoms.

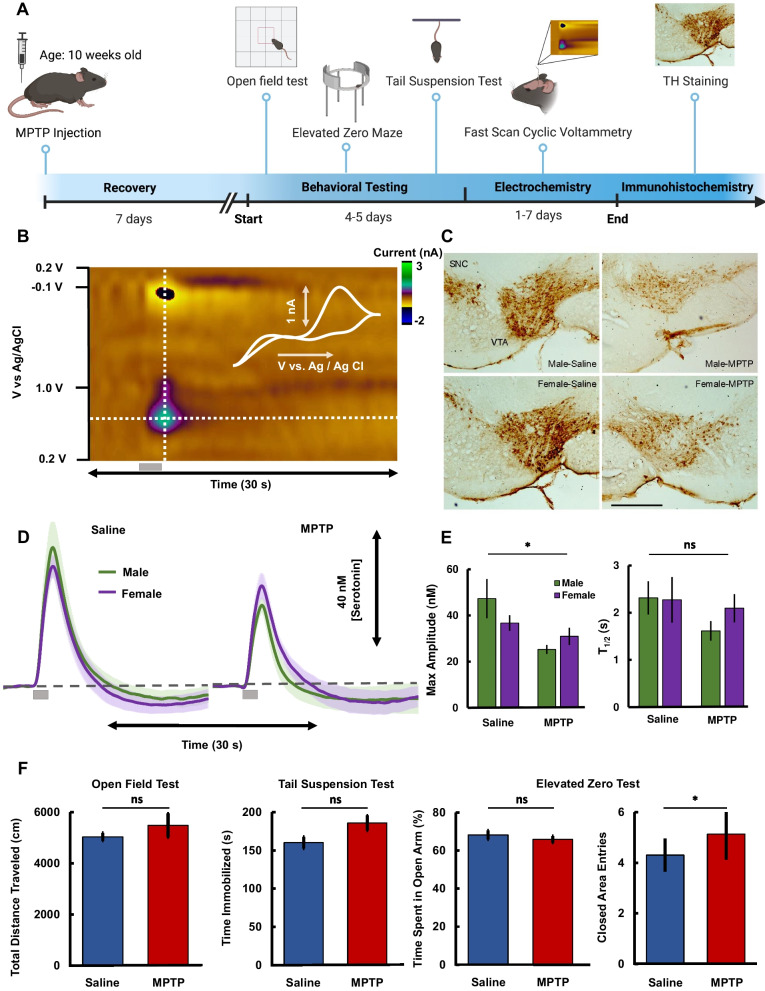
Methods: Because serotonin is implicated in depression, here we use niche, fast electrochemistry paired with mathematical modelling and machine learning to, for the first time, robustly evaluate serotonin neurochemistry in vivo in real time in a toxicological model of Parkinsonism, 1-methyl-4-phenyl-1,2,3,6-tetrahydropyridine (MPTP).

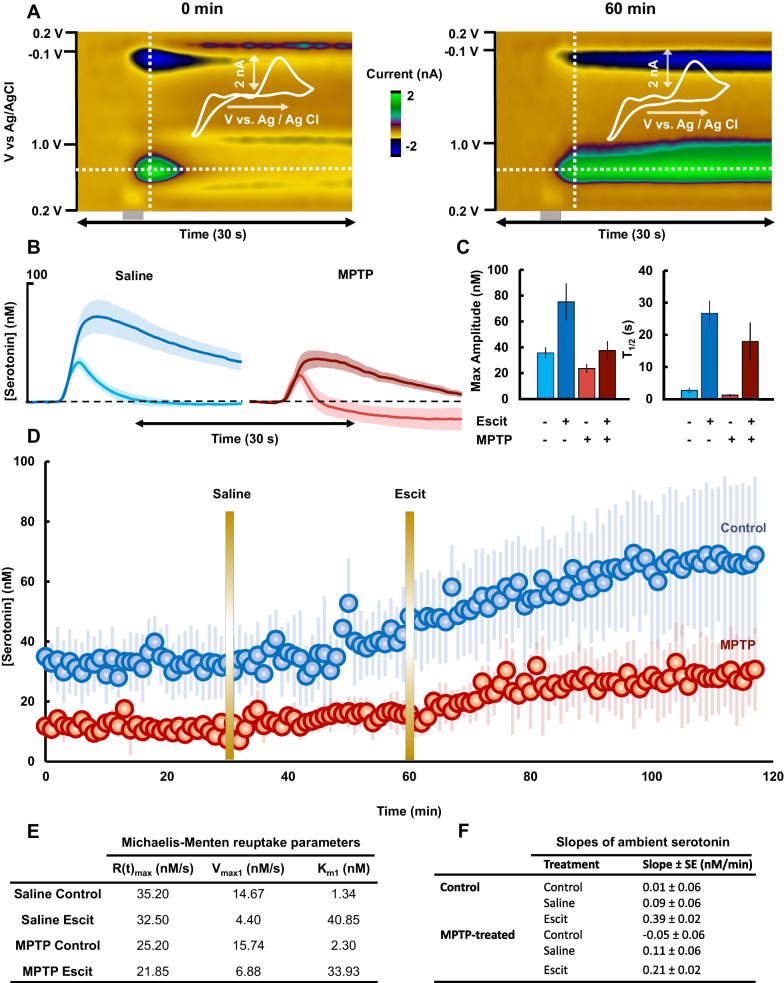
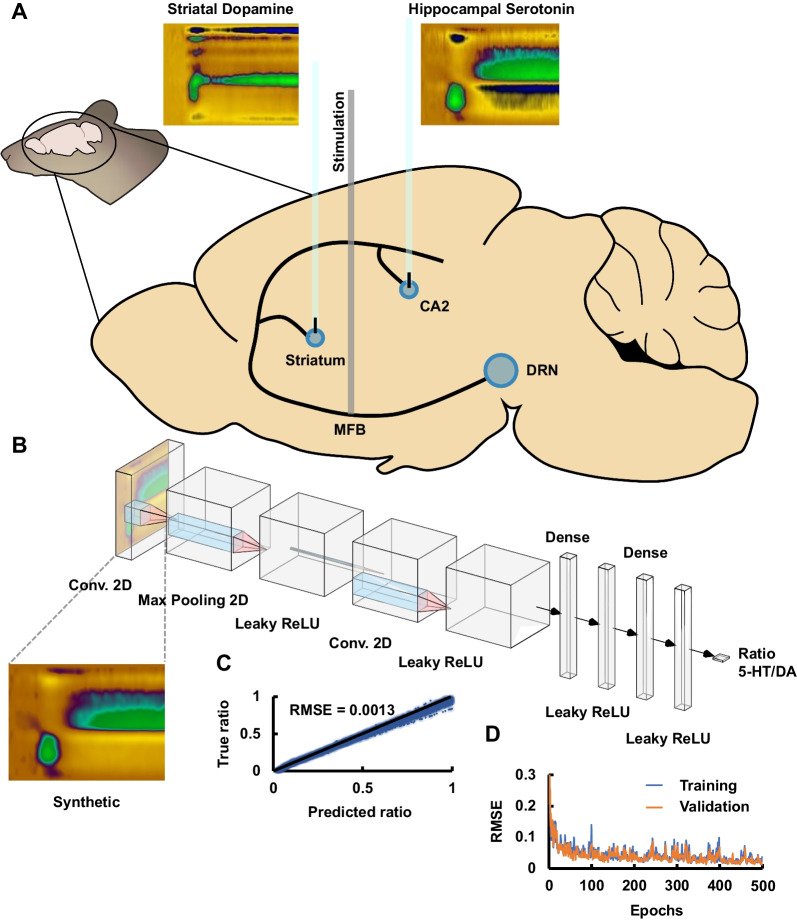
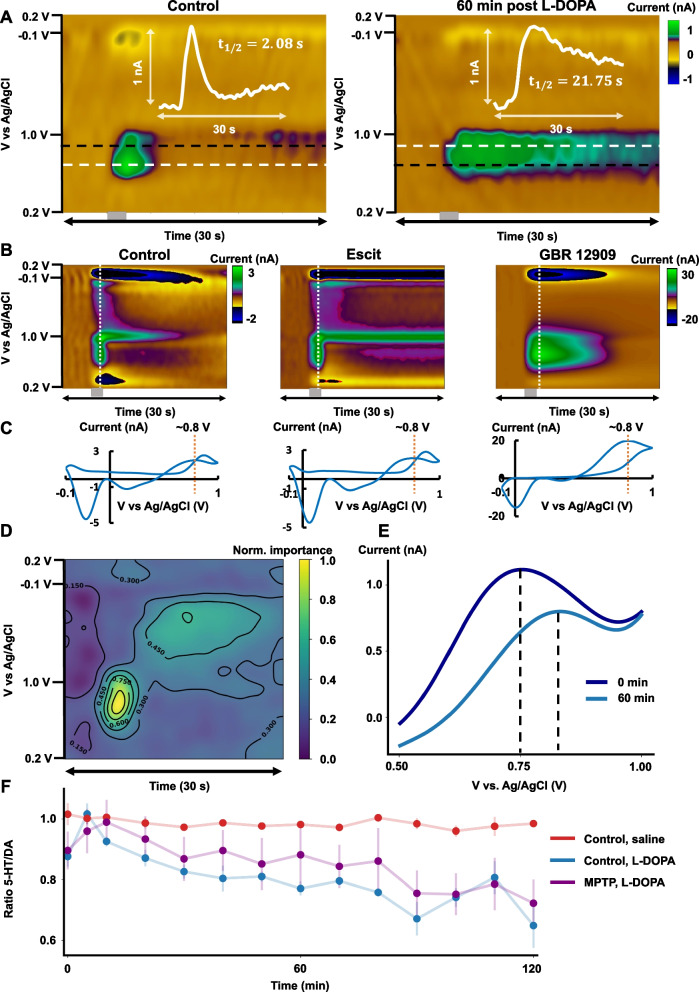
Results: Mice treated with acute MPTP had lower concentrations of in vivo, evoked and ambient serotonin in the hippocampus, consistent with the clinical comorbidity of depression with PD. These mice did not chemically respond to SSRI, as strongly as control animals did, following the clinical literature showing that antidepressant success during PD is highly variable. Following L-DOPA administration, using a novel machine learning analysis tool, we observed a dynamic shift from evoked serotonin release in the hippocampus to dopamine release. We hypothesize that this finding shows, in real time, that serotonergic neurons uptake L-DOPA and produce dopamine at the expense of serotonin, supporting the significant clinical correlation between L-DOPA and depression. Finally, we found that this post L-DOPA dopamine release was less regulated, staying in the synapse for longer. This finding is perhaps due to lack of autoreceptor control and may provide a ground from which to study L-DOPA induced dyskinesia.

Conclusions: These results validate key prior hypotheses about the roles of serotonin during PD and open an avenue to study to potentially improve therapeutics for levodopa-induced dyskinesia and depression.

Keywords: CFM; Depression; FSCV.


Conflict of interest statement

The authors declare no competing financial interests.

Figures

Fig. 1
Fig. 1
A Schematic of experimental paradigm. B Representative color plot in a mouse hippocampus depicting serotonin oxidation in an animal after MPTP. Vertical line shows the CV overlaid in the right-hand corner. Horizontal line shows the concentration vs. time (IT) curves presented in D. C Representative images of tyrosine hydroxylase immunostaining in male (top images) and female (bottom images) mice administered either with saline vehicle (left images) or MPTP (right images). Scale bar is 250 µm in length. D Concentration vs. time curve (average ± SEM) comparing mice administered MPTP (n = 22, 13 male and 9 female) vs. mice administered saline (n = 15, 5 male and 10 female). Male is shown in green while females are shown in purple. E Comparison of max amplitudes and serotonin reuptake decay constant (average ± SEM) of FSCV curves presented in D. F Comparison of test scores between control mice (blue) and MPTP-treated mice (red) (tail suspension test: n = 14 control, n = 18 MPTP-treated; open field test: n = 10 control, n = 12 MPTP-treated; elevated zero maze test, n = 17 control, n = 22 MPTP-treated)
Fig. 2
Fig. 2
A Representative color plot depicting serotonin oxidation before (left) and after Escit administration (right) in a MPTP-administered mouse (hippocampus). Vertical line shows the CV overlaid in the right-hand corner. Horizontal line shows the concentration vs time curves presented in B. B Concentration vs. time curve comparing mice administered saline before (light blue) and 60 min after (dark blue) Escit (10 mg kg−1) administration (n = 5) and MPTP-administered mice before (light red) and after (dark red) Escit (10 mg kg−1) administration (n = 5). C Comparison of Ampmax and t1/2 of FSCV curves presented in B. Saline animals evoke significantly higher serotonin than MPTP-administered mice before (post-hoc t-test, Ampmax = 35.21 ± 2.17 nM vs. 23.56 ± 1.70 nM, p = 0.0336) and after Escit (post-hoc test, Ampmax = 75.22 ± 14.24 nM vs. 37.46 ± 7.32 nM, p = 0.0095. No statistical significance was found in the reuptake rate of evoked serotonin between saline and MPTP-administered animals before (post-hoc t-test, t1/2 = 2.47 ± 0.82 s vs. 1.24 ± 0.31 s, p = 1.000) or after Escit administration (post-hoc test, t1/2 = 26.70 ± 3.89 s vs. 17.92 ± 5.96 s, p = 0.7691). D Average (with SEM as error bars) ambient concentrations of serotonin collected using FSCAV before and after Escit administration for MPTP (red dots, n = 5) and saline (blue dots, n = 5) animals. E Michaelis–Menten kinetic parameters fit to the time traces in B. F ANCOVA slopes and standard error of the slopes of the time series in D
Fig. 3
Fig. 3
A Schematic of the mouse brain and locations of serotonin-rich and dopamine-rich signals drawn to generate the synthetic color plots. B CNN architecture schematic. C True vs. predicted values of the test dataset and RMSE of predicted values. D Training and validation loss (RMSE) of CNN training
Fig. 4
Fig. 4
A Left: Representative color plot depicting serotonin oxidation before L-DOPA administration in an MPTP-administered mouse (hippocampus). Horizontal line (white) shows the shift in the center of the serotonin oxidation. Right: Representative color plot depicting serotonin oxidation 60 min after L-DOPA (50 mg kg−1, i.p) administration. B Dopamine detection in the striatum with the serotonin waveform after Escit and GBR 12909. C Representative CVs from dopamine color plots in B. D Normalized, averaged (n = 15 repetitions) importance of the features in the FSCV color plot. E Representative voltammograms from A show a shift in oxidation potential, 60 min after L-DOPA administration. F Average ± SEM predicted ratios over time after injection of saline over control mice (red trace, n = 3), or L-DOPA (50 mg kg−1) for control mice (blue trace, n = 5) and MPTP-treated mice (purple trace, n = 5)
Fig. 5
Fig. 5
A Schematic of SNc dopamine (DA) and DRN serotonin (5HT) innervation of the hippocampus, and the effects of L-DOPA. The model was previously developed in (Reed et al. 2012) and extended here by adding the stimulation of the DRN by the SNc. It is the decrease of this stimulation, as SNc cells die, that causes the decline of serotonin in the hippocampus. B Simulation of relative concentrations of serotonin and dopamine in the hippocampus depends on the fractions of surviving SNc cells. C The course of extracellular dopamine in the hippocampus after a L-DOPA dose and its dependence on the fraction of SNc cells alive. D Simulation of hippocampal extracellular serotonin upon administration of Escit 60 min after the start of the simulation (see “Methods and Materials”). The MPTP trace (red) is computed by reducing the fraction of SNc cells alive to 0.35(Reed et al. 2012)

References

    1. Abadi M, et al. TensorFlow: large-scale machine learning on heterogeneous systems. In: Proceedings of the 12th USENIX conference on Operating Systems Design and Implementation. USENIX Association. 2016. pp. 265–83. http://tensorflow.org/. Accessed 13 Aug 2016.
    1. Abdalla A, Atcherley CW, Pathirathna P, Samaranayake S, Qiang B, Peña E, Morgan SL, Heien ML, Hashemi P. In vivo ambient serotonin measurements at carbon-fiber microelectrodes. Anal Chem. 2017;89:9703–9711. doi: 10.1021/acs.analchem.7b01257. - DOI - PMC - PubMed
    1. Agid Y. Parkinson’s disease: pathophysiology. The Lancet. 1991;337:1321–1324. doi: 10.1016/0140-6736(91)92989-F. - DOI - PubMed
    1. Albin RL, Koeppe RA, Bohnen NI, Wernette K, Kilbourn MA, Frey KA. Spared caudal brainstem SERT binding in early Parkinson’s disease. J Cereb Blood Flow Metab. 2008;28:441–444. doi: 10.1038/sj.jcbfm.9600599. - DOI - PubMed
    1. Alex KD, Pehek E. Pharmacologic mechanisms of serotonergic regulation of dopamine neurotransmission. Pharmacol Ther. 2007;113:296–320. doi: 10.1016/j.pharmthera.2006.08.004. - DOI - PMC - PubMed